
MRD:ce1116
1. What value do the different components of the gradient of the potential energy surface have at a minimum and at a transition structure? Briefly explain how minima and transition structures can be distinguished using the curvature of the potential energy surface.
The gradient of the plot at the transition state and minima is equal to zero. The transition state occurs at a saddle-point, where there is a minimum in one direction (the second differential is greater than zero) and a maxima (the second differential is less than zero) in the other direction. If the point is at a minimum then the second differential in both directions will be greater than zero.
2. Report your best estimate of the transition state position (rts) and explain your reasoning illustrating it with a “Internuclear Distances vs Time” plot for a relevant trajectory.
The distance at transition state for both A-B and B-C, rts = 0.908
A rough estimate for the transition state is found by observing where the internuclear distances are equal. This value was used to perform trial and error runs and observing the results on the internuclear distance vs time plots. There is minimum (negligible) oscillation of the internuclear distance (so the bond lengths are effectively constant) at this separation so it was determined to be the transition state.
The internuclear distance vs time plot is below (Figure 1)and contour plot below (Figure 2) also demonstrates that the transition state is a single point, perfectly balanced 'between a maxima and a minima, where no oscillatory behaviour occurs:
Figure 1: 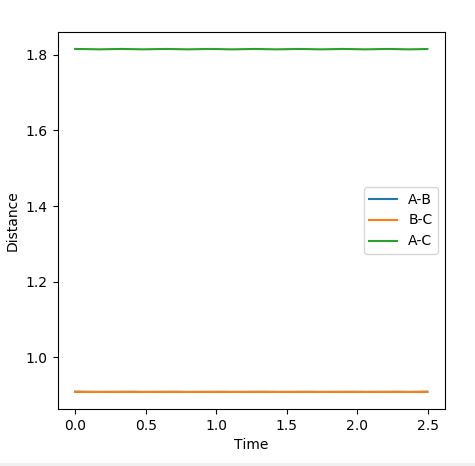

Figure 2: 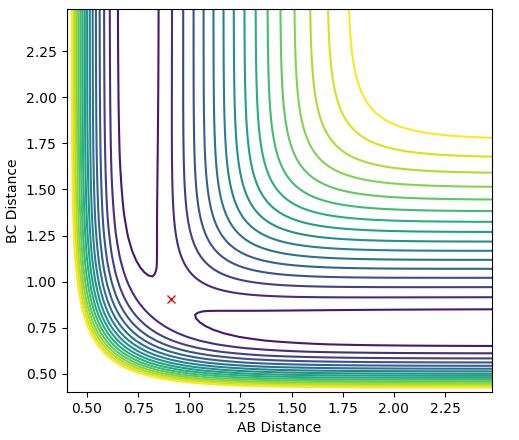

3.Comment on how the mep and the trajectory you just calculated differ.
Applying:
A-B= rts + 0.01
B-C= rts
Both the dynamics (Figure 4) and the mep (Figure 3) calculation begin at the transition state, proceeding towards the products. The trajectory of the dynamics calculation is oscillatory, presenting that the distance between A and B tends to infinity while the B-C bond is relatively constant and vibrates. The mep has velocity equal to zero at any point in time, therefore shows no oscillatory behaviour as the trajectory follows the floor of the potential valley. The reaction path follows the valley floor and ends once the gradient seems to become more level, rather than tending to infinity. The dynamics calculation shows that after the reaction there is an oscillation of the newly formed B-C bond and repulsion from A as it moves away from the system, energy transfers between vibrational and kinetic energy. Whereas, for the mep graph there is no oscillation of the new bond so all of the energy is kinetic energy.
Ng611 (talk) 19:19, 24 May 2018 (BST) True, but why is this the case? How do the alogrithms for MEP calculations and dynamics calculations differ?
Figure 3:  Figure 4:
The length of the B-C distance is increased instead (r1 = rts, r2 = rts +0.01) and the trajectory is shown below (Figure 5) for mep:
Figure 5:

This trajectory is a reflection in the x=y plane since the system is displaced from the transition state towards the product.
Final A-B distance = 0.775215
Final B-C distance = 9.97975
Average final momenta = 1.692
4. Complete the table by adding a column with the total energy, and another column reporting if the trajectory is reactive or unreactive. For each set of initial conditions, provide a plot of the trajectory and a small description for what happens along the trajectory.
| Test number | p1 | p2 | Energy | Reactive/unreactive | Trajectory description |
|---|---|---|---|---|---|
| 1 | -1.25 | -2.5 | -99.119 | reactive | A-B approaches C, the transition state forms and B-C moves away from particle A |
| 2 | -1.5 | -2.0 | -100.456 | unreactive | A-B approaches C, there is no reaction and they move apart |
| 3 | -1.5 | -2.5 | -98.956 | reactive | A-B approaches C, the transition state forms and B-C moves away from particle A |
| 4 | -2.5 | -5.0 | -84.956 | unreactive | the system crosses the transition state and the system reverts back to the reactants |
| 5 | -2.5 | -5.2 | -83.416 | reactive | A-B crosses the transition state region on approach to C and there is a prolonged interaction before A-C forms |
Test 1:  Test 2:
Test 3:  Test 4:
Test 5: 

5. State what are the main assumptions of Transition State Theory. Given the results you have obtained, how will Transition State Theory predictions for reaction rate values compare with experimental values?
- Once a system has crossed the transition state region, it cannot revert to back to reactants[1].
- The reaction coordination may be treated separately from the other forms of motion and treated as the translation in the transition state.
- The transition states are distributed according to the Maxwell-Boltzmann distribution.
The reaction rates are overestimated since the Transition State Theory does not predict that some of the reactions will return to reactants after reaching the transition state region. However, it also does not take into account that tunnelling may occur which bypasses the transition state, therefore underestimates the reaction rate with an extent varying with the barrier height that the system must tunnel through. Overall, the effect is an overestimate due to the system being able to return to reactants after passing the transition state region.
Ng611 (talk) 19:20, 24 May 2018 (BST) Good explanation, well done!
6. Classify the F + H2 and H + HF reactions according to their energetics (endothermic or exothermic). How does this relate to the bond strength of the chemical species involved?
F + H2 is an exothermic process since the energy of the products is lower than the reactants, this means that the bonds formed are stronger than those that are broken because energy is released in the favourable formation of H-F. This idea supports what would be predicted since HF is known to be a very strong bond.
H + HF is an endothermic reaction since the energy of the reactants is lower than the products, this means that the bonds formed are weaker than the bonds broken because energy is required to break the strong H-F bond.
7. Locate the approximate position of the transition state.
F + H2 - A-B=0.74, B-C=1.814: 
H + HF - A-B=1.814, B-C=0.74: 
Each of the transition state positions above are located due to there being minimum oscillation at these points, so there structure is balanced here on a saddle-point - not forming products or reverting back to reactants similarly to question 2.
8. Report the activation energy for both reactions.
The location of the activation energy was found by distorting the position from the transition state by a small amount and observing the energy vs time plot to calculate the energy difference between the reactant and the transition state for each reaction.
For F + H2 activation energy: +0.731 kcal/mol

For H + HF activation energy: +28.1928 kcal/mol

9. In light of the fact that energy is conserved, discuss the mechanism of release of the reaction energy. How could this be confirmed experimentally?
For reaction to proceed:
A-B= 0.84
B-C= 1.4
Momenta= 0
Energy is exchanged between potential energy and kinetic energy (as shown in the plot below). The kinetic energy is distributed as vibrational energy as the new bond forms and vibrates and manifests in the entire system as heat, therefore resulting in an exothermic reaction. This type of reaction is predicted by the result in question 6 showing a decrease in energy from the reactants to products as heat energy is lost to the surroundings. Additionally, this could be experimentally determined by measuring the heat change of the reaction over time - using a calorimeter - and hence enthalpy can be calculated and this enthalpy is expected to be negative.

10. Discuss how the distribution of energy between different modes (translation and vibration) affect the efficiency of the reaction, and how this is influenced by the position of the transition state.
An exothermic reaction has an early transition state, and Polanyi[2] proposed that translational energy is better at promoting such a reaction to occur than vibrational energy. The conservation of energy still applies so the vibrational energy increases from reactants to products. The number of different energy modes in the products affects the efficiency of the reaction, the fewer modes, the more efficient the reaction since there is more free energy available for reaction. In an exothermic process the reactants possess mainly translational energy whereas in an endothermic reaction the reactants possess mainly vibrational energy so each of these affects the efficiency of the respective reactions.
This theory is illustrated below as from the low vibrational energy plots (Case 2 and Case 4) only Case 2 is successful as this is exothermic, and for the high vibrational energy plots (Case 1 and Case 3) only Case 3 is successful as this is endothermic.
Case 1-exothermic reaction with high vibrational energy (r1=0.74, r2=2.3, p1=3, p2=-3): 
Case 2-exothermic reaction with low vibrational energy (r1=0.74, r2=2.3, p1=0.1, p2=-1): 
Case 3-endothermic reaction with high vibrational energy (r1=0.74, r2=2.3, p1=-4, p2=0.1): 
Case 4-endothermic reaction with low vibrational energy (r1=0.74, r2=2.3, p1=0.1, p2=-3): 
Ng611 (talk) 19:26, 24 May 2018 (BST) Overall a good report. Some more discussion regarding your section on polanyi's rules would be useful. Try also to structure your report more like a report, rather than simply answering the questions (this isn't a big deal, but I personally prefer it). Besides this, well done.