MRD:ccl2166
Molecular Reaction Dynamics Report
The System
In this computational investigation, reaction from linear collision of an single atom and a diatomic molecule are studied. This is illustrated in the diagram below:

The three atoms involved are labeled as A, B and C. rAB is the distance between the atom A and B and rBC is the distance between the atom B and C. A positive pAB value (p = internuclear momentum) refers to a velocity that increases the interatomic distance between A and B, vise versa for a negative pAB. The same principle applies for pBC.
Mm10114 (talk) 20:45, 14 May 2018 (BST) Very good introduction. It is concise, however, you use a figure to help explain the systems studied here and you define the important variables. Great work.
EXERCISE 1: H + H2 system
Atom A, B and C are all hydrogen.
Dynamics from the transition state region
What value do the different components of the gradient of the potential energy surface have at a minimum and at a transition structure? Briefly explain how minima and transition structures can be distinguished using the curvature of the potential energy surface.
 |
 |
|---|
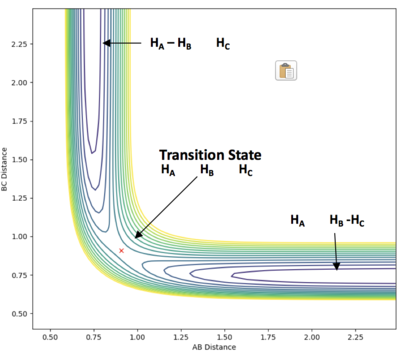
As annotated in the surface plot, point X and Z are the minima and point Y is where the transition state is located. As the products of this reaction is the same as the reactants, the potential surface is symmetrical. For this 2D surface, the first derivative of the potential surface should equal to zero at two different directions (alone the reaction path and perpendicular to the reaction path) at the minimum and at the transition state.
For the minima, the second derivative for both components of the gradient should be positive. For the transition state, there should be a maximum along the reaction path (negative second derivative for this direction for this direction along the curve) and a minimum perpendicular to the reaction path (positive second derivative for this direction along the curve).
Mm10114 (talk) 20:45, 14 May 2018 (BST) Very good and easy to follow discussion. It would be nice if you've also included the mathematical expressions for the derivatives.
Locating the transition state
Report your best estimate of the transition state position (rts) and explain your reasoning illustrating it with a “Internuclear Distances vs Time” plot for a relevant trajectory.
 |
 |
|---|
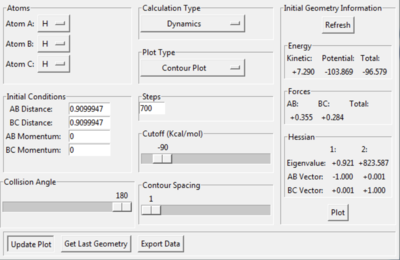
When the steps of calculation is set to 700 and cutoff =-90 kcal/mol, the transition state position is found to be at 0.9099947 Å.
At the transition state, rAB = rBC = rts. rAB is the distance between hydrogen atom A and B. rBC is the distance between hydrogen atom B and C. This is reflected in the internuclear distances vs time plot. rAB is always equal to rBC (the two slope overlaps - the blue rAB slope is behind the orange rBC slope) and they stay constant as time process. Similarly, in the contour plot, the trajectory of the system stays at one position overtime.
When increasing the steps of calculation set to 1000, the trajectory follows the valley floor to HA + HB-HC when rAB and rBC are set to 0.9099947 Å based on a contour plot. By decreasing rAB and rBC to 0.9099946, trajectory follows the valley floor to HA-HB + HA. This demonstrates that the true value for rts is in between 0.9099947 and 0.9099946.
The location of the transition state has been confirmed with mep (minimum energy potential) trials: the same result has been obtained - the rAB and rBC slope stays constant over time. When the initial position is slightly distorted from the transition state (rAB = rBC = rts), the trajectory follows the valley floor to HA + HB-HC as illustrated in the following section.
Mm10114 (talk) 20:45, 14 May 2018 (BST) Very nicely explained. I really like the annotations on the contour plot. You should've added the other plots you discuss here, especially the intermolecular distance vs time plot for MEP, as it does slightly differ from the dynamics version of this plot (the lines do not oscillate, but stay flat).
Trajectories from rAB = rts+δ, rBC = rts
Comment on how the mep and the dynamics trajectory differ.
 |
 |
|---|
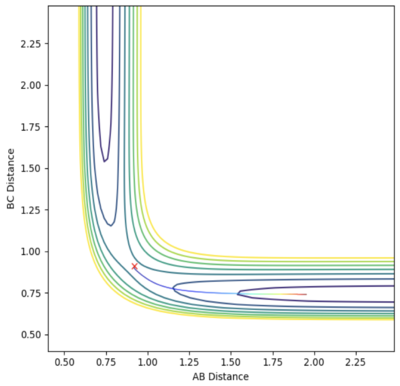
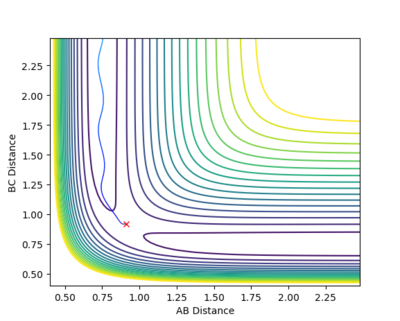
Rounding up to two decimal point, rts = 0.91 Å. The above graph are plotted with the initial condition set to: rAB= 0.92 Å and rBC = 0.91 Å. The momentum values are all set to zero. In both diagram, the the trajectory follows the valley floor to HA + HB-HC.
The dynamics trajectory gives a more realistic picture of the system with the vibration of the H2 molecule taken into the consideration. This oscillation is reflected on the trajectory curve to HA + HB-HC downhill. The mep (minimum energy path) calculation method produce a smooth curve. The minimum energy path is the lowest energy path from reactant to product. In mep, the inertia of the atoms are removed by reseting the velocity to zero for every calculation step, so the vibration are not reflected on the curve.
 |
 |
|---|
By distorting from the transition state in the opposite direction, rAB= 0.91 Å and rBC = 0.92 Å, the trajectory follows the potential hill down to the HC + HA-HB system. The initial pAB and pBC are set to zero. This further confirms the calculated rts and the position of the transition state as this point is the maximum point along the reaction path.
rAB = rts+δ, rBC = rts and rAB = rts, rBC = rts+δ
The final values of the positions rAB(t) rBC(t) and the average momenta pAB(t) pBC(t) at large t with initial rAB and rBC value exchanged (calculation method: dynamics) are compared in the table below (pAB and pBC are set to zero.):
| rAB / Å | rBC / Å | pAB(t) | pBC(t) | rAB(t) / Å | rBC(t) / Å |
|---|---|---|---|---|---|
| 0.91 | 0.92 | 1.26 | 2.48 | 0.71 | 9.03 |
| 0.92 | 0.91 | 2.48 | 1.26 | 9.03 | 0.71 |
The pAB(t) and pBC(t) value has exchanged with an exchange in the initial position parameter exchanged. Similar result is observed for the finial position parameter, rAB(t) and rBC(t).
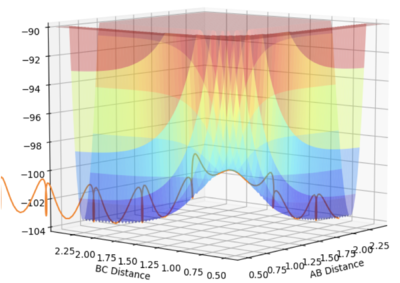
For the trail presented in the "Dynamics from the Transition State Region" section, when reversing the sign of pAB, the H atom dissociate from the H2 molecule instead of colliding as shown below.
 |
 |
|---|
Mm10114 (talk) 20:45, 14 May 2018 (BST) Very nicely done. You might've think about numbering your figures, it would allow you to reference them easily in your main text (this applies to the rest of the report).
Reactive and unreactive trajectories
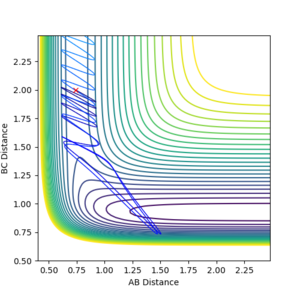
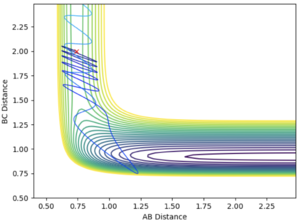
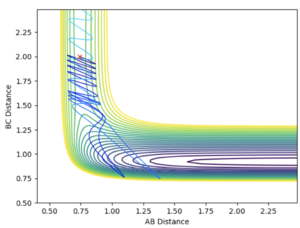
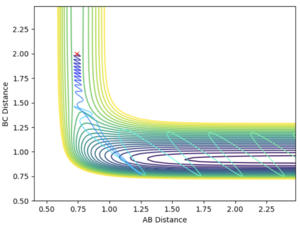
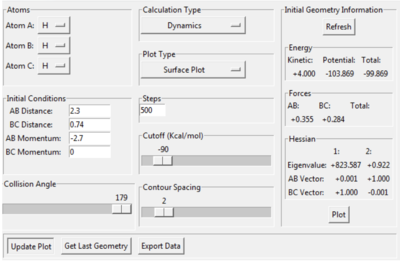
- With the initial position of the atoms stays constant, trajectories are run with different momenta combination.
- The initial positions of the atoms: rBC = 0.74 Å and rAB = 2.0 Å, Steps: 500, Calculation type: dynamics
| System | pBC | pAB | ( Initial Kinetic Energy + Initial Potential Energy =) Total Energy (kcal/mol) | Reactive or Unreactive |
|---|---|---|---|---|
| 1 | -1.25 | -2.5 | ( (4.687) + (-103.706) =) -99.018 | Reactive |
| 2 | -1.5 | -2.0 | (3.250) + (-103.706) =) -100.456 | Unreactive |
| 3 | -1.5 | -2.5 | (4.750) + (-103.706) =) -98.956 | Reactive |
| 4 | -2.5 | -5.0 | (18.750) + (-103.706) =) -84.956 | Unreactive |
| 5 | -2.5 | -5.2 | (20.290) + (-103.706) =) -83.416 | Reactive |
With the initial rBC and rAB remain constant for all the trials, the total energy of the system is determined by the initial kinetic energy (hence the momenta combination)
 |
 |
|---|
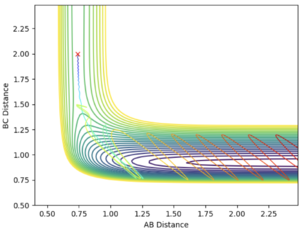
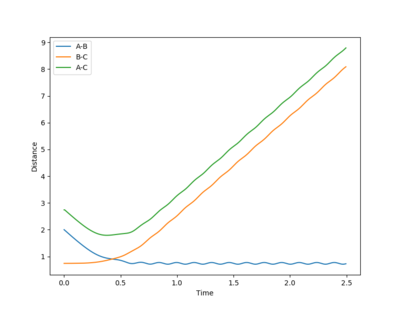
The reaction has taken place in this system. The rAB decreases with the rBC remains roughly constant initially. Before the collision, trajectory of the system is a smooth curve, implying that the system has a greater contribution from the translational energy (pAB is greater than pBC) and there is little vibration between the reactant molecule. After the collision (the system has crossed over the transition state in the direction of the product), the rAB stays constant with the bond forms between HA and HB. The transnational energy on HA has now transferred into vibrational energy of the new H2. The bond between HC and HB has been broken, so the rBC increases.
 |
 |
|---|
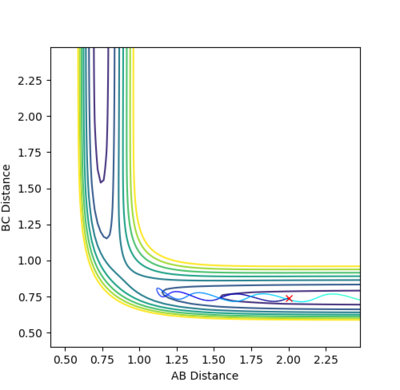
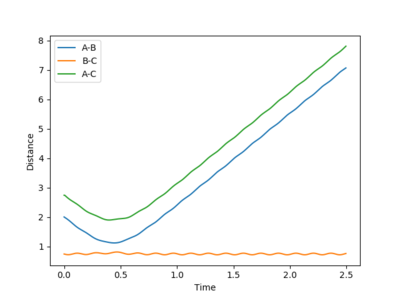
This system is unreactive. It doesn't have enough kinetic energy to reach the transition state and cross over the potential hill. The collision has taken place but no bond has been made or broken. rBC remains constant throughout the trajectory. After the collision, rAB increases as the distance between the H2 molecule and the HA atom increases.
 |
 |
|---|
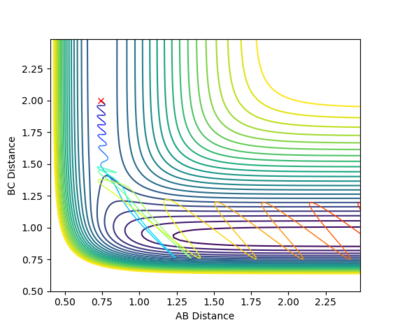
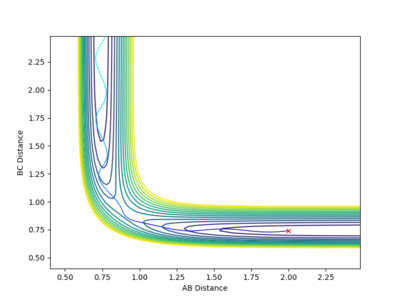
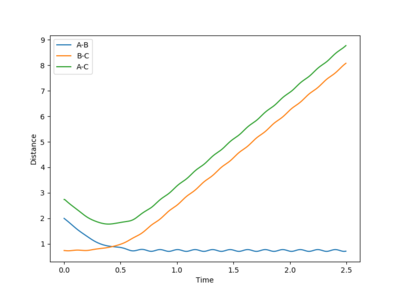
This system is reactive. The trajectory of this system is highly similar to system 1 as described above. Their total energy only differ by 0.152 due to a slight difference in the initial pBC by 0.25. This implies that the vibration of the reactant H2 is greater, hence the trajectory before the transition state has more fluctuation comparing to system 1. The system have enough energy to cross the transition state, forming HC + HA-HB.
 |
 |
 |
|---|
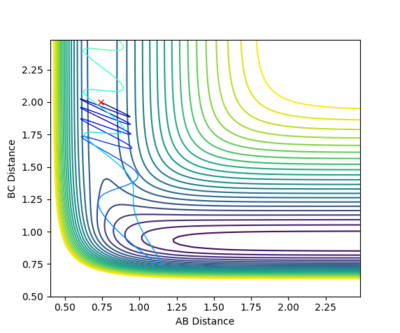
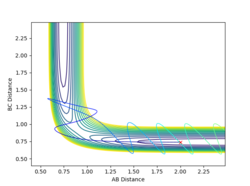
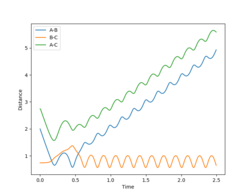
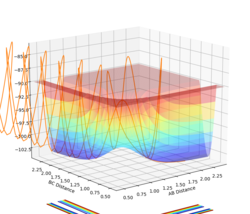
With increased pBC and pAB from the previous system, the vibration has become more vigorous as illustrated in the surface plot.
Although having greater initial kinetic energy, and hence less negative total energy, this system is unreactive. After crossing the transition state, with enough kinetic energy, the system is able to recross the potential barrier again in the direction of the reactant. Then, trajectory follows the valley floor and return back to HA + HB-HC. rBC remains roughly constant at 0.74 after the collision with rAB increases.
 |
 |
 |
|---|
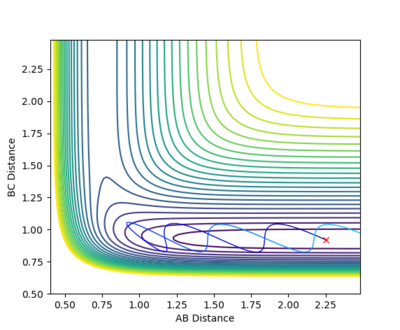
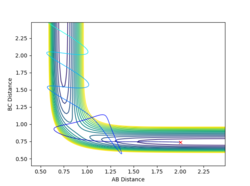
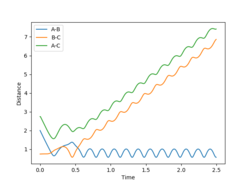
By increasing the magnitude of the pAB of system 4 slightly to -5.2, the system has become reactive. After a crossing and a recrossing of the potential barrier, the system eventually cross the transition state in the direction of the product. Then, trajectory follows the valley floor to HC + HA-HB. rAB remains constant at roughly 0.74, demonstrating a bond formed between HA and HB. Similar to system 4, the vibration of the system is vigorous, leading to greater fluctuations in the trajectory curve.
Mm10114 (talk) 20:45, 14 May 2018 (BST) Nice discussion and good observations. You could've mention somewhere here or earlier the unit of momentum.
Transition State (TS) Theory
State what are the main assumptions of Transition State Theory. Given the results you have obtained, how will Transition State Theory predictions for reaction rate values compare with experimental values?
The transition state theory allows the allow the rate of a reaction to be approximated based on the transition state, using the classical mechanics.
Assumptions of the transition state theory: [1]
- 1. The electronic and nuclear motion are treated separately.
- 2. The molecules and transition states involved in the reaction are distributed among their states following the Maxwell-Boltzmann distribution.
- 3. Recrossing of transition state for a system is prohibited (the system cannot turn around and reform reactants).
- 4. In the TS, the motion in the direction of the reaction coordination can be considered separately from other motions.
In most cases, the Transition State Theory gives reasonable prediction for the reaction rate. Sometimes, the predictions might deviate from the experimental results. This could be due to tunneling effect, which is not taken into consideration with classical mechanics. This quantum phenomenon become significant with lighter atoms, such as hydrogen. In quantum mechanics, the transition state in not localized. The deviation could also be due to the inaccuracies in the potential energy surface. The TS theory is based on 1D motion. In reality, the collision could be nonlinear. For example, in the case of H + H2 collision, taking accounts of the possible reactive nonlinear collisions, the average approach angle is actually 160 degree.[2] This made the 4th assumption listed above invalid. The actual reaction path way might be higher in energy with a higher effective activation energy. In addition, contradicting the 3rd assumption, recrossing of transition state is actually possible as shown in the pervious section with system 4 and 5. Hence, the experimental yield of products might be less than expected. Based on the above, it is likely that the TS theory production might give an overestimation of the reality. [1]
Mm10114 (talk) 20:45, 14 May 2018 (BST) You show a very good understanding of TST (Transition State Theory can be abbreviated as TST) and you relate the 3rd assumption to the previous examples. Nicely done. You even relate the 4th assumption to the approach angle and explained why that makes it invalid. Very impressive.
EXERCISE 2: F - H - H system
PES inspection
Classify the F + H2 and H + HF reactions according to their energetics (endothermic or exothermic). How does this relate to the bond strength of the chemical species involved?
The setting of the system: Atom A = H, Atom B = H, Atom C = F
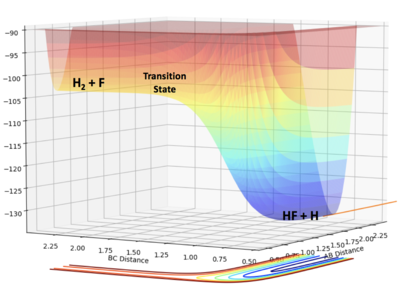
- F + H2 --> H + HF
(Exothermic reaction: the energy of the product is lower than the energy of the reactant. Overall, energy has been released to the surrounding.)
- H + HF --> F + H2
(Endothermic reaction: the energy of the product is higher than the energy of the reactant. Overall, energy has been gained to the surrounding.)
In the H + HF --> F + H2, the energy absorbed for breaking the H-F bond is greater than the energy released in forming the H-H bond. Similarly, in F + H2 --> H + HF, the energy released in forming the HF bond is greater than the energy absorbed for breaking the H-H bond. These imply that the bond strength of H-F bond is greater than H-H bond.
The Approximate Position of the Transition State
Hammond postulate: the transition state will resemble the product in an exothermic reaction and resemble the reactant in an endothermic reaction. In this case, the transition state will resemble "F + H2". They will have similar energy and structure. Hence, the transition state will be closer to F + H2 reactant system.
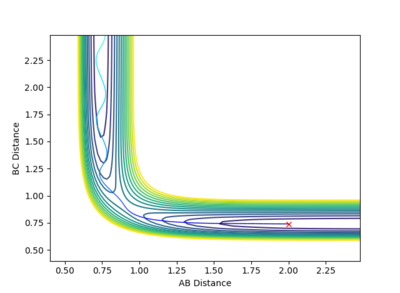
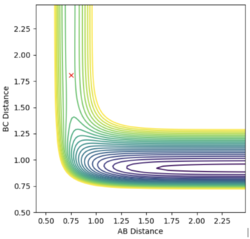
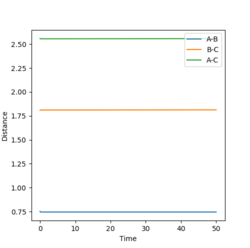
The transition state is located at rAB = 0.752 Å, rBC = 1.808 Å , as shown below in the contour map. With the dynamic calculation method, the initial rAB and rBC are set to rAB = 0.752 Å, rBC = 1.808 Å and the internuclear momentum, pAB and pBC, are set to zero. As shown in the internuclear distance v.s. time plot, rAB and rBC stays constant overtime.
Same result has been obtained with the same condition setting but with mep calculation method as illustrated in the corresponding internuclear distance v.s. time plot (Steps: 10000) below, confirming the above result.
 |
 |
 |
|---|
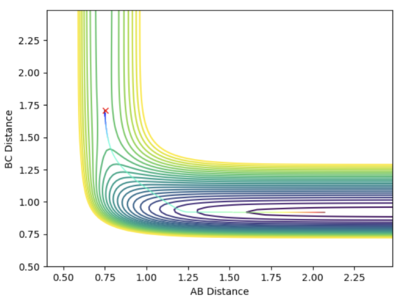
When the initial position is slightly distorted from the transition state (rAB = 0.752 Å, rBC = 1.708 Å and pAB = pBC = 0, Steps:10000), the system follows down the potential hill and forms H and HF as illustrated below in the contour plot. By distorting the initial position from another direction (rAB = 0.752 Å, rBC = 1.908 Å and pAB = pBC = 0, Steps:20000), the system follows down the potential hill in the opposite direction and F + H2 are formed instead. This confirms that the transition state is located at rAB = 0.752 Å and rBC = 1.808 Å as this is the maximum point along the direction of the reaction path.
 |
 |
|---|
Mm10114 (talk) 20:45, 14 May 2018 (BST) Very clear and easy to follow. You've done a very good job here.
The Activation Energy for the Reactions
The potential energy for F + H2: -104.020 kcal/mol (rAB = 0.74 Å, rBC = 4.00 Å) - the potential energy plateaus at roughly -104.020 kcal/mol as the rBC increases (as F atom and H2 molecule dissociates)
The potential energy at the H + HF: -134.022 kcal/mol (rAB = 4.00 Å, rBC = 0.92 Å) - the potential energy plateaus at roughly -134.022 kcal/mol as the rAB increases (as H atom and HF molecule dissociates)
The potential energy at the transition state: -103.732 kcal/mol (rAB = 0.752 Å, rBC = 1.808 Å)
- For F + H2 --> H + HF, the activation energy is (-103.732-(-104.020)=) 0.288 kcal/mol.
- For H + HF --> F + H2, the activation energy is (-103.732-(-134.022)=) 30.29 kcal/mol.
Mm10114 (talk) 20:45, 14 May 2018 (BST) You could've mention how you've obtained these values.
The literature based on computational calculation with LEPS surface has reported that the activation energy for F + H2 reaction is 6.57 kJ/mol (= 1.57 kcal/mol) and the literature equilibrium is at rAB = 0.756Å, rBC = 1.602 Å.[1] The difference between the above result and the literature might be due to the use of different potential surface with different assumption made.
Mm10114 (talk) 20:45, 14 May 2018 (BST) Very good observation.
Reaction dynamics
A reactive system
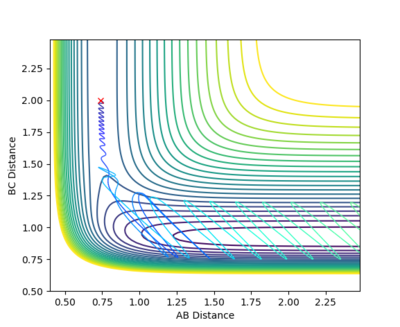
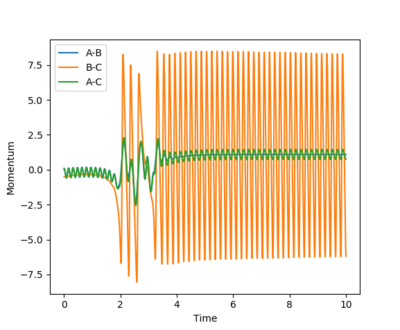
With rAB = 0.74, rBC = 2.0, pAB = 0.1 and pBC = -0.5, the system is reactive for the F + H2 --> H + HF reaction as shown in the contour plot below.
 |
 |
|---|
Looking at the internuclear momentum v.s time graph, the pBC stays roughly constant before the collision. After the collision, the F-H bond has been formed and the transnational energy has been transformed into the vibrational energy between the bond - hence massive oscillation for pBC. pAB has changed from a negative value to a positive value, indicating that the H atom is dissociating from the HF molecule. The initial pAB has been set to 0.1, so the oscillation / vibration of the H-H bond is not strong before the collision.
In light of the fact that energy is conserved, discuss the mechanism of release of the reaction energy. How could this be confirmed experimentally?
The F + H2 reactions is overall endothermic and the energy is released when the F-H bond is formed. The translational energy of F is transferred into the vibration of the new F-H bond, which later dissipated as heat. The temperature of the system would increase. This can be confirmed by performing calorimetry experiment.
Mm10114 (talk) 20:45, 14 May 2018 (BST) That is correct. However, could you have proposed a different experiment related to the formed H-F bond vibration? What would that be?
The Polanyi's Empirical Rules
F + H2 --> H + HF
- The calculation starts on the side of the F + H2 system with rAB = 0.74 Å, rAB = 2.0 Å and pBC = -0.5. Several pAB values are chosen from -3 to 3 and trials are run with the result given in the follow table. Contour plot of some of the trials are also given below for illustration.
| pAB | Reactive? | pAB | Reactive? |
|---|---|---|---|
| -3.0 | No | 3.0 | No |
| -2.9 | No | 2.9 | Yes |
| -2.8 | No | 2.8 | No |
| -2.0 | No | 2.0 | Yes |
| -1.5 | Yes | 1.5 | No |
| -1.0 | No | 1.0 | Yes |
| -0.3 | Yes | 0.3 | Yes |
| -0.2 | Yes | 0.2 | Yes |
| -0.1 | Yes | 0.1 | Yes |
Increasing the momentum pAB increases the vibration between the H-H bond. The result has shown that increasing vibration between H-H bond is less favorable in giving a reactive system. The reaction is more likely to take place when the magnitude of pAB is small and close to zero. In addition, with a positive pAB value (having a a velocity that increases the interatomic distance between the two H), they system tends to be more reactive. This aids to the dissociation of the H-H bond.
In the example below, with the initial r values stays the same, pAB is set to 0.1 and pBC is set to -0.8. The vibration of the H2 molecule is small and the translational energy of F has increased with increased pBC value. These conditions make the reaction favourable and hence the reaction takes place effectively.

H + HF --> F + H2
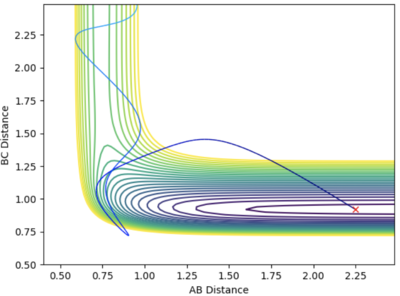
- The initial position are set to be rAB = 2.25 Å and rAB = 0.92 Å, at the bottom of the entry channel. The pAB is set to be arbitrarily high at -10, implying that H atom have tremendous translational energy. pAB is set to be -0.01. This means that the vibration between the H - F bond is minimal. This system is reactive and the recrossing of transition state is observed.
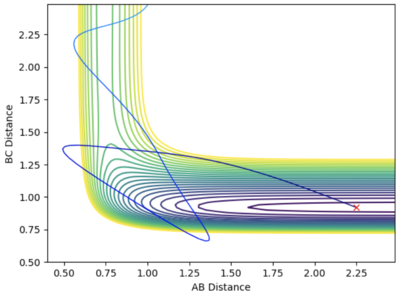
- Such a high translational energy are not required when the vibration between the H-F bond increases. With rAB and rAB stays constant and pBC increase to 7.6, the system is reactive when pAB = -3.5.
Discuss how the distribution of energy between different modes (translation and vibration) affect the efficiency of the reaction, and how this is influenced by the position of the transition state.
The polanyi's empirical rules [3] describe how the distribution of energy between different modes affect the efficiency of the reaction for reaction of an atom with a diatomic molecule, such as the F + H2 and the H + HF reaction system. The results of the above calculations are summarized below. They demonstrate the polanyi's empirical rules and are:
For reaction with an early transition state (such as the F + H2 system), increasing the translational energy of the system is more efficient in promoting the reaction than increasing the vibrational energy. For reaction with a late transition state (such as the H + HF system), additional vibrational energy in the system is more efficient in promoting the reaction than translation energy.
Mm10114 (talk) 20:45, 14 May 2018 (BST) Very well done. (It is always good to finish a report with conclusions section)
Reference
- ↑ 1.0 1.1 1.2 Steinfeld, Jeffrey I., et al. Chemical Kinetics and Dynamics. Prentice Hall, 1999.
- ↑ Levine, Ira N. Physical Chemistry. McGraw Hill Education (India) Private Limited, 2011.
- ↑ Chadwick, Helen, and Rainer D. Beck. “Quantum State Resolved GasâSurface Reaction Dynamics Experiments: a Tutorial Review.” Chemical Society Reviews, vol. 45, no. 13, 2016, pp. 3576–3594., doi:10.1039/c5cs00476d.

