MRD:ccaarrooll
Exercise 1: H + H2 system
Transition States and Critical Points
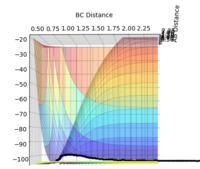
The transition state is defined as the maximum on the minimum energy path linking reactants and the products. It can be found by analysing the potential energy surface plot; with a function containing two variables, the transition state is the saddle point which should satisfy:
i) ∂V(r1)/∂r1 = 0
ii) ∂V(r2)/∂r2 = 0
iii) (∂2[z]/∂[x2]) * (∂2[z]/∂[y2]) - (∂2[z]/∂[x]∂[y])2 < 0, where x and y are the critical points in the plot and z is the derivative of the critical points.
As both the total energy gradient of the transition state and the minimum point have a first derivative of zero (∂V(ri)/∂ri = 0), a second derivative found by performing (iii) will distinguish the transition state if < 0. If the second derivative > 0, then it is a local minima. (Figure 1)
Approximate estimation of the Transition State position


At the transition state, the gradient of the potential energy surface plot is zero, therefore making the force acting upon the hydrogen molecule zero. TS is the state corresponding to the highest potential energy along the reaction coordinate, hence it will have minimal/no kinetic energy, rendering it incapable of oscillation. The distances between three atoms (A, B and C) is equal at transition state. The zero momentum for both bond distances is due to zero force acting on the atoms. As observed from the internuclear distances vs time plot on the right (Figure 2), the distance between AB, BC and AC only remains constant the first 9 seconds - indicating minimal/no kinetic energy is possessed by the atoms - as the molecule is in the transition state. After 6 seconds, the molecule is no longer in the transition state as it begins oscillating.
Bond distance and momentum at which transition state is found to have occurred:
i) AB distance = BC distance = 0.9075 Å
ii) AB momentum = BC momentum = 0 kg⋅m/s
MEP Trajectory vs Dynamic Trajectory
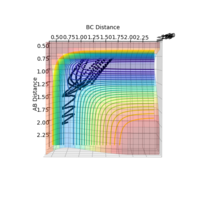
The reaction path taken is almost always the minimum energy path (MEP) - which is the path via the lowest energy transition state. This can be visualised by following the downhill gradient in the forward and backward direction of the transition state that we have located. This was done by running the reaction for a dynamic (Figure 4) and a minimum energy path (mep) (Figure 5); setting the initial conditions with the system slightly displaced from the transition state and zero initial momenta:
AB distance = 0.9085 Å (rts+0.01)
BC distance = 0.9075 Å
AB momentum = BC momentum = 0 kg⋅m/s
The data obtained from the two reaction paths are illustrated below.
The Surface Plot
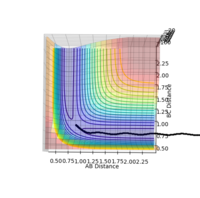
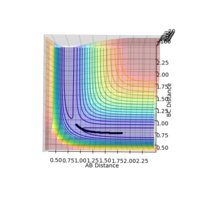
The reaction path is illustrated by the black line on the surface plots. The reaction starts at the transition state (gradient = 0) in both the dynamic and MEP plots. However, in the dynamic plot, the reaction goes into completion as it extends through the x-axis; AB bond length is short as the BC bond length continues to increase. Whereas in the MEP plot, the black line is seen to come to a halt after progressing toward formation of the product. Apart from that, the slightly oscillating black line observed in the dynamic plot indicates that the diatomic molecule possesses vibrational energy - this vibrational motion coincides with an inertial trajectory. In the MEP plot, the black line remains constant; indicating that the diatomic molecule is not vibrating.
Internuclear Distance vs Time
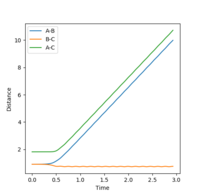

In the dynamic plot (Figure 6), the internuclear distance for AB, BC and thus AC remained constant for about 0.4 seconds before the BC internuclear distance decreased slightly - indicating formation of BC product. The oscillating line shows that the product molecule is vibrating. At the same time, AB and AC internuclear distance increased at the same rate exponentially. The extent to which nucleus AB and AC are apart is not shown but is assumed to be a large number (in Å).
In the minimum energy path (MEP) plot shown in figure 7, as with the dynamic plot, the internuclear distance for AB, BC and thus AC remained constant approximately 2 seconds before BC internuclear distance began to decrease - indicating formation of BC product. Unlike the dynamic plot, the straight line in the plot shows that the bond between BC is static. At the same time, AB and AC internuclear distance increased at the same rate; forming a positive curve that possibly plateaus with time.


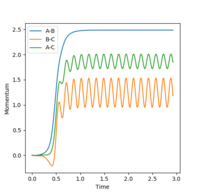
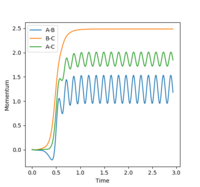
When the initial conditions were changed to r1 = rts and r2 = rts+0.01 instead, it is observed that the product formed is AB instead of BC - as shown in the internuclear distance vs time plot (plots 8 and 9), the blue line that remains relatively constant after 0.5 seconds is indicative of the formation of A-B bond. In the internuclear momenta vs time graphs (Figures 10 and 11), in figure 10, the A-B bond increases exponentially after approximately 0.5 seconds and plateaus at approximately 1.0 seconds; when r1 and r2 values were switched, the B-C bond does the same.
Reactive and Unreactive Trajectories
We can analyse the surface potential plots to determine between reactive and unreactive trajectories; as the reaction path (black line) can be seen to move from the reactant channel to the product channel. We are testing the hypothesis that states that all trajectories starting with the same positions but with higher values of momenta (higher kinetic energy) would be reactive, as they have enough kinetic energy to overcome the activation barrier. Using the system setting r1 = 0.74, r2 = 2.0 and a variation of p1 and p2 values as tabulated in the table below, this hypothesis is tested.
Jas213 (talk) 21:47, 28 May 2018 (BST) Units for distances and momenta are missing. The total energies have been forgotten completely.
As observed from the tabulated data above, the hypothesis is not always true.
Transition State Theory
According to transition state theory, between the state in which molecules exist as reactants and the state in which they exist as products, there is an intermediate state known as the transition state. The species that forms during the transition state is a higher-energy species known as the activated complex. TST postulates three major factors that determine whether or not a reaction will occur.
When applying transition state theory to potential energy surfaces, the main assumptions are: [1]
1. Quantum-tunneling effects are assumed negligible and the Born-Oppenheimer approximation is invoked.
2. The atoms in the reactant state have energies that are Boltzmann distributed.
3. Once the system attains the transition state, with a velocity towards the product configuration, it will not reenter the initial state region again.
These assumptions do not always apply. The third assumption would mean that any reactants that enter the transition state will definitely be reactive and form product. However, as shown in some of the examples above, the theory is inconsistent. As the reactants are in equilibrium with the transition state, if the system has insufficient energy to cross the activation barrier, the product will not form; instead it recrosses the activation energy barrier to reform the reactants.
Transition state theory also ignores any quantum-tunneling effects; thus predicts that particles that do not have enough energy to classically surmount a barrier will not be able to reach the other side. However, some small molecules may be able to tunnel through the activation barrier, forming products, even if the system has insufficient energy to overcome the activation barrier as a whole.
Overall, the transition state theory will predict a higher reaction rate compared to experimental values.
Jas213 (talk) 21:50, 28 May 2018 (BST) Correct, good that you cited your references.
Exercise 2: F - H - H system
PES Inspection
Classification of the F + H2 and H + HF reactions according to their Energetics
The reaction of F + H2 is exothermic as the products (H + HF) are more stable, hence lower in energy, compared to the reactants. This is due to the great difference in electronegativity of hydrogen and fluorine, resulting in the favourable formation of the more stable H-F bond (compared to the H-H bond). Hence, since the enthalpy of formation of the H-F bond (-570 kJ/mol) [3] is more negative than the positive enthalpy of dissociation of the H-H bond (+436 kJ/mol) [3], the reaction is exothermic.
The reaction of H + HF is endothermic as the products (F + H2) are higher in energy compared to the reactants. Since the enthalpy of formation of the H-H bond is less negative than the positive enthalpy of dissociation of H-F bond, the reaction is endothermic. This is due to the weaker H-H bond compared to the H-F bond, as mentioned above, is mainly a result of the great difference in electronegativity between H and F atoms; forming a strong covalent, polar bond in which there is a separation of opposite charges between one end and the other.
The Position of the Transition State
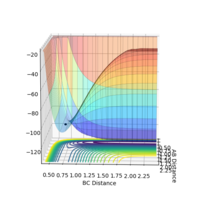
The Hammond postulate is a hypothesis that describes the geometric structure of the transition state; it essentially predicts that in an exothermic reaction, the transition state resembles the reactants as it is closer in energy to the reactants than to the products. In contrast, the transition state in an endothermic reaction will be more geometrically similar to the products than to the reactants. Starting with values close to the H-H and H-F bond length in literature [2] 74 pm and 92 pm respectively, the optimum TS bond lengths were found. The transition state would be the same for both reactions as they both form the same HHF/HFH complex. It was found that the point at which transition state occurs is when F-H bond distance and H-H bond distance is 1.8100003 Å and 0.7465 Å respectively, with the momentum p1 and p2 set to zero.
Activation Energies
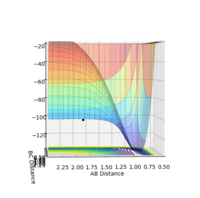
The activation energy is calculated by measuring the difference in energy between the reactant state and the transition state. The energy of the transition state was found to be -103.869 kJ/mol; this was done by inputting the transition state FH and HH bond lengths into the system to plot the energy vs time graph. The energies of the reactants F + H2 and HF + H were approximated on the surface plot graph to be -103.068 kJ/mol and -134.226 kJ/mol respectively. Therefore, the activation energies are calculated to be approximately:
i) EA(F + H2) = -103.869 - (-103.068) = -0.801 kJ/mol (<0 exothermic)
ii) EA(HF + H) = -103.869 - (-134.226) = +30.357 kJ/mol (>0 endothermic)
Jas213 (talk) 21:54, 28 May 2018 (BST) This approach is correct and could serve as a nice double check. However, you were asked to use the MEP trajectories to read off the energies from zooming into the E vs. time plot.
Reaction Dynamics
Reactive trajectory system found to be:
F-H distance = 2.4
H-H distance = 0.88
F-H momentum = -10.0
H-H momentum = -1.5


The law of conservation of energy states that the total energy of an isolated system remains constant; this means that energy can neither be created nor destroyed; rather, it can only be transformed from one form to another. Analysing figure 21, we can conclude that the law is upheld. The average potential energy is seen to decrease after 0.4 seconds, whereas the average kinetic energy increases. This reflects the conversion of potential energy to kinetic energy.
Analysng the internuclear momenta vs time plot (fig 22), it is observed that the degree of oscillation of the HH bond (to be dissociated) is much smaller than the HF bond (to be formed after 0.4 s). This is because in an exothermic reaction, there is a release of energy from the system to surrounding which is reflected by an increase in oscillation, and thus vibration, of the product.
This can be confirmed experimentally by spectroscopy methods such as infrared spectroscopy. The wavelength of the peaks on the IR spectra can be related to energy by the formula E=hv, which can then determine the amount of vibrational energy produced or lost by the reactants and products.
Discuss how the distribution of energy between different modes (translation and vibration) affect the efficiency of the reaction, and how this is influenced by the position of the transition state.
The efficiency of the reaction relates to the fact that a certain ratio of translational to vibrational energy is more likely to produce a reactive trajectory. The Polanyi rules state that the vibrational energy is more efficient in promoting a late-barrier reaction than translational energy; and that translational energy is more efficent in promoting an early-barrier reaction than vibrational energy. [4] This hypothesis is tested.
In the exothermic F+H2 reaction, which according to Hammonds Postulate has an early TS, Polanyi's rules would mean that a higher translational energy (p2) to vibrational energy (p1) would make the reaction more likely to be successful. In figure 23, the system is set up for p1= -1.5 and p2= -10, forming a system with a high translational energy to vibrational energy ratio; which is favourable in an exothermic reaction. In figure 24, the system is set up for p1=-6 and p2=1.5, forming a system with a high vibrational energy to translational energy; this reaction was unsuccessful. This system obeys Polanyi's rules.


In the endothermic H+HF reaction, which according to Hammonds Postulate has a late TS, Polanyi's rules would mean that a higher vibrational energy (p1) to translational energy would result in a successful reaction. In figure 25, the system is set up for p1=-3.9 and p2=-2.2; which is a higher vibrational to translational ratio; the reaction resulted in a successful reaction trajectory. In figure 26, the system is set up for p1=-1.50 and p2=-3.0; which is a lower vibrational to translational energy ratio. The reaction was unsuccessful. This system obeys Polanyi's rules.

However, certain reactions have been found to not conform to Polanyi's rules, such as the late-high-barrier Cl + CHD3 reaction. [5]
References
[1] Heterogeneous Catalysts. T. Bligaard, J.K. Nørskov, in Chemical Bonding at Surfaces and Interfaces, 2008
[2] Online: http://www.science.uwaterloo.ca/~cchieh/cact/c120/bondel.html - accessed on 18 May 2018
[3] Richard Myers,''The Basics of Chemistry'',Greenwood Press, 1951, '''3''',79
[4] J. Phys. Chem. Lett. 3, 23, 3416-3419
[5] Dynamics of the Reaction of Methane with Chlorine Atom on an Accurate Potential Energy Surface. G. Czakó, J. M. Bowman, Science 2011, 334(6054), 343–346.


