MRD:cc3417MolDynamics
H + H2 system
On a potential energy surface diagram, how is the transition state mathematically defined? How can the transition state be identified, and how can it be distinguished from a local minimum of the potential energy surface?
The transition state is defined as the maximum along the minimum energy pathway. This means that the transition state is a saddle point. Saddle points can be found by taking the first partial derivative with respect to both dimensions and finding the point at which it is equal to zero. This is shown in the following equation: . To confirm that this is a saddle point and not simply a minimum or maximum the second partial derivative must be taken. Second partial derivatives are taken along vectors which are defined relative to the saddle point. The first vector (r2) is defined by being a tangent to the saddle point on the minimum energy pathway. The second vector (r1) is orthogonal to vector r2 at the the saddle point on the minimum energy pathway. The signs of the second partial derivatives are opposite so that r2 is negative and r1 is positive: and . The diagram below illustrates this.
something is wrong with your very first equation. Since you present a product, only one of the derivatives would have to be zero to fulfill the equality...Fdp18 (talk) 18:41, 20 May 2019 (BST)
please get in the habit of adding references. For basic mathematical discussions like the above one it is a bit difficult to decide whether you need to give sources, but giving them anyway never hurts.Fdp18 (talk) 18:43, 20 May 2019 (BST)
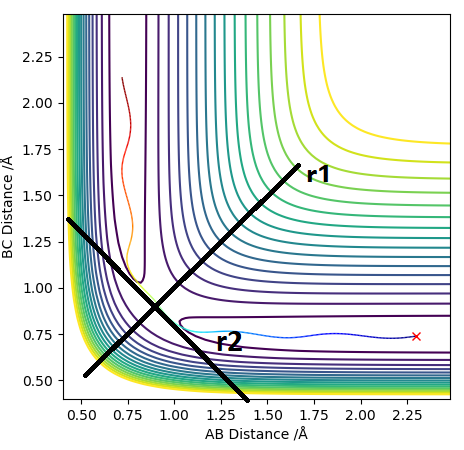
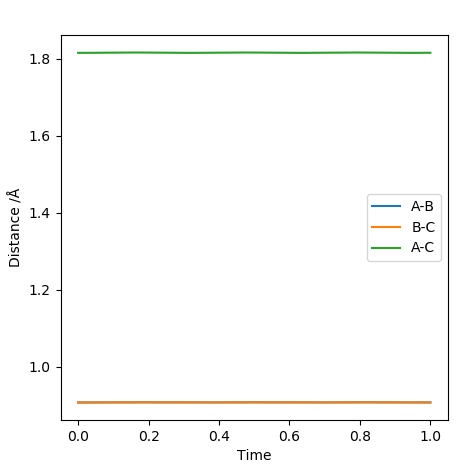
Report your best estimate of the transition state position (rts) and explain your reasoning illustrating it with a “Internuclear Distances vs Time” plot for a relevant trajectory.
As discussed earlier the transition state has a gradient of zero, this means that if the atoms are at the transition state with zero momentum they will not move. This will be shown by two straight lines on an Internuclear Distances vs Time plot, representing the fact that the atoms are not moving. The transiton state can be found by having r1 = r2, both with a momentum of 0. By looking at the contour plot it can be seen that the transition state is located at roughly 0.9 Å for both the AB and BC distance. By modifying the distance variables by trial and error we reach a value of 0.9075 Å which gives the following graph.
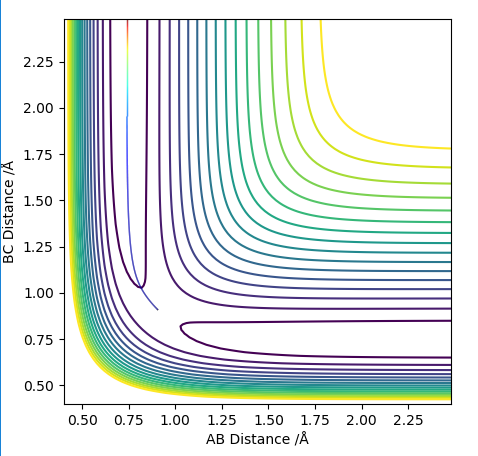
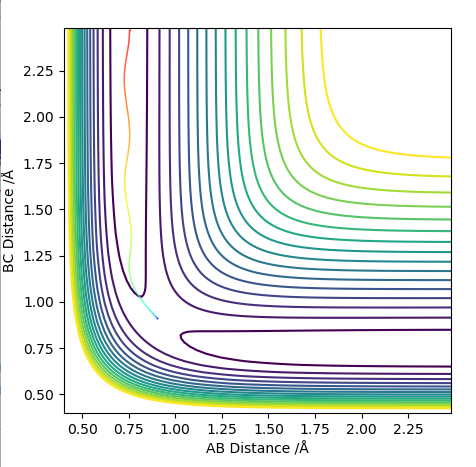
Comment on how the mep and the trajectory you just calculated differ.
When run as MEP the trajectory that is plotted corresponds to infinitely slow motion. This means that at each stage the inertia of the molecules is zero. This is an unrealistic simulation of the movement of the atoms as in reality the atoms have a mass and vibrational energy. This causes the molecules to vibrate and because of the inertia the molecule follows a less direct path which can be seen by the more "wiggly" line. The vibrations change the internuclear distance as the bond stretches which is seen on the graph as the wiggly line.
 |
 |
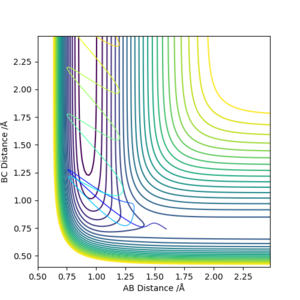
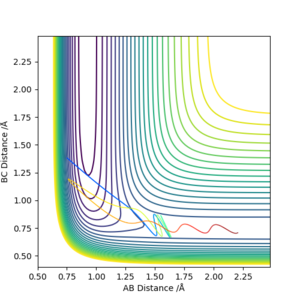
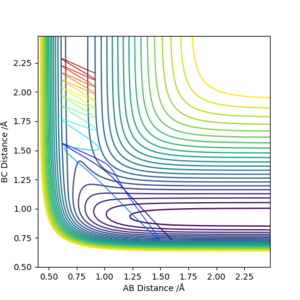
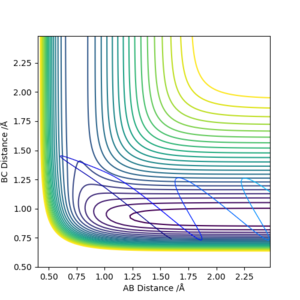
Complete the table above by adding the total energy, whether the trajectory is reactive or unreactive, and provide a plot of the trajectory and a small description for what happens along the trajectory. What can you conclude from the table?
| p1 | p2 | Etot | Reactive? | Illustration of the trajectory | Description of the dynamics |
|---|---|---|---|---|---|
| -1.25 | -2.5 | -99.018 | Reactive | 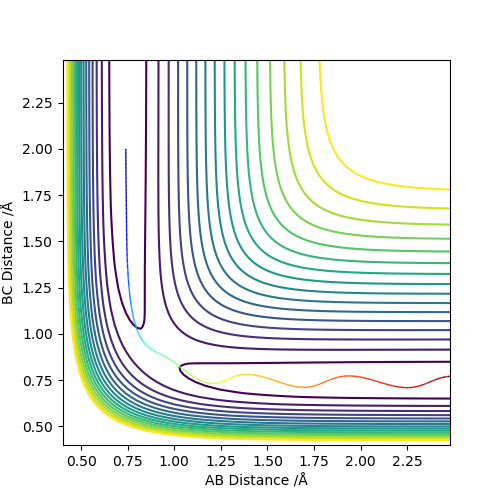 |
The atom C has collided with the molecule A-B with sufficient energy to overcome the activation barrier and pass through the transition state. This leads to B-C forming. The molecule oscillates which can be seen by the wavy line. |
| -1.5 | -2.0 | -100.456 | Unreactive | 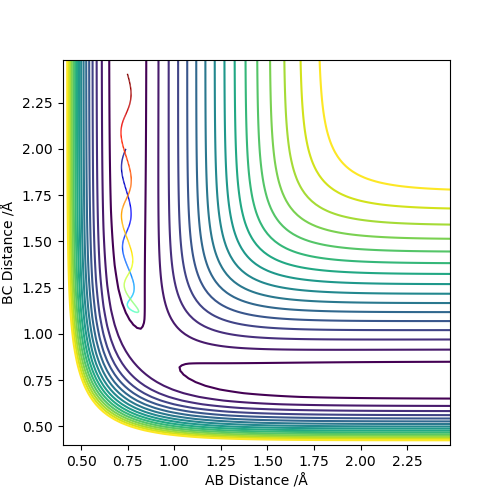 |
The atoms collide but with insufficient energy to react. This merely results a collision and the molecule rebounding and returning along its original path. |
| -1.5 | -2.5 | -98.956 | Reactive |  |
The atoms collide and react in a similar way to the first situation but due to the higher momentum's of the atoms the oscillations are much larger. |
| -2.5 | -5.0 | -84.956 | Unreactive | 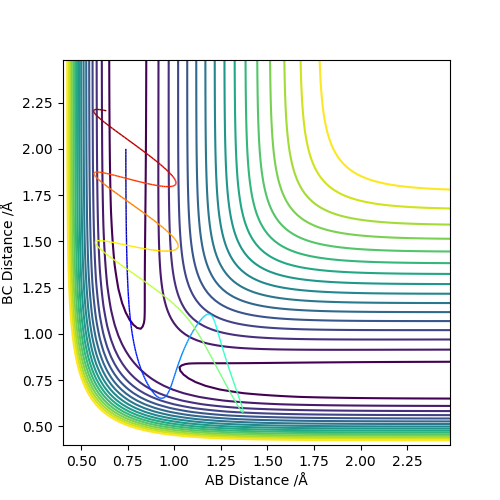 |
The reactants collide and appear to pass close to the transition state. It is unclear if the reaction occurs at this point. What can be said for certain is that the atoms return to close to their original position indicating that a reaction did not occur overall. The reaction indeed did not occur - try to imagine the positions of the hydrogen atoms.Fdp18 (talk) 18:47, 20 May 2019 (BST) |
| -2.5 | -5.2 | -83.416 | Reactive | 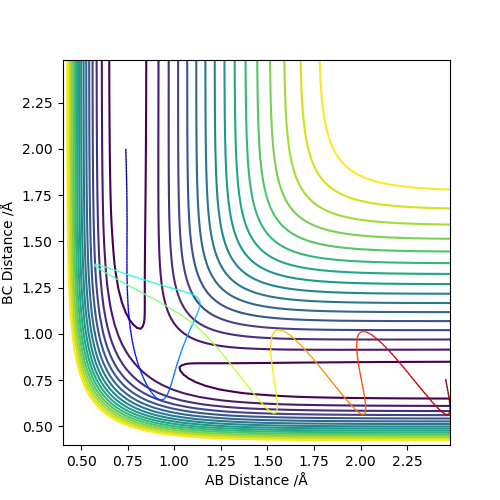 |
There is a large amount of vibrational energy present meaning that a barrier recrossing is possible. However in this case the molecules do not recross the barrier and the reaction goes to completion. This can be seen the change in distances between the two set of atoms indicating that BC have bonded and the AB bond has been broken. |
The table shows that even if the molecules have enough energy to react they may have too much energy and recross the barrier with the net result being no reaction. In addition to this it can be seen that without enough energy a reaction will not occur as the molecules cannot pass the transition barrier.
State what are the main assumptions of Transition State Theory. Given the results you have obtained, how will Transition State Theory predictions for reaction rate values compare with experimental values?
The main assumptions of Transition State Theory (TST) are as follows:
- The Born-Oppenheimer approximation is in effect meaning that the electronic and nuclear motions are separate. What does 'separate' mean here? think about the timescales of movements... Fdp18 (talk) 18:50, 20 May 2019 (BST)
- Molecular systems that have crossed the transition state cannot return over the activation barrier.
- The energies of the molecules and atoms are distributed along a Boltzmann curve.
- At the transition state any motion along the reaction coordinate can be treated separately from all other motion.
- TST allows assumes that the molecules are in a quasi-equilibrium meaning that the activated products are treated as if they are in equilibrium with the reactants. better 'activated complex' or 'transition state' than activated products, since the latter could also mean your actual products in an activated state (vibrational, for example.).Fdp18 (talk) 18:52, 20 May 2019 (BST)
As a result of these assumptions the predicted rate and the experimental rate may not be the same. The rate constants would not be the same if barrier recrossing occurred during the reaction which is possible in real systems. If recrossing did happen then the experimental rate would be lower than the predicted rate.
Further to this TST ignores quantum effects. Tunnelling can result in a lower activation energy. This would increase the rate of reaction and as such the experimental rate would be greater than the predicted rate. However the effect of back crossing is likely much larger especially with atoms that have higher energy levels as these are less conducive to tunnelling.
While for the mathematical part the references might be considered optional, this is not the case for TST. Please provide proper references.Fdp18 (talk) 18:54, 20 May 2019 (BST)
F - H - H system
By inspecting the potential energy surfaces, classify the F + H2 and H + HF reactions according to their energetics (endothermic or exothermic). How does this relate to the bond strength of the chemical species involved?
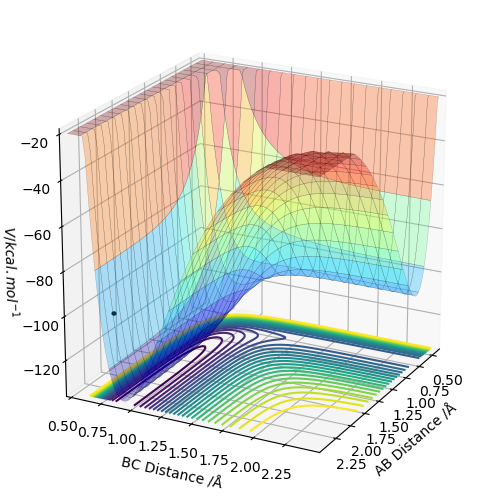
On the right hand side the F + H2 system is shown and it can be seen that it is exothermic because the energy of the system ends up at a lower value post transition state indicating that the system has released energy to the surroundings The surroundings are not considered here to the best of my knowledge. Think of where the energy could go then - what part of it is shown in the surface plot?Fdp18 (talk) 18:55, 20 May 2019 (BST) . On the left hand side the H + HF system is shown and it can be seen that it is endothermic because the system ends up at a higher energy post transition state indicating that the system has absorbed energy from the surroundings which raises the energy of the system. see previous comment.Fdp18 (talk) 18:56, 20 May 2019 (BST)
 |
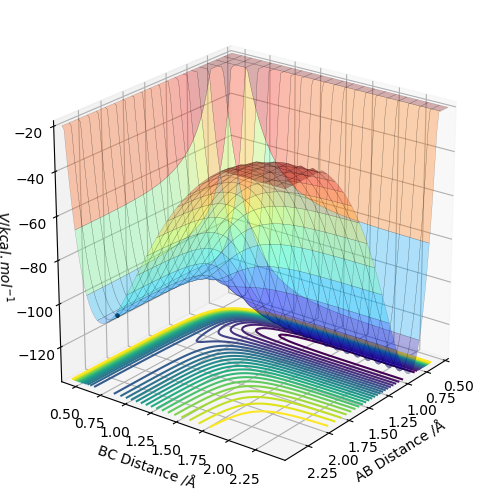 |
A H-F bond has a dissociation energy of 565 kJ/mol, while a H-H bond only has a dissociation energy of 432 kJ/mol which is a much weaker bond. This is supported by the data as when breaking a weaker bond to form a stronger bond energy is released as heat making it exothermic. Conversely forming breaking a stronger energy to from a weaker bond requires energy making it endothermic. The last sentence is a bit difficult to understand.Fdp18 (talk) 18:58, 20 May 2019 (BST)
Where do you have these values from?Fdp18 (talk) 18:56, 20 May 2019 (BST)
Locate the approximate position of the transition state.
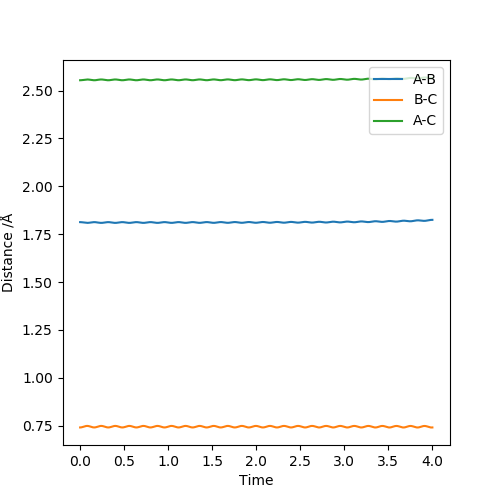
The transition state can be found by setting the momentum to zero for both AB and BC and then finding the point at which there is very little to no movement of the atoms over time which can be seen in the image on the left. The same data is plotted on a surface plot on the right. The black dot is where the transition state is located and shows no deviation from this point even with 2000 steps.
 |
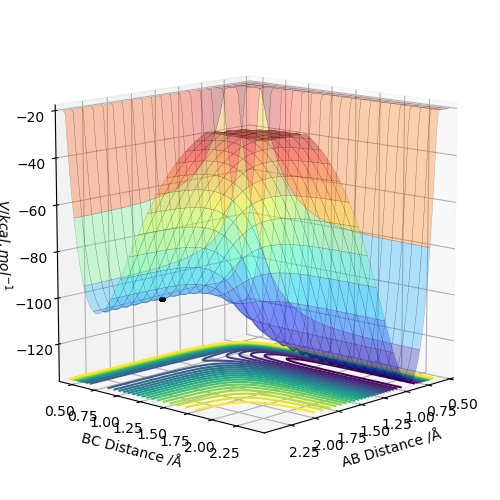 |
The location of the transition state was found by first looking at the contour plot and by estimating where the gradient was zero as shown by an area of no lines. Then by trial and error the location was refined to a value of AB distance = 1.8130 Å and BC distance = 0.7409 Å.
Report the activation energy for both reactions.
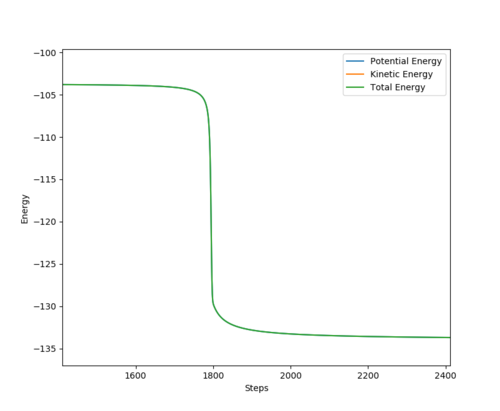 |
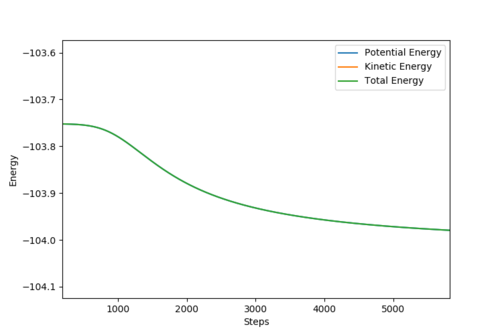 |
The activation energy of the F + H2 reaction is roughly 0.24 kcal/mol. The activation energy of the H + HF reaction is 30.03 kcal/mol.
In light of the fact that energy is conserved, discuss the mechanism of release of the reaction energy. Explain how this could be confirmed experimentally.

The energy that is released from the forming the H-F bond is converted into vibrational energy in the new bond. This can be seen by the large spikes in energy on the orange line. This corresponds to the bond being stretched and compressed, similar to a spring. Vibrational energy on a molecular level is expressed as heat as the energy dissipates to the surroundings.
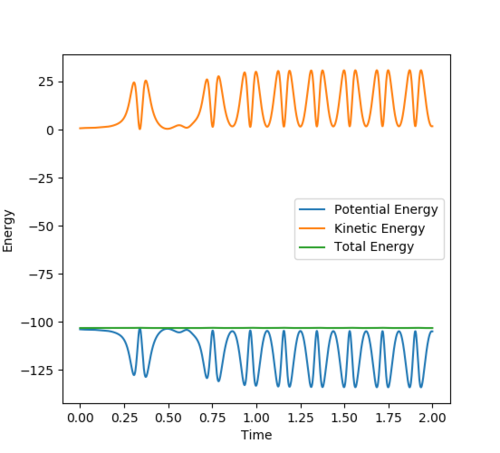
The above graph shows that energy is conserved as the green line is flat. The orange and blue lines are mirror images of each other indicating that kinetic and potential energy are exchanged.
IR spectroscopy can be used as this measures the vibrations in bonds. If an IR is taken during the reaction the change in vibrations can be measured. This would confirm the conversion of chemical to vibrational energy.In addition to this calorimetry could be used to measure the the amount of heat that was released.
Discuss how the distribution of energy between different modes (translation and vibration) affect the efficiency of the reaction, and how this is influenced by the position of the transition state.
Early transition state
The reaction between F and H2 has an early transition state and thus is favoured by high translational and low vibrational energy. This is Polanyi's empirical rule. The graphs above show this rule to be true as when run with high translational and low vibrational energy the reaction goes to completion. However when run with low translational and high vibrational energy the transition state is not crossed and barrier recrossing occurs.
Late transition state
The reaction between H and HF has a late transition state and thus is favoured by low translational and high vibrational energy. This is Polanyi's empirical rule. The graphs above show this rule to be true as when run with low translational and high vibrational energy the reaction goes to completion. However when run with high translational and low vibrational energy the transition state is not crossed and barrier recrossing occurs. The choices of the starting points could be a bit further from the TS. Apart from that, nice illustration of the concept.Fdp18 (talk) 19:06, 20 May 2019 (BST)

