MRD:cb5418
4/5 - A good report overall, with only one or two minor errors. Well done.
Molecular Reaction Dynamics: Applications to Triatomic systems
EXERCISE 1: H + H2 system
Question 1
On a potential energy surface diagram, how is the transition state mathematically defined? How can the transition state be identified, and how can it be distinguished from a local minimum of the potential energy surface?
 |
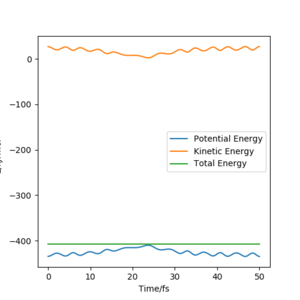 |
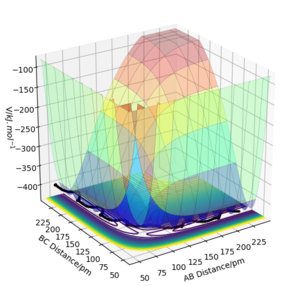
The transition state is mathematically defined on the potential energy surface plot as the point where the first partial derivative of the potential with respect to the internuclear distance r1 (distance A-B) and r2 (distance B-C) energy is equal to 0, shown mathematically as, (dV(ri)/dri)=0. In other words, it is the maximum on the minimum energy path of a reactant-product pathway. The transition state is a saddle point where it is either a local maxima or a local minima, this is shown mathematically via the second partial derivative where the value is either positive or negative [1].
It is identified through the 'rolling ball' analogy. The 'rolling ball' analogy portrays a 'ball' moving by applying momentum from an area near or at the transition state on the potential energy surface plot towards either the products or reactants, the two local minima. By applying the opposite momentum, the 'ball' will roll towards the other local minimum.
Good response. What direction are the 1st/2nd partial derivatives taken along?
Question 2
Report your best estimate of the transition state position (rts) and explain your reasoning illustrating it with a “Internuclear Distances vs Time” plot for a relevant trajectory.
 |
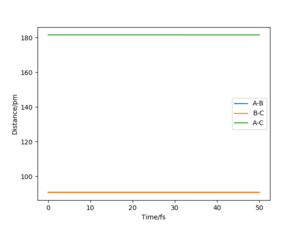 |
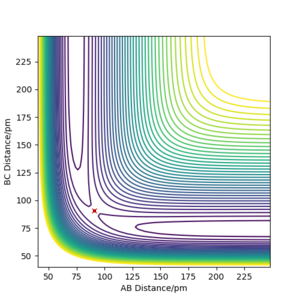
The transition state position (rts) is estimated to be 90.78 pm. The contour plot shows the position of rts for the symmetric H + H2 system. Due to the symmetry of the H + H2 system, the transition state condition is r1=r2. If for instance, the trajectory is started on the ridge at r1=r2 then the gradient is equal to 0 in right angled directions with respect to the ridge. This means that the trajectory will oscillate solely on the ridge and will not fall off.
The internuclear distance vs. time plot at rts=90.78 shows no fluctuations in the distance of A-C and B-C. This confirms that the system undergoes a periodic symmetric vibration.
Sensible estimate, well done.
Question 3
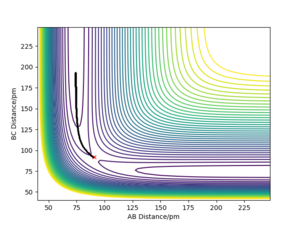
Comment on how the mep and the trajectory you just calculated differ.
 |
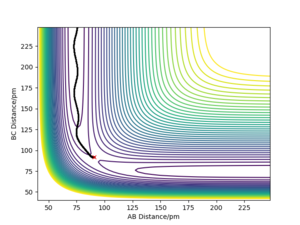 |
The trajectories for r1 = rts+δ, r2 = rts where δ=1 pm and rts=90.78 pm are shown on the two contour plots. The minimum energy path (mep) does not show a realistic representation of the reaction path, since gaseous atoms have mass so their motion will be inertial. As a result, little to no oscillation is observed via the minimum energy path, whereas some oscillation is observed via the reaction path calculated by dynamics. The reaction path calculated by dynamics is a better representation of the motion of atoms and its pathway.
Correct - the MEP is inaccurate as far as realism goes. However, it does have uses. Try to think of what they would be.
Question 4
Complete the table above by adding the total energy, whether the trajectory is reactive or unreactive, and provide a plot of the trajectory and a small description for what happens along the trajectory. What can you conclude from the table?
The table shows five different trajectories with different values of momenta (p1 and p2) for the parameters r1=75 pm and r2=200 pm.
| p1 | p2 | Etot | Reactive? | Illustration of the trajectory | Description of the dynamics |
|---|---|---|---|---|---|
| -2.56 | -5.1 | -414.280 | Yes | 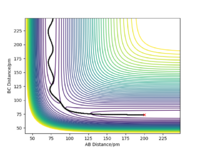 |
The reaction path starts from the diatomic B-C+A and transition towards A-B+C. As seen on the contour plot, the reaction path oscillates slightly as it approaches the transition state. Once the reaction takes place the path becomes much more smooth. This is due to the higher kinetic energy in B-C needed to overcome the activation barrier which means a higher internal vibrational energy. Therefore, greater vibration is observed during the first half of the reaction. |
| -3.1 | -4.1 | -420.007 | No | 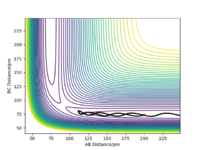 |
This is an example of an unreactive reaction where there is not enough kinetic energy to overcome the activation barrier. The molecule A does not have enough kinetic energy to overcome the transition energy, thus it is unable to approach the diatomic B-C. Instead, the molecule A uses the remaining kinetic energy to bounce back. Similarly, significant oscillation is seen here due to the high internal vibrational energy. |
| -3.1 | -5.1 | -413.977 | Yes |  |
This is very similar to the first scenario where there is enough kinetic energy to overcome the activation barrier. Both the diatomic B-C and the molecule A have enough kinetic energy to approach each other causing the reaction to take place. More oscillation in the reaction path for B-C and this gradually smoothens out as it approaches molecule A forming the diatomic A-B. |
| -5.1 | -10.1 | -357.277 | No | 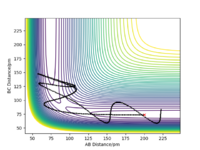 |
In this scenario, a process called barrier recrossing occurs. Initially, molecule A oscillates greatly and overcomes the transitions state. At this point, molecule A reacts with the diatomic B-C and the bond A-B is formed. Despite that, the reaction reverses back to its initial states as the reactants molecule A and diatomic B-C reforms[2]. |
| -5.1 | -10.6 | -349.477 | Yes |  |
The reaction proceeds in this scenario, however there is much greater oscillation due to greater kinetic energy in the system. There is plenty of kinetic energy to overcome the activation barrier for this reaction. The sporadic reaction path is due to very high internal vibrational energy, especially around the area of the transition state. However, once the B-C bond is broken and the A-B bond is formed the reaction path smooths out as energy is used up. |
Conclusively, the hypothesis: "It would seem fair to assume that all trajectories starting with the same positions but with higher values of momenta (higher kinetic energy) would be reactive, as they have enough kinetic energy to overcome the activation barrier.", is partially accepted. This is because there are many different factors which affect the reactiveness of the process and not just solely on the kinetic energy. An example of this is barrier recrossing.
Question 5
Given the results you have obtained, how will Transition State Theory predictions for reaction rate values compare with experimental values?
The Transition State Theory predictions for reaction rate values are not as accurate when compared to the experimental values. The main reason behind this is due to the numerous assumptions made to fit the theory. The theory itself was made to provide a better understanding of the reaction rates of elementary reactions. A pivotal assumption is the estimation of Rcl, the average transmission rate/frequency, where trajectories which have a greater kinetic energy than the activation barrier are reactive. However, this is not always the case as seen with the barrier recrossing effect. Another key assumption is that the kinetic energy is modelled via the Boltzmann distribution along the reaction coordinate. This means that the intermediates are long-lived, but for most experimental cases the intermediates are actually short-lived. Another assumption is that the Transition State Theory is considered classically. Simply saying that the trajectory is described solely by the velocity and not the wavefunction. When compared to the experimental cases this theory ignores the effect of quantum tunnelling, where reactants with not enough kinetic energy to overcome the barrier are able to tunnel through the it instead. It is also mentioned that in Transition State Theory, the pre-exponential factor depends on temperature. However, at high temperatures new transition states are available due to the population of vibrational, rotational and translational energy gaps which contradicts the theory[3]. As mentioned before, all of these assumptions are made to fulfil the theory, but these discrepancies mentioned in the extract will lead different reaction rate values.
A very detailed and entirely correct answer, well done. In these simple, limiting cases though will TS theory overestimate or underestimate the rate?
EXERCISE 2: F - H - H system
PES inspection
Question 1
By inspecting the potential energy surfaces, classify the F+H2 and H+HF reactions according to their energetics (endothermic or exothermic). How does this relate to the bond strength of the chemical species involved?
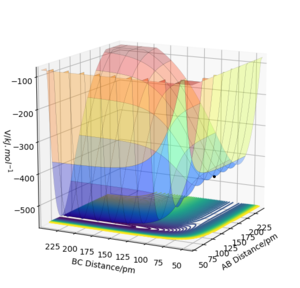 |
As shown on the potential energy surface plot, at lower bond distances the potential energy well of H-F (AB) is deeper in energy when compared to H-H (BC). For this reason, F+H2 is exothermic and H+HF is endothermic. Therefore, the F-H bond is a stronger bond than H-H.
Good!
Question 2
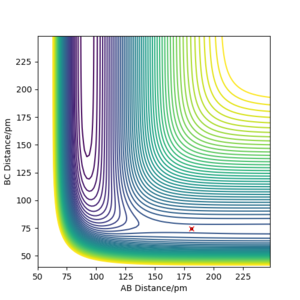
Locate the approximate position of the transition state.
 |
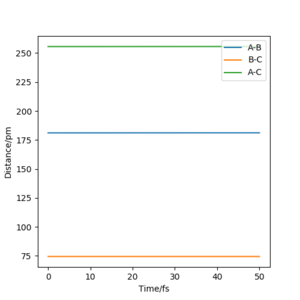 |
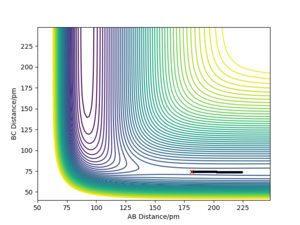
The approximate position of the transition state is determined as follows: F-H (AB)=181.15 pm, H-H (BC)=74.49 pm. This is the position where for both AB and BC, the momenta equate to zero. The position of the transition state in this system was determined using a Hessian matrix. The Hessian matrix proposes one positive eigenvalue which is close to 1 and a negative eigenvalue which is close to 0.
Question 3
Report the activation energy for both reactions.
 |
 |
 |
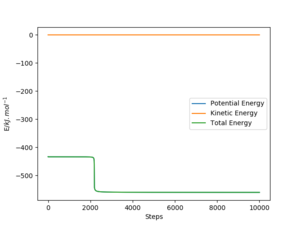 |
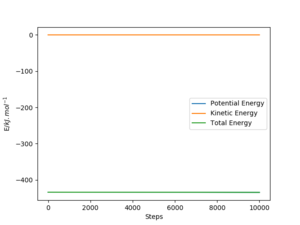
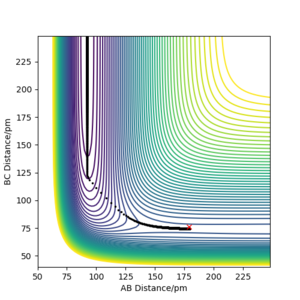
The activation energies for both reactions are calculated by subtracting ETOT of each reaction by the ETOT of the transition state, this is due to the manipulation of Hammond's postulate. These values are stated in the table below.
| Reactants | Endothermic/exothermic | ETOT/(kJ.mol-1) | Activation Energy/(kJ.mol-1) |
|---|---|---|---|
| TS | - | -433.981 | - |
| F-H + H | Endothermic | -560.617 | 126.636 |
| F + H-H | Exothermic | -435.059 | 1.078 |
A sensible set of Ea values, well done!
Reaction dynamics
Question 4
Identify a set of initial conditions that results in a reactive trajectory for the F + H2, and look at the “Animation” and “Momenta vs Time”. In light of the fact that energy is conserved, discuss the mechanism of release of the reaction energy. Explain how this could be confirmed experimentally.
 |
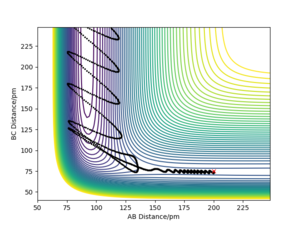 |
The set of initial conditions that results in a reactive trajectory for the F + H2 is as follows: F-H (AB)=200 pm, H-H (BC)=75 pm, pAB= -1.0 g.mol-1, pBC= -1.0 g.mol-1. From the momenta vs. time plot shown, the B-C plot which corresponds to the H-H bond oscillates at a much smaller extent early in the reaction, this is due to the vibrational bond energy. This is modelled quantum mechanically by a simple harmonic oscillator. As the diatomic H-H approaches the fluorine atom, F, the the B-C bond starts to oscillate more irregularly and to a larger extent. Eventually, the H-H bond breaks and instead the H-F bond is formed. This reaction is shown on the plot at the point where the A-B bond oscillates aggressively. The exothermic process leads to a release in energy to the surroundings as heat energy via internal vibrational relaxation. This massive release in heat energy will cause a sharp rise in temperature which could be monitored by a thermometer to confirm experimentally that the reaction is occurring or has occurred.
No, because translational KE will also be detected as heat. Another method has to be used. Can you think of what it is?
Question 5
Discuss how the distribution of energy between different modes (translation and vibration) affect the efficiency of the reaction, and how this is influenced by the position of the transition state.
The Polanyi's empirical rules simply state that vibrational energy is more efficient in the promotion of a late-barrier reaction than translational energy and vice versa for an early-barrier reaction[4]. This is basically saying that the early transition state is favoured by translational energy and the late transition state is favoured by vibrational energy .
Correct definition, well done.
 |
The initial conditions as follows are applied to the contour plot shown: F-H (AB)=85 pm, H-H (BC)=100 pm, pAB= -0.25 g.mol-1, pBC= -5.0 g.mol-1.
An example of a H + HF endothermic reaction is shown on the contour plot. This plot is a good example of Polanyi's empirical rules. The reaction path is for low vibrational but high translational energies. Since this is an endothermic reaction, there is a late transition state. According to Polanyi's empirical rules, vibrational energy is favoured over translational energy for this path, but since vibrational energy is low, the result of the reaction is unsuccessful. The reaction path stopped at a certain point and reversed back to its original state, regardless of the fact that the translational energy is greater than the activation barrier.
 |
This plot doesn't appear to be correct -- it seems that you've included a plot for the F+H2 reaction by accident, or else you started in the products channel.
This contour plot shows the result of the trajectory upon increasing the vibrational energy of the system. The trajectory is now reactive resulting in the formation of its products. This is because the gaseous atom motion aligns more towards the products allowing the reaction to complete successfully as it is now orthogonal to the minimum energy path.
References
- ↑ Moore, J. W., Moss, S. J. & Coady, C. J. Potential-Energy Surfaces and Transition-State Theory. vol. 60 (1983).
- ↑ Komatsuzaki, T. & Nagaoka, M. Study on ‘regularity’ of barrier recrossing motion. J. Chem. Phys. 105, 10838–10848 (1996).
- ↑ Pilling, M. J., and Seakins, Paul W. Reaction Kinetics. Oxford: Oxford UP, 1995. Print.
- ↑ Zhang, Z., Zhou, Y., Zhang, D. H., Czakó, G. & Bowman, J. M. Theoretical study of the validity of the Polanyi rules for the late-barrier Cl + CHD3 reaction. J. Phys. Chem. Lett. 3, 3416–3419 (2012).
