MRD:cat3718MRD
Molecular reaction dynamics
Potential energy surface diagram - The transition state:
The transition state on an energy surface diagram can be mathematically defined by ∂V(ri)/∂ri=0 which is the maximum point on the minimum energy path between the reactants and products. Which differentiates itself form local minima as local minima are the point on the diagram where the gradient=0 as is the transition state, but the transition state is the maximum point on the minimum energy path where the gradient=0.
Ok. Would be good to refer to figures in text here. What does the second derivative tell us about the saddle? Rs6817 (talk) 15:12, 19 May 2020 (BST)
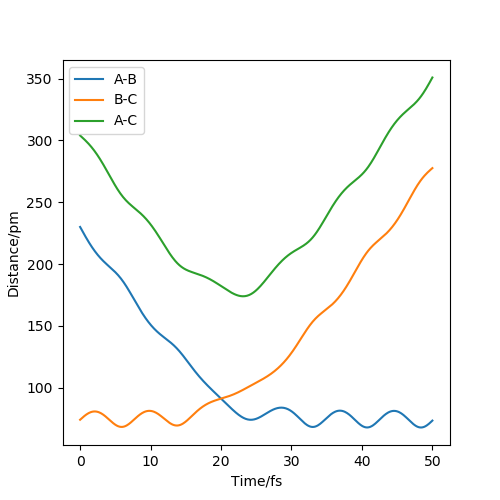
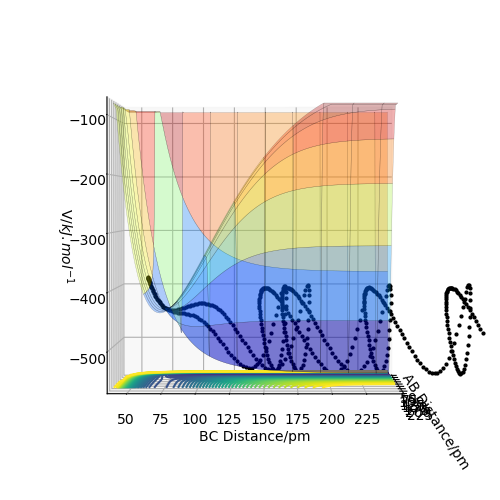
The transition state position rts estimated at 88 pm and can be seen on the distance vs time plot below at 20 fs where AB and BC paths cross. AB then goes into a vibration state whereas BC also has translation energy as shown by the distance increasing after the cross over.
this is quite far from an accurate measurement of the transition bond length as you have approximated from the above graph. Within the programme, what does the force along AB and BC tell us ? We can use these metrics (and the Hessian matrix) to give a best approximate of the state. A saddle point is defined by a flat profile in an internucelar distance vs time plot, the above plot is representative of a reaction trajectory on a surface Rs6817 (talk) 15:12, 19 May 2020 (BST)
Trajectory: Dynamic vs Mep
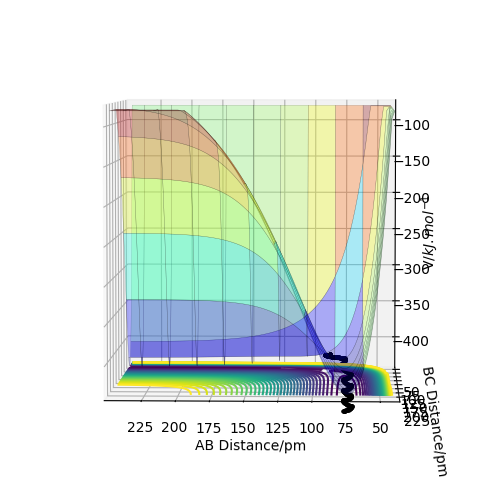
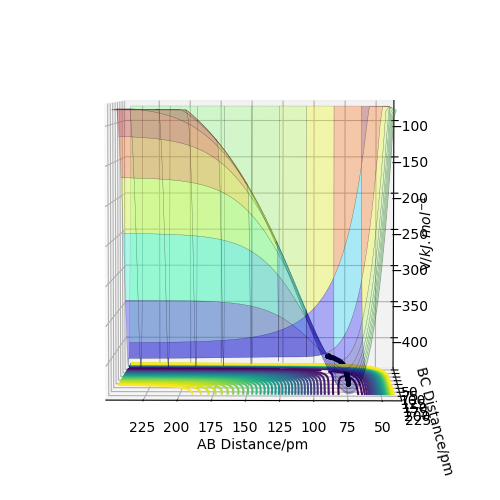
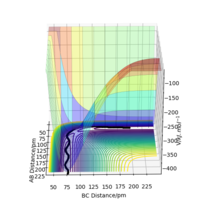
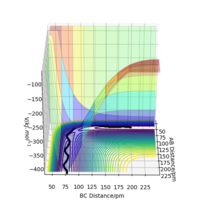
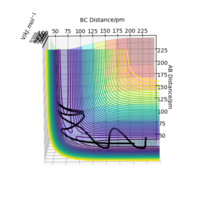
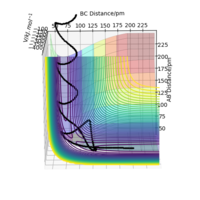
As seen above in the dynamic surface plot above the path ends with vibration energy when compared to the mep calculation on the right there is clearly no vibration in the reaction path. For inter-nuclear distance vs time, r1 oscillates between 70-78 pm whereas once r2 gets to about 100 pm it just increases linearly as C moves away from AB with constant velocity. For momenta vs time once the nuclei have separated for the dynaimc calculation AB oscillates between 1-3.5 g.mol-1.pm.fs-1 and C levels out at 5 g.mol-1.pm.fs-1 for the mep calculation there is no change in momentum so a flat line is observed. As for the distance vs time for the mep calculation AB stays constant at 75 pm, C moves away and starts to plateau. If initial conditions are swapped for final conditons for the calculation above the distance vs time graph is flipped horizontally and the momenta vs time is flipped vertically.
Ok, key difference is lack of oscillation, you could have explored this by starting a trajectory either side of the transition state. Rs6817 (talk) 15:12, 19 May 2020 (BST)
From the table above it can be concluded that p2 has to be high enough to overcome p1 and that there can be recrossing on barrier for transition state. All calcultions above were at r1=74 pm and r2=200 pm on dynamic type of calculation.
Great answer. Rs6817 (talk) 15:12, 19 May 2020 (BST)
Transition state theory vs experimental value:
So transition state theory states that based on the reactants and structure of the transition state that the rate of a reaction can be found. TS theory forbids recrossing of products over the transition state, in the penultimate experiment in the table this recrossing occurs showing experimentally transition state theory is not always followed and can be flawed .
Ok, the question was asking you to state transition theory assumptions, these include considerations of quantum tunneling and quasi equilibria. Good comparing to the table. Rs6817 (talk) 15:12, 19 May 2020 (BST)
F-H-H System:
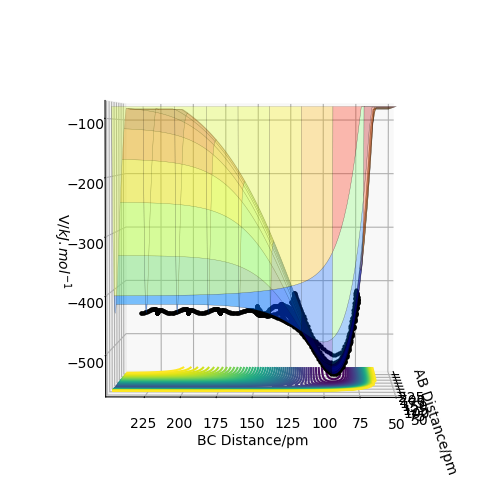
For F + H2 this reaction is exothermic as can be seen in the dip in energy in the surface plot below as the BC distance decreases until it starts to fluctuate between two values when HF is bonded. The reaction path after the reaction takes place shows large oscillations due to the HF vibrations being larger as F is heavier.
For HF + H the reaction is endothermic as can be seen that as the bond length of BC decreases as HB and HC get closer that the energy in the surface diagram below increases so energy comes into the system for the reaction to occur hence endothermic.
The transition state for the reaction occurs at approximately 75pm for distance AB and 145pm for BC for F + H2 and for HF + H is approximately 100 pm for BC and AB. The activation energy is at 436 KJ mol-1 for F + H2 for HF + H the activation energy was 400 KJ mol-1.
Ok, how does Hammonds postulate help here? The reaction energy calculations can be calculated with an MEP plotted with an energy vs time plot (or number of steps) to determine the difference in reactant and product energies. Rs6817 (talk) 15:12, 19 May 2020 (BST)
Reaction dynamics :
The release of reaction energy could be found using conservation of momentum as will be the same before and after any lost can be accounted by a chnage in energy as the mass will stay constant. For reactions varying with F+H2 varying pHH for values >5.6, between -5 to -5.5, 0-1, 1.8, -2.1 all had successful reactions so not dependent on a minimum or maximum value for p(up to 6.1 tested). For 0.2 pHH and -1.6 for pHF no reaction occurred. For the reverse reaction if the HF bond is given 1.9 g.mol-1.pm.fs-1 and the incoming H atom with -4 g.mol-1.pm.fs-1 then the reaction does not occur as the activation energy barrier has not been passed these were the minimum values for p found which gave no reaction.
Ok, a table may have helped present your data here. Rs6817 (talk) 15:12, 19 May 2020 (BST)
The higher the translational energy for the incoming atom the more likely the reaction is to occur if the transition state the highest point on the minimum reaction path is where the reaction takes place so if the vibrational energy is too high there can be too much repulsion for the incoming atom to react with the vibrating molecule. So if the transition state is closer to the reactants then it will resemble the reactants more in this case the vibrating HF molecule and incoming H atom and if closer to the products then the transition state will resemble that. So if closer to reactants depends more on the vibrational modes and if closer to products in a later transition state will depend more on the translational mode.
.
Whilst this is true, perhaps reference to Polanyis rules may have helped you answer this question. Rs6817 (talk) 15:12, 19 May 2020 (BST)

