MRD:cai15
Exercise 1: H + H2 System
Introduction
Initially, a simple linear triatomic reaction consisting of a diatomic molecule (H2) and an atom (H) was studied using Leps Gui.
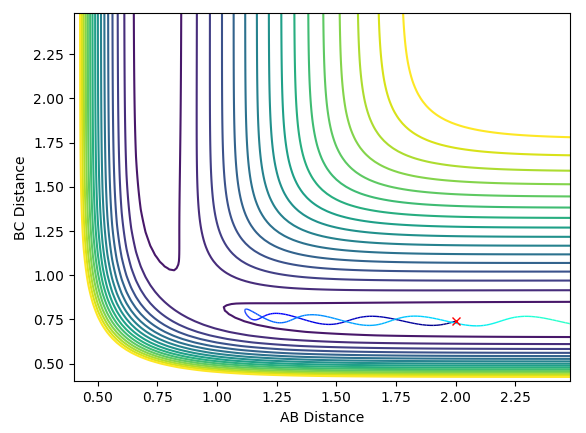
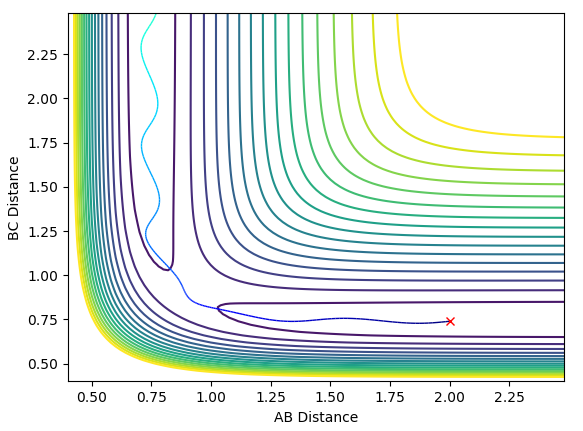
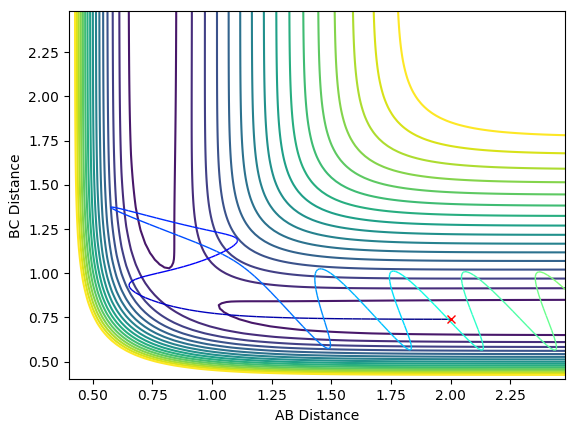
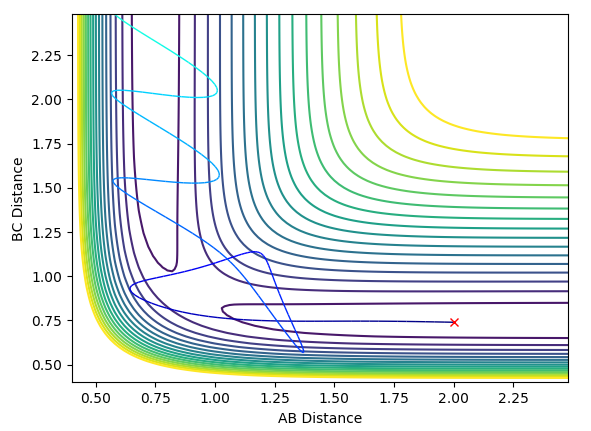
The diagrams below show a range of plots for the reaction:

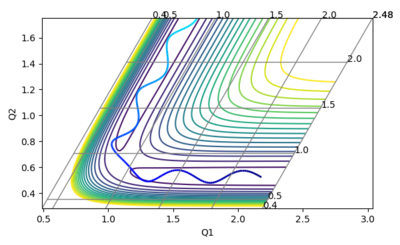
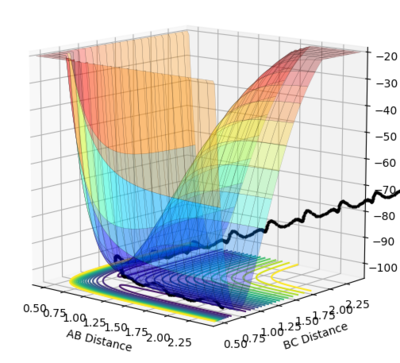


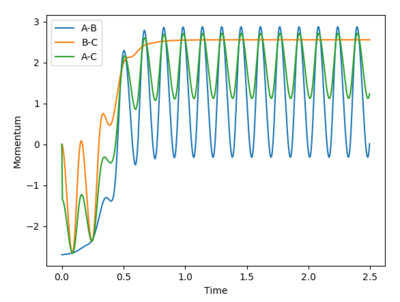
What value do the different components of the gradient of the potential energy surface have at a minimum and at a transition structure? Briefly explain how minima and transition structures can be distinguished using the curvature of the potential energy surface.
At a minimum and at a transition state the gradient of the potential energy graph is zero in both the orthogonal directions. The minimum represents the lowest energy state of the system, i.e. stable species. The transition state represents an energy maximum, where any slight change in geometry will cause the system to move towards either the products or reactants. The two can be distinguished by finding the second derivative of the graph at these points: the transition state is a maximum and thus will have a negative second derivative, the minimum will have a positive second derivative.
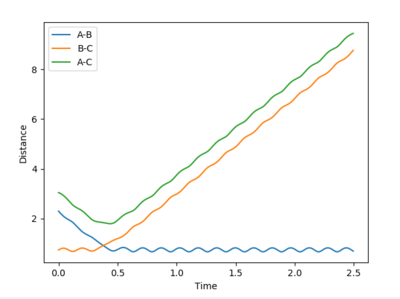
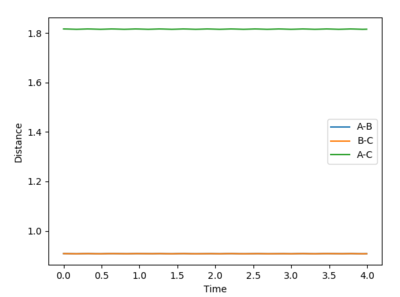
Report your best estimate of the transition state position (rts) and explain your reasoning illustrating it with a “Internuclear Distances vs Time” plot for a relevant trajectory.
Best estimate: 0.9082 Å
The plot of internuclear distance versus time should be a straight line at the transition state, as the transition state corresponds to a maximum on the minimum energy path (i.e. a turning point) and the atoms have no momentum. Initial guesses of 1.0 and 0.9 showed that the ideal distance lay closer to 0.9 than 1.0. A further estimate of 0.91, 0.92 and 0.93 showed that 0.91 provided the straightest line. Further analysis lead to a final estimate of 0.9082 Å. This is slightly greater than the H-H bond length of 0.74 Å, which is expected as one bonding is breaking and the other bond is forming.
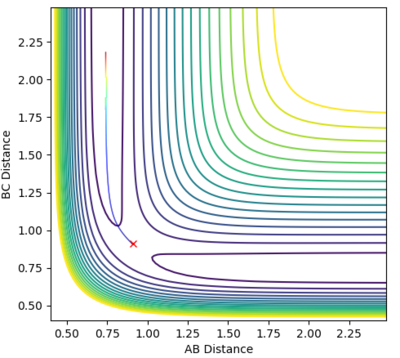
Comment on how the mep and the trajectory you just calculated differ.
The minimum energy path calculates the reaction path by assuming infinitely slow motion, i.e. that the particles have no momentum. The particles move smoothly towards H1+H2-H3 with no deviation from the minimum energy path. Calculation of the reaction path using dynamics accounts for the inertia of the particles as they move from the transition state, providing a more realistic trajectory showing the oscillating motion.
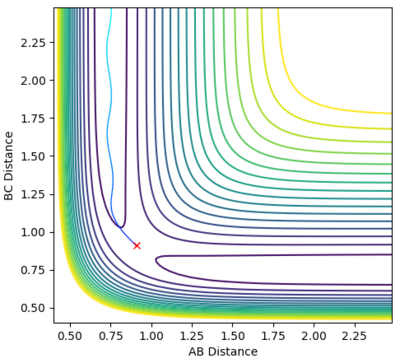
Complete the table by adding a column with the total energy, and another column reporting if the trajectory is reactive or unreactive. For each set of initial conditions, provide a plot of the trajectory and a small description for what happens along the trajectory.
Mm10114 (talk) 22:14, 28 May 2018 (BST) What is the unit of energy here?
State what are the main assumptions of Transition State Theory. Given the results you have obtained, how will Transition State Theory predictions for reaction rate values compare with experimental values?
Transition State Theory has three main assumptions:
1. Atomic nuclei behave according to classical mechanics.
2. Reactants must pass over the lowest energy saddle point on the potential energy surface in order to form the products.
3. There is only important reaction coordinate (i.e. one saddle point).
At mild temperatures, Transition State Theory is likely to be quite accurate. However, the theory predicts that at low temperatures the reactants will never have sufficient energy to react as they won't be able to pass over the saddle point. This fails to account for quantum tunneling, where the reactants can form the products via an alternate lower energy path. At high temperatures, Transition State Theory fails to account for the reactants gaining access to alternate, higher energy transition states (other saddle points) away from the minimum energy path. Transition State Theory therefore breaks down at the extremes, failing to produce accurate predictions.
Mm10114 (talk) 22:18, 28 May 2018 (BST) You've explained well the TST predictions at different temperatures. But, there are other effects you could've described here. For example ad. 1 - what about tunneling? Also, where is the reference to the source of this information?
Exercise 2: F-H-H System
Classify the F + H2 and H + HF reactions according to their energetics (endothermic or exothermic). How does this relate to the bond strength of the chemical species involved?
H-H : 432 kJ mol-1 H-F : 565 kJ mol-1
F+H2 involves the breaking of one H-H bond (+432) and the formation of one H-F bond (-565). The reaction is therefore exothermic (-133 kJ mol-1, as a stronger bond is being formed in the reaction[1].
H+HF involves the breaking of one H-F bond (+565) and the formation of one H-H bond (-432). The reaction is therefore endothermic (+133 kJ mol-1, as a stronger bond is being broken to form a weaker bond in the reaction.
Mm10114 (talk) 22:19, 28 May 2018 (BST) That is correct. You could've support that with the discussion of an appropriate surface plot.
Locate the approximate position of the transition state.
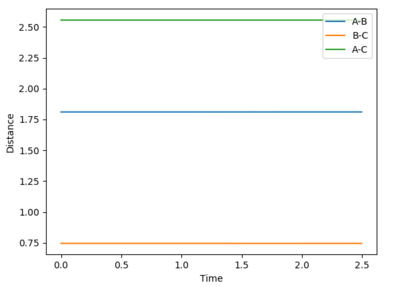
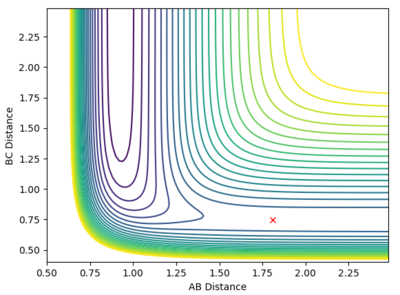
At the transition state, r1 is approximately 0.745 and r2 is approximately 1.8107. Note that due to the greater stability of HF relative to HH, the transition state saddle lies closer to the reactants than the products, and as per Hammond's Postulate, the transition state will therefore resemble the reactants more than the products.
Mm10114 (talk) 22:20, 28 May 2018 (BST) It would be nice to have a short description of the steps you've taken to locate the TS. Also, you provide the plots, but you don't really discuss them.
Report the activation energy for both reactions.
The gain in potential energy between the reactants and the transition state is defined as the activation energy. By slightly displacing the reactants towards the transition state and running an MEP calculation, the activation energy was calculated.
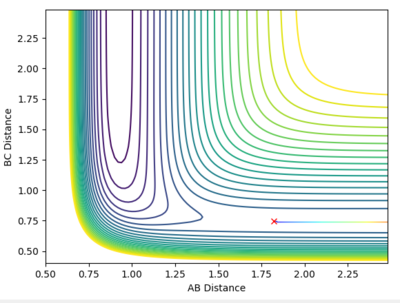
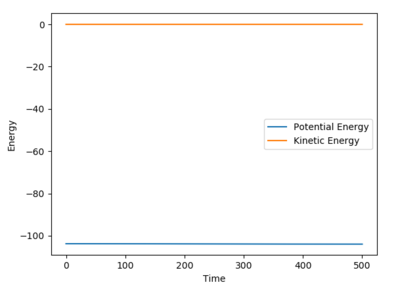
For H2+F, the activation energy was calculated as 0.230 kcal mol-1. The initial potential energy was -103.769 and the final energy was -103.999. This activation energy barrier is very small and almost negligable.
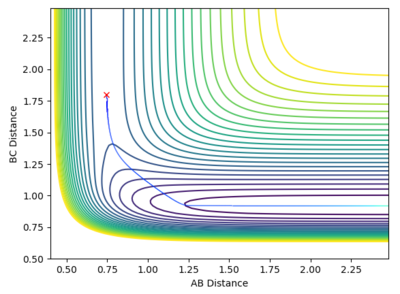
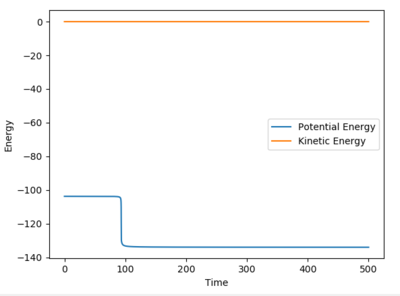
For H+HF, the activation energy was calculated as 29.822 kcal mol-1. The initial potential energy was -103.869 and the final energy was -133.691. This energy barrier is much greater due to the breaking on the strong H-F bond.
In light of the fact that energy is conserved, discuss the mechanism of release of the reaction energy. How could this be confirmed experimentally?
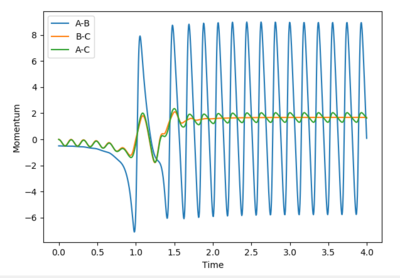
As discussed earlier, H2+F is a considerably exothermic reaction (-133 kJ mol-1) due to the formation of a strong H-F bond. Total energy must be conserved, so the loss in potential energy associated with the formation of the new H-F bond is converted to vibrational energy. This can be seen clearly in the figure above, by the large amplitude oscillations following the formation of HF. The vibrational energy is eventually dissipated as kinetic (thermal) energy, via collisions with other particles and the reaction vessel. An increase in kinetic energy of particles means a higher temperature (temperature is a measure of the average kinetic energy of molecules in a sample). Measurement of temperature change in an insulated vessel would be a method for experimentally determining the energy release.
Mm10114 (talk) 22:21, 28 May 2018 (BST) Nice analysis. What other experiment in relation to the vibrational energy of the H-F bond could've been used?
Discuss how the distribution of energy between different modes (translation and vibration) affect the efficiency of the reaction, and how this is influenced by the position of the transition state.
The Polanyi rules state that late transition state reactions are more efficiently promoted by vibrational energy than translational energy[2].
In the H2+F reaction, the transition state energy lies close to the reactants, and as such it is expected that the F atom only requires a small degree of translational energy, and the H2 molecule a small degree of vibrational energy, to react. This is supported by the small activation energy, as established earlier. This was found to be the case, as shown by the successful trajectory shown below.

In the HF+H reaction, the transition state lies close to the products, due to the strong H-F bond. Polanyi’s rules predict that this reaction will be promoted by higher vibrational energy on the diatomic molecule, as opposed to greater translational energy on the H atom. A successful trajectory for these conditions is shown below.
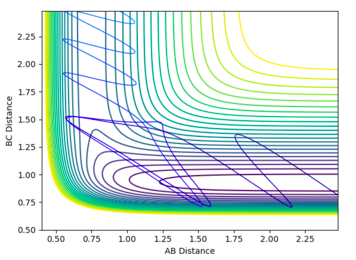
However, Polanyi’s rules are only guidelines, and there are situations where successful trajectories will occur against these rules. For example, it was found that a successful trajectory for H2+F would occur when H2 had a high degree of vibrational energy. If the H-H bond is vibrating with a large amplitude, this increases the chance of the independent H atom remaining far from the HF molecule once it has formed, preventing it from reforming H2.
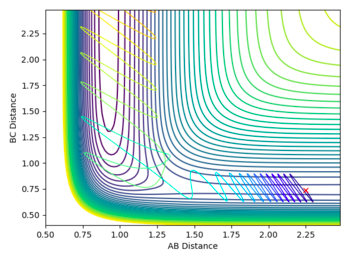
In the HF+F reaction, a successful trajectory can be found for a large momentum of H and small vibrational motion of HF. The H atom has such a large translational energy on impact that it forces apart the strong H-F bond, allowing the reaction to take place. A large vibrational motion and large incoming momentum does not lead to a successful reaction, as the effect of the H atom is dampened when the HF bond already has a high vibrational energy.

Mm10114 (talk) 22:24, 28 May 2018 (BST) This part is excellent. You not only discuss Polanyi's rules, but also instances of when these rules are shown to fail.
[1] Huheey, pps. A-21 to A-34; T.L. Cottrell, "The Strengths of Chemical Bonds," 2nd ed., Butterworths, London, 1958; B. deB
[2] J. Phys. Chem. Lett. 3, 23, 3416-3419


