
MRD:c01190004
Molecular Reaction Dynamics Computational Labs (cn816)
Exercise 1: H+ H2 system
In the first exercise, we look at the reactivity of triatomic systems, where an atom and a diatomic molecule collide. In our case, we look at atom H3 colliding with a diatomic molecule H1-H2. Initial conditions used to run the calculation are r1(0) = 0.74 r2(0) = 2.30 and the momenta p1(0)=0 p2(0) = -2.7
| H | H |
|---|---|
| 1 | C |
| 2 | B |
| 3 | A |
and r1= rbc, r2 = rab, and p1=pbc, p2=pab
The transition state of a reaction pathway
Q: What value do the different components of the gradient of the potential energy surface have at a minimum and at a transition structure? Briefly explain how minima and transition structures can be distinguished using the curvature of the potential energy surface
At a minimum (i.e. reactants alone, products alone) the gradient(first derivative) of the potential energy surface is equivalent to zero, which also applies for the transition structure, where it is a maximum of the minimum energy pathway. However, the two can be distinguished by looking at the 2nd derivative of potential energy, as the transition state is the maximum instead of minimum. If the curvature is in a U shape, (i.e. 2nd derivative of the potential energy function >0), then it would correspond to either the reactants alone or products alone. If the curvature is in an inverse U shape (i.e. 2nd derivative of potential energy function <0), then it is the maximum point of the minimum energy pathway, and hence corresponds to the transition state.
Q: Report your best estimate of the transition state position (rts) and explain your reasoning illustrating it with a “Internuclear Distances vs Time” plot for a relevant trajectory.
Locating of the transition state can be done by setting r1=r2 (we are dealing with a symmetric system) and p1=p2=0, such that we start the trajectory on the ridge, and there is no gradient in the direction at right angles to the ridge, meaning that there is no inclination to go to either the reactants or products. The trajectory thus oscillates on the ridge and never falls off, allowing for the identification of transition state geometry.
The best estimate obtained is at rts =0.908. Looking at the contour plot in Figure 1, this results in a single stable point corresponding to the maxima of the minimum energy pathway, and does not oscillate,indicating that there is no inclination to go to either direction (to reactants or to products) and does not fall off the ridge. The internuclear Distances vs Time plot for rts =0.908 in Figure 2 also shows the internuclear distance staying constant and not oscillating. This is compared to the example with rts = 1.00, where there is oscillation as seen both in the surface plot of Figure 3 as well as the internuclear distances vs time plot in Figure 4.
-
 Figure 1ː̊Surface plot for r1=r2=0.908
 -
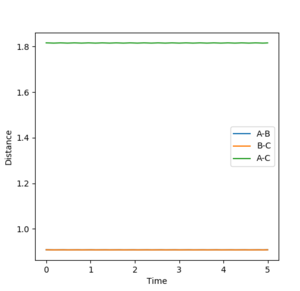 Figure 2ːInternuclear Distances vs Time plot for r1=r2=0.908
 -
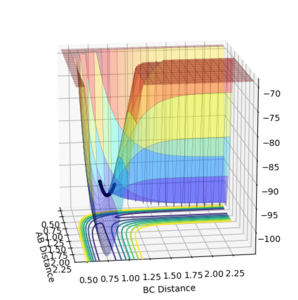 Figure 3ːSurface plot for r1=r2=1.0
 -
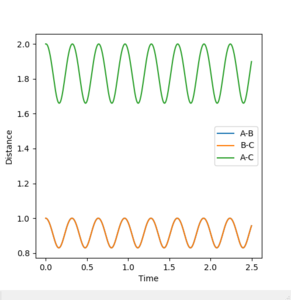 Figure 4ːInternuclear Distances vs Time plot for r1=r2=1.0


At the transition state the molecule that is not being given momentum will not move. However, if the molecule is displaced slightly from the transition state with zero momenta maintained, we can see whether the transition state "rolls" towards the reactants or the products.This is invetigated using special conditions of r1=rbc=rts +0.01 =0.918, while keeping r2 constant at 0.908 and momentas p1=p2=0 and Figure 5.1 and 5.2 showcase the progress into the product channel with these conditions, where AB distance stays constant and BC distance increases, indicating H1 moving away from H2-H3 for both mep and dynamic calculations respectively.
-
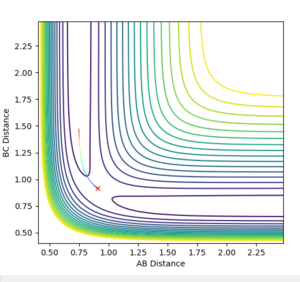 Figure 5.1ː̊Contour plot for trajectory using r1=0.918, r2=0.908, p1=p2=0
 -
 Figure 5.2ːSurface plot for trajectory using r1=0.918, r2=0.908, p1=p2=0


The reaction path
The reaction path, or the minimum energy path (mep), is a special trajectory corresponding to infinitely slow motion, where the velocity is always reset to 0 at every time step.
Q: Comment on how the mep and the trajectory you just calculated differ
The calculation utilizing mep shows a trajectory following a straight line graph down the valley floor to the point where we obtain H1, H2+H3. as seen in Figure 6.1 below.
-
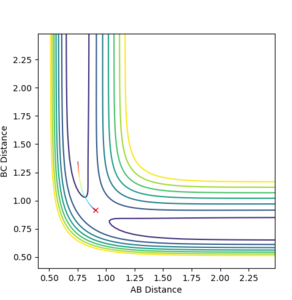 Figure 6.1ːTrajectory calculated using 'mep'
 -
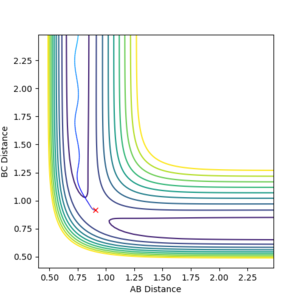 Figure 6.2ːTrajectory calculated using 'Dynamic'


Doing the same calculation using 'Dynamic' showcases the same general pathway down the valley floor, but as a wavy line, corresponding to the vibrational motion (oscillation) of H2-H3 (AB) being present as seen in Figure 6.2 below instead of a straight line as in mep. In mep calculations, only the lowest vibrational energy state of the molecule is considered at each time point, and momentum is not taken to account (i.e. the path that is the has the lowest energy is followed). Hence no oscillation is observed, because oscillation requires an input of energy to roll up the energy contour surface and back down, which is taken into account by considering momenta in the dynamic simulation, but is ignored in mep calculations. In dynamic calculations, vibrations and oscillations between different vibrational energy levels are taken into consideration, giving rise to the wavy line observed.
Q: Take note of the final values of the positions r1(t) r2(t) and the average momenta p1(t) p2(t) at large t.
For the dynamics calculations, r1 tends to to infinity at large t, while r2 oscillates around 0.74. In terms of momenta, p1 tends to a constant value of 2.5, indicative of translation, whereas p2 oscillates around a constant value of 1.2.
What would change if we used the initial conditions r1 = rts and r2 = rts+0.01 instead?
The reactive trajectory would enter the reactant channel instead, as seen in Figure 7 below, where AB distance increases while BC remains constant.
-
 Figure 7ːTrajectory for r1=0.908, r2=0.918, p1=p2=0

Q: Setup a calculation where the initial positions correspond to the final positions of the trajectory you calculated above, the same final momenta values but with their signs reversed.
What do you observe?
Conditions of final positions of trajectory calculated above:
r2=rab =8.574532064836603
r1=rbc=0.7270508715826455
p2=rab=2.4812214637632435
p1=pbc1.4101161807303408
Signs of the momenta were reversed and the calculation was re-run, but the same unreactive trajectory was obtained as seen in Figure 8 below.
-
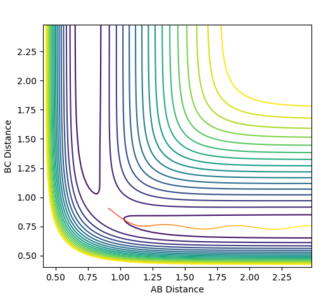 Figure 8ːUnreactive trajectory for conditions detailed above

Reactive and Unreactive trajectories
Qː What would change if we used the initial conditions r1 = rts and r2 = rts+0.01 instead?
This would result in a the reverse reaction back to the reactants of, H3, H2+H1
Q: Complete the table by adding a column with the total energy, and another column reporting if the trajectory is reactive or unreactive. For each set of initial conditions, provide a plot of the trajectory and a small description for what happens along the trajectory.
With initial positions r1 = 0.74 and r2 = 2.0 we ran trajectories with the following momenta combinations, and determined if they were reactive or not. Results and comments are summarised in Table 1 Below
Table 1. Summary if the different trajectories obtained with different combinations of momenta
| p1(BC) | p2(AB) | Total energy/ kJmol-1 | Result | Trajectory | Remarks about trajectory |
|---|---|---|---|---|---|
| -1.25 | -2.5 | -99.018 | Reactive |  |
Reactive. As r2(rab) decreases, r1(rbc) appears to be relatively constant, indicating the approach of H3 to H2-H1. Trajectory then passes through the transition state approximately r1=r2=0.90 and enters the product channel, where r2= rab stays constant while r1=rbc increases, indicating H1 moving away from newly formed H2-H3 molecule |
| -1.5 | -2.0 | -100.456 | Unreactive |  |
Unreactive. As r2(rab) decreases, r1(rbc) appears to be relatively constant, indicating the approach of H3 to H2-H1. However, r2 then starts to increase, indicating that H3 is moving further away from H2-H1.
There is insufficient momenta to cross the activation barrier and hence remains the reactant channel, and product of H2-H3 is not accessed. |
| -1.5 | -2.5 | -98.956 | Reactive |  |
Trajectory starts of in the reactant area, and has sufficient momenta to pass through the transition state to reach the product channel. This is similar to the first trajectory. r2 decreases as r1 stays constant, indicating the approach of H3 to H2-H1. Transition state is reached and trajectory enters the product channel, where r2= rab stays constant while r1=rbc increases, indicating H1 moving away from newly formed H2-H3 molecule. |
| -2.5 | -5.0 | -84.956 | Unreactive |  |
Unreactive. Oscillations are large, and is too vigorous such that though it is able to cross the energy barrier to reach across the transition state, momentum is so high such that it is able to immediately recross over the boundary to return to the reactant channel.While initially r2 decreases as r1 stays constant, indicating the approach of H3 to H2-H1, the trajectory illustrates the molecules bouncing away from each other back into the reactant channel, and H2-H3 is not formed. |
| -2.5 | -5.2 | -83.416 | Reactive |  |
Reactive. Even though the molecule has a very large a momenta such that it can cross the transition state barrier multiple times, bouncing back and forth between the reactant and product channels, it eventually crosses over and enters the product channel with r2 constant and increasing r1, indicative of the formation of H2-H3 and the moving away of H1 away from the molecule |
Q: State what are the main assumptions of Transition State Theory. Given the results you have obtained, how will Transition State Theory predictions for reaction rate values compare with experimental values?
The main assumptions[1] of the transition state theory are listed below:
1) Born-oppenheimer approximation is invoked, meaning that the electron motion and nuclei motion are assumed to be independent.
2) Atoms in the reactant state have energies that follow the Boltzmann distribution, ie the system is at equilibration.
3) Once the system is able to attain and passes the transition state, it will not recross back to the initial reactant channel.
4) Atomic nuclei behave according to classical mechanics[2], and hence if atoms collide with sufficient energy to reach the transition structure, reaction does not occur.
Immediately, as from the fourth example we have presented in Table 1, we can see that assumption 3 is not valid, as it shows the trajectory crossing the activation barrier, and attaining the transition state, but then returning to the reactant channel, making it an overall unreactive process. This can be due to the molecules colliding with sufficient energy, but perhaps with the wrong orientation for bond formation to occur. As these unreactive pathways are not considered in the TST, rates calculated by TST are thus higher than those experimentally determined values as they assume that once TS has been attained, reaction is successful.
In the case of assumption 4, this might not be true as espescially when there are low activation energies for the reactions, there is an increased probability of quantum tunneling[3] occurring, giving rise to chances that reaction will still occur even though molecules collide with insufficient energy. This results in the experimental values being higher than the TST predicted values.
Assumption 1 is valid for low reaction temperatures, but at higher temperatures, higher energy vibrational modes may be accessed. The motion of these molecules become more complicated and the different types of transition states formed might be very different from that of the maxima of the minimum energy surface.
Ng611 (talk) 20:18, 24 May 2018 (BST) Good first section! Well done!
Exercise 2: F -H-H system
| F + H2 --> HF + H | H + HF --> H2 + F | ||
|---|---|---|---|
| Atom entry | Atom | Atom entry | Atom |
| A | F | A | H |
| B | H | B | H |
| B | H | C | F |
PES inspection
Q: Classify the F + H2 and H + HF reactions according to their energetics (endothermic or exothermic). How does this relate to the bond strength of the chemical species involved?
The F + H2 reaction is exothermic and the H + HF reaction is endothermic, given that the H-F bond is much stronger at 565 kJmol-1 than the H-H bond at 432 kJmol-1[4]
Q: Locate the approximate position of the transition state
To determine the transition state, we set p1=p2=0 such that the molecule is constrained on the ridge. In this system, it is no longer symmetric, hence at the transition state, rab will not be equal to rbc and we have to vary both values to find a combination that gives rise to non-oscillating and constant internuclear distances with time.
To simplify our search, we take into account the Hammond's postulate, that states that for an exothermic reaction (F + H2 --> HF + H), the transition state will be more similar to the reactants than the products. Hence in the transition state, rab(rFH) > rbc(rHH).
Utilising trial and error, Table 3 corresponds to the conditions that give the stable transition state.
Table 3: Initial conditions that give rise to the transition state.
| rts | pts |
|---|---|
| rab(rFH) =1.81 | pab=0 |
| rbc(rHH) =0.746 | pbc=0 |
This set of conditions is confirmed to give the transition state looking at the surface plot of Figure 9.1 where it is just a point on the ridge, as well as the internuclear distances vs time plot in Figure 9.2 which shows constant and non-oscillating internuclear distances.
These indicate that the conditions give rise to a state corresponding to the stable maxima of the minimum energy pathway.
-
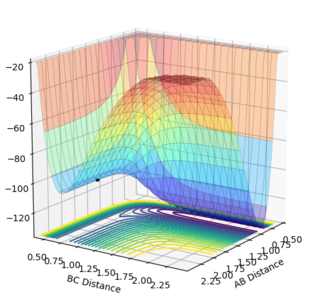 Figure 9.1ːSurface plot using the initial conditions reported in Table 3
 -
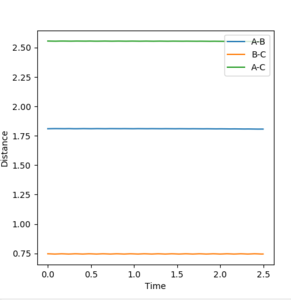 Figure 9.2ːInternuclear distances vs time plot using the initial conditions reported in Table 3


Q: Report the activation energy for both reactions.
To calculate the activation energies, we slightly displace the atoms from their transition state positions, with momenta p1=p2=0. We follow the minimum energy pathway and conduct an mep calculation to obtain the relevant energies. Table 4 details the conditions used to run the mep calculations for each reaction.
Table 4: Conditions and results of mep calculations
| Reaction | rab(rFH) | rbc(rHH) | Transition State energy/kJmol-1 | Energy of reactants /kJmol-1 | Activation energy /kJmol-1 | Plot of energy versus time |
|---|---|---|---|---|---|---|
| F + H2 --> HF + H | 1.82 | 0.746 | -103.751 | -103.928 | 0.178 |  |
| H + HF --> H2 + F | 1.80 | 0.746 | -103.751 | -133.981 | 30.23 |  |
It is interesting to note that the energy of the reactants does not reach a constant value unlike the backward reaction in the second row of Table 4, even though 80000 steps were being used for the calculation. As the activation energy for the forward exothermic reaction is very small, the calculated value of activation energy for the F + H2 --> HF + H reaction may be of a high degree of inaccuracy.
Ng611 (talk) 20:20, 24 May 2018 (BST) It may have been useful to run a 'dynamics' calculation for the reactants, as this would allow you to obtain a better estimate of the activation energy. You are right though in observing the value is inaccurrate though - well done.
Reaction dynamics
Forward reaction F + H2 --> HF + H
Q: Identify a set of initial conditions that results in a reactive trajectory for the F + H2, and look at the “Animation” and “Internuclear Momenta vs Time”. In light of the fact that energy is conserved, discuss the mechanism of release of the reaction energy. How could this be confirmed experimentally?
This is done using trial and error, and Table 5 below summarises the initial conditions leading to a reactive trajectory as confirmed by the surface plot in Figure 10.1 below.
Table 5. Initial conditions to produce a reactive trajectory
| Distances | |
|---|---|
| rab(rFH) =2.30 | pab(pFH) = -2.6 |
| rbc(rHH) =0.74 | pbc(pHH) = -0.1 |
-
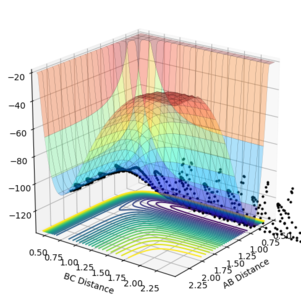 Figure 10.1ːSurface plot for initial conditions as in Table 5
 -
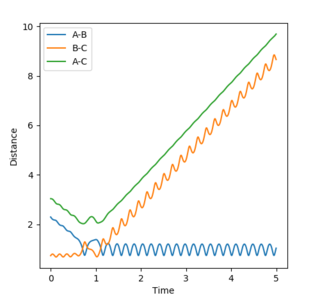 Figure 10.2ːInternuclear position vs time for initial conditions as in Table 5


Given that energy is conserved, the energy released is converted to vibrational energy of the molecules, as can be observed from the wavy lines on the surface plot in Figure 10.1, as well as by the oscillation in internuclear distances of A-B(F-H) and B-C (H-H) in Figure 10.2.
The difference in energy of reactants and products can be determined experimentally using calorimetry as we can measure the amount of heat evolved from the reaction (an increase in the temperature), which confirms that the reaction is exothermic.
IR spectroscopy on reactants and products could be done, as they would vibrate at different frequencies as can been seen on the internuclear momenta vs time graph in Figure 11 below, allowing confirmation that reaction has proceeded. Moreover, the products are more vibrationally excited and hence will appear as much larger peaks on the IR spectra.
Ng611 (talk) 20:22, 24 May 2018 (BST) IR spectroscopy may be a good choice but I'm not sure that the peaks would be 'larger'. Other IR effects (overtone bands) would probably be more likely.

Q: Setup a calculation starting on the side of the reactants of F + H2, at the bottom of the well rHH = 0.74, with a momentum pFH = -0.5, and explore several values of pHH in the range -3 to 3 (explore values also close to these limits). What do you observe? Note that we are putting a significant amount of energy (much more than the activation energy) into the system on the H - H vibration.
We ran calculations using rFH = 2.3, rHH = 0.74, with a momentum pFH = -0.5, and explored several values of pHH in the range -3 to 3 as detailed on Table 6.
Table 6. Results of varying pHH between -3 and 3
| pHH | Reactive? | Trajectory | Discussion |
|---|---|---|---|
| -3 | Unreactive |  |
Here, the H-H molecule is being given sufficient momentum to cross the boundary, but immediately bounces back to the reactant channel |
| -1 | Unreactive |  |
H-H molecule is given momentum but it is insufficient for it to cross the activation barrier and reach the transition state position and hence it remains in the reactant channel. |
| 0 | Unreactive |  |
The H-H molecule is not being given any momentum and hence the atoms do not have energy to cross the activation barrier to reach the transition state. They do not approach close to the transition state position. |
| 1 | Unreactive |  |
H-H molecule is given momentum but it is still insufficient for it to cross the activation barrier and reach the transition state position as it can be seen just staying in the reactant channel. |
| 2 | Unreactive |  |
Here, the H-H molecule is being given sufficient momentum to cross the boundary, but immediately bounces back to the reactant channel |
| 3 | Unreactive | |
Here, the H-H molecule is being given sufficient momentum to cross the boundary, but immediately bounces back to the reactant channel |
Polanyi's empirical rules
Q: Discuss how the distribution of energy between different modes (translation and vibration) affect the efficiency of the reaction, and how this is influenced by the position of the transition state.'
Polanyi's rules, state that for a late transition state reaction, vibrational energy is more efficient in promoting that reaction than translational energy, and that for an early transition state reaction, the reverse is true[5]. This is directly applicable to the two reactions that we are currently studying. In the forward exothermic reaction(F + H2 --> HF + H), it is an early transition state reaction and hence the Polanyi's rules suggest that translational energy is more important than the vibrational energy. This we do observe in Table 6, where changing the H-H vibrational energy (pHH) does not seem to allow the system to achieve a reactive trajectory.

For the forward reaction, we run a new calculation, [ rab(rFH) =2.30, rbc(rHH) =0.74] while increasing the momentum pFH slightly to -0.8, and considerably reducing the overall energy of the system by reducing the momentum pHH to -0.1 results in a reactive trajectory as seen above in Figure 12 as vibrational energy of H-H is decreased, but translational energy is being increased, allowing for more collisions of F with H2 and hence an increased chance of a reaction occuring. This reaction thus does follow the Polanyi's rules.
Reverse reaction H + HF --> H2 + F
To see if the reverse is true, we look at the reverse endothermic reaction (H + HF --> H2 + F)
We set up a calculation [ rab(rHH) =2.30, rbc(rHF) =0.91 ] with low vibrational motion on on the H - F bond ( pHF=-6) and an arbitrarily high value of pHH = -0.1 . This gives a surface as seen in Figure 13, with an unreactive trajectory.
-
 Figure 13ːSurface plot for new conditions for the reverse reaction
 -
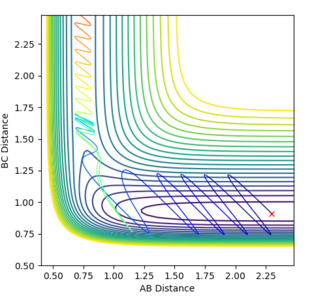 Figure 14ːReactive trajectory under new conditions


This is because the reverse reaction is endothermic, and according to the Hammond's postulate and the transition state should be more similar to the products( i.e. late transition state reaction). Thus according to Polanyi's role, the vibrational energy(pHF=pbc) would be more important than translational energy(pHH = pab) to drive the reaction.
This is further confirmed when when a reactive trajectory is produced as seen in Figure 14 above, where pHF=pbc=6.89 and pHH = pab = -1, where we input a much larger vibrational energy than translational energy.
These calculations showcase that Polanyi's rules are a good estimate of which type of energy (vibrational or translational) is more efficient in the promotion of reaction depending on the type of transition state (early/late).
Ng611 (talk) 20:23, 24 May 2018 (BST) Good examples for Polanyi rules, good second section and good report! Well done!
References
- ↑ T. Bligaard and J. K. Nørskov,in Chemical Bonding at Surfaces and Interfaces, Elsevier, 2008, pp. 255–321.
- ↑ H. Eyring, J. Chem. Phys., 1935, 3, 107–115.
- ↑ H. Guo and K. Liu, Chem.Sci., 2016, 7, 3992–4003.
- ↑ Y.-R. Luo, Comprehensive handbook of chemical bond energies, CRC Press, 2007.
- ↑ Z. Zhang, Y. Zhou, D. H. Zhang, G. Czakó and J. M. Bowman, J. Phys. Chem. Lett., 2012, 3, 3416–3419.