MRD:by416
Molecular Reaction Dynamics
EXERCISE 1: H + H2 system
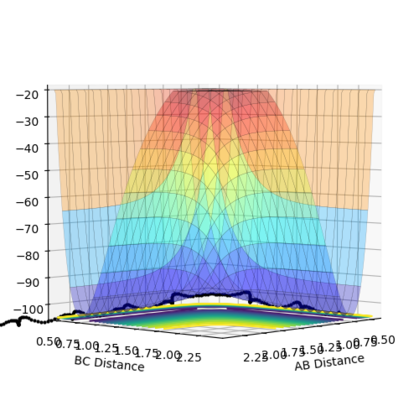
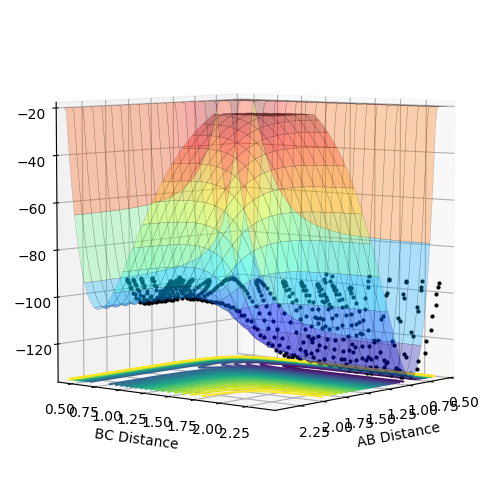
The transition energy (maxima This is not only a maxima, it is both maxima and a minima at the same time (depending on which direction you are looking at). This weird point is called a saddle point--Sw2711 (talk) 18:49, 15 May 2018 (BST)) and minima both have differentials equal to 0 (gradient is 0This part, fair.--Sw2711 (talk) 18:49, 15 May 2018 (BST)). The potential energy surface presents the minima and maxima by use of different curvature. The curvature is more at the maxima points and less at the minima points. For this part, I understand that is what you observed. But this is not the definition of min and max on the PE surface, if you see what I mean. But I think your observation is very cool. Have you thought about why it is like this? The curvature happens to be this way is because of the intrinsic chemical properties – check the Morse potential, then you draw millions of Morse potential at all distances for both AB and BC, combining with the activation energy for a reaction to occur, you will get an energy surface diagram as shown. --- Make sense? --Sw2711 (talk) 18:49, 15 May 2018 (BST) At the maxima the potential energy (y axis I think you mean z axis, the energy right? xy axes are AB/BC distances--Sw2711 (talk) 18:49, 15 May 2018 (BST)) is much higher than the potential energy at the minima, as shown in the image:
Furthermore, as indicated by the curvature of the lines, the maxima can be found as this is where the lines increase in curvature. I am not sure whether it is true. You can have a maxima, minima or a saddle point at different arbitrary curvatures. --Sw2711 (talk) 18:49, 15 May 2018 (BST)This also indicates that the potential energy is increasing. (Increase in curvature doesn’t indicate the potential energy is increasing. But if you argue that ‘This’ is the maxima, well, fair enough. But then it is not an indication. Maxima means Maximum energy, is that what you meant?--Sw2711 (talk) 18:49, 15 May 2018 (BST)The reverse can be applied for the minima (less curvature). Again, curvature has nothing to do with minima or maxima. Curvature doesn’t defined them. What you said here, is an observation just for this example.--Sw2711 (talk) 18:49, 15 May 2018 (BST)
Sorry for being wordy. I just want to make sure that you understand this properly. What I am looking for here, is that you understand that TS is a saddle point (Please check the pringles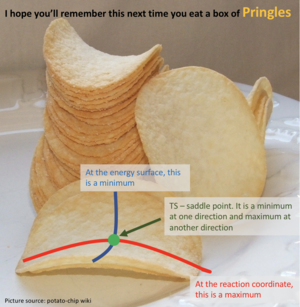
--Sw2711 (talk) 18:49, 15 May 2018 (BST)
Locating the transition state:
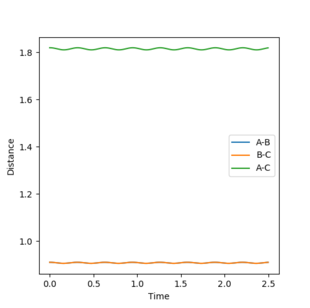
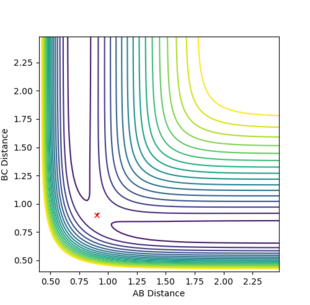
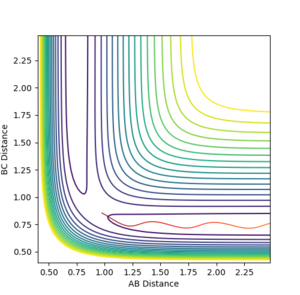
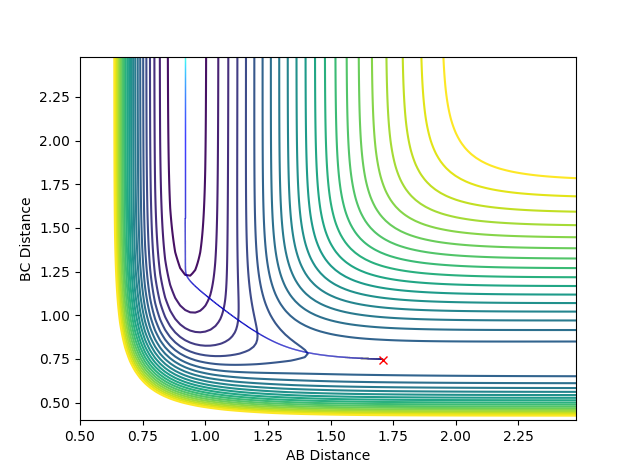
The best estimate of transition state position is 0.91. As shown in the contour plot, the atoms are all in the same position and are not falling off the ridge.
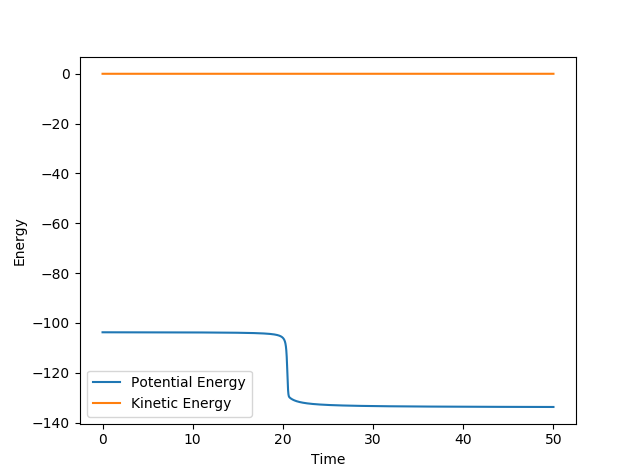
This is corroborated by the graph representing intermolecular distances and time. This graph represents the movement of the atoms with time, and as presented there is minimal movement. This also indicates they are not falling off the ridge. Have you tried 0.90, 0.92, or 0.901 -> 0.909? Some of them are also in the same position and not falling off the ridge. Why not one of them? I can interpret minimal movement as ‘stationary’, i.e. a straight line, but I’m just curious whether it is the ‘best’ estimation you can get. You’ve tested up to 2.5 (seconds). Have you tried longer time, would it fall off after e.g. 5 seconds? --Sw2711 (talk) 18:58, 15 May 2018 (BST)
Calculating the reaction path:
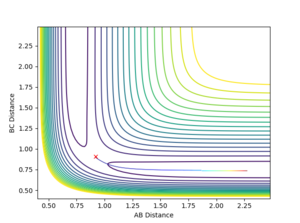
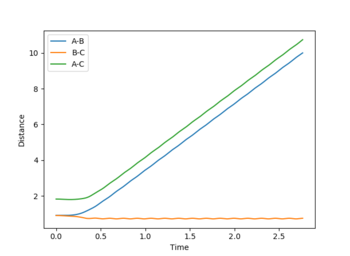
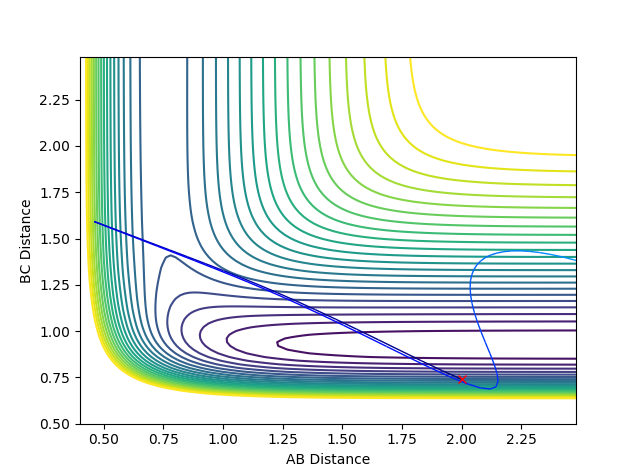
The MEP diagram does not take into account how the mass affects the trajectory of the atom. Hence, it produces a straight line, shown in the figure on the right. In your lab script - the velocity always reset to zero in each time step - that's why it is a straight line--Sw2711 (talk) 19:03, 15 May 2018 (BST) The dynamic diagram does take into account the mass, and produces a more accurate path that the atom takes
If the values were reversed, then the reversed graphs would be shown. The position and momenta at large t would also reflect the changes.
Position and momenta at large t:
As time increases the momenta increases. The average momenta at large t: AB momentum: 2.5 BC momentum: 1.75
As time increases the bond distance increases for the atoms getting further away from each other. The A-B bond distance is roughly 10. Whereas, the B-C bond stays roughly 0.75 as the atoms do not move away from each other.
With the values reversed, the A-B distance will stay low and constant with time and the B-C bond distance will increase with time.
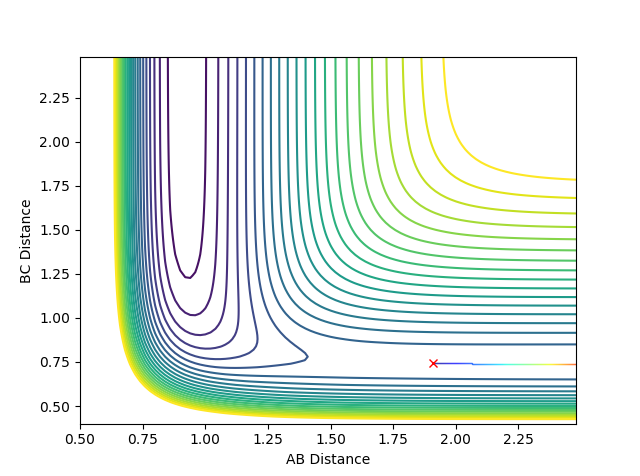
When the bond distances and momenta are made to be those states at high times, how the atoms come together to transition state is shown. This is demonstrated in the contour and surface plot: Both the contour and the surface plot show the atoms coming towards the transition state, indicating that what has been calculated is the reverse of the trajectory from the transition state to a minimum state (reactants).
This part, fair--Sw2711 (talk) 19:09, 15 May 2018 (BST)
Reactive and unreactive trajectories:
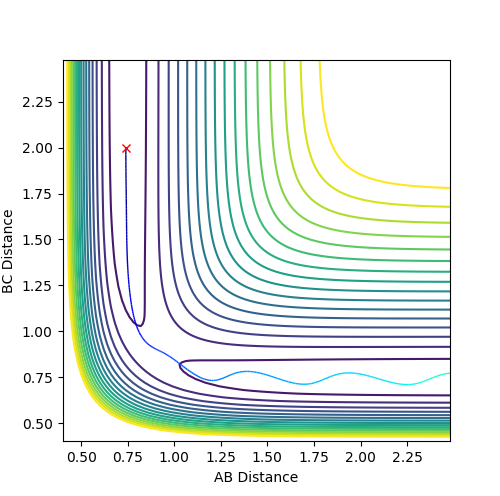
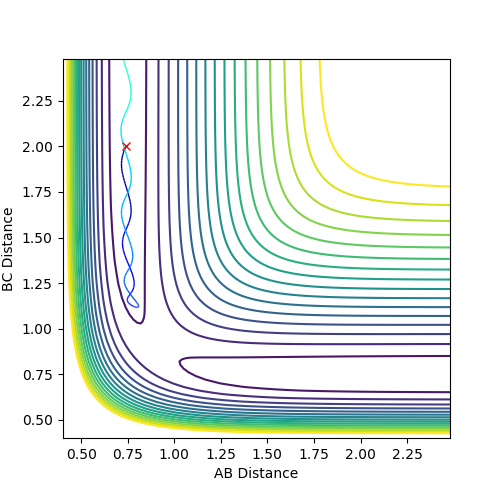
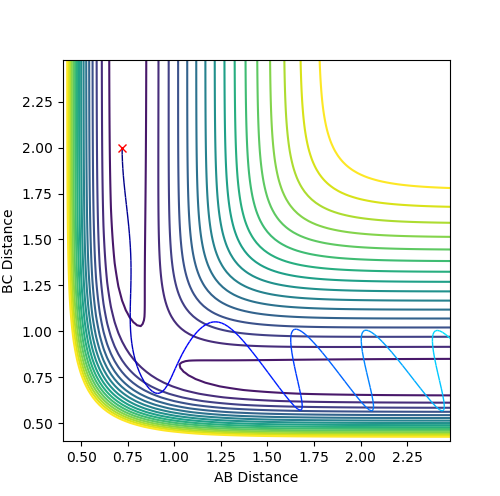
The intial postions are kept constant throughout:
AB = 0.74 , BC = 2.0
| AB momentum | BC momentum | Total energy | Reactive (R) or un-reactive (UNR) | Graph number |
|---|---|---|---|---|
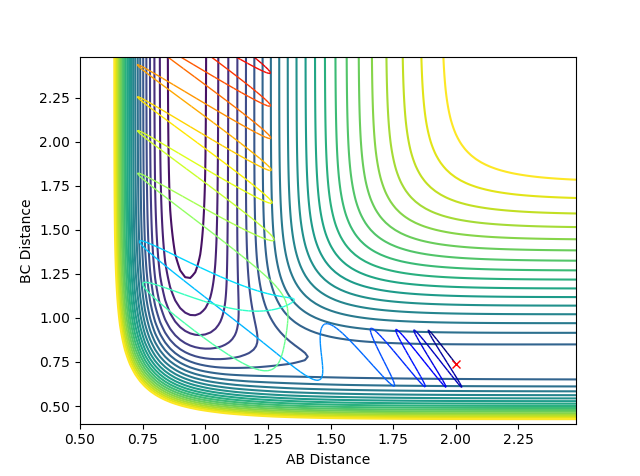
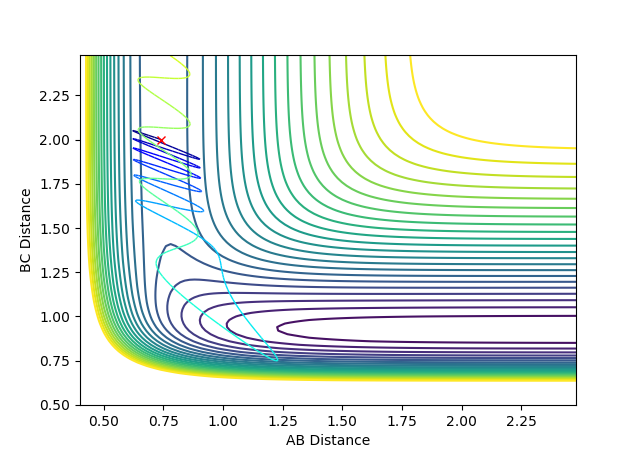
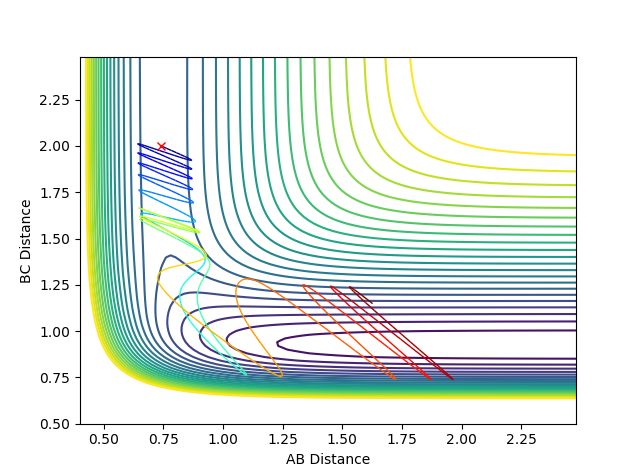
| -1.25 | -2.5 | -99.02 | R | 1 |
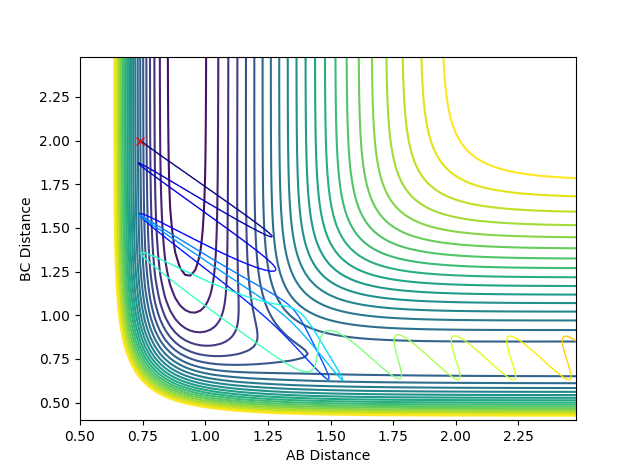
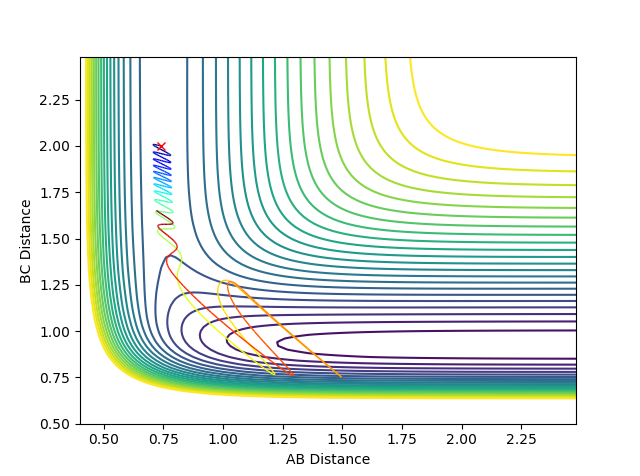
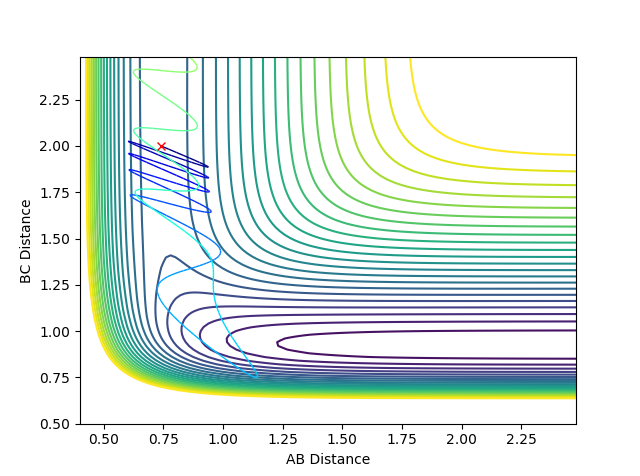
| -1.5 | -2.0 | -100.46 | UNR | 2 |
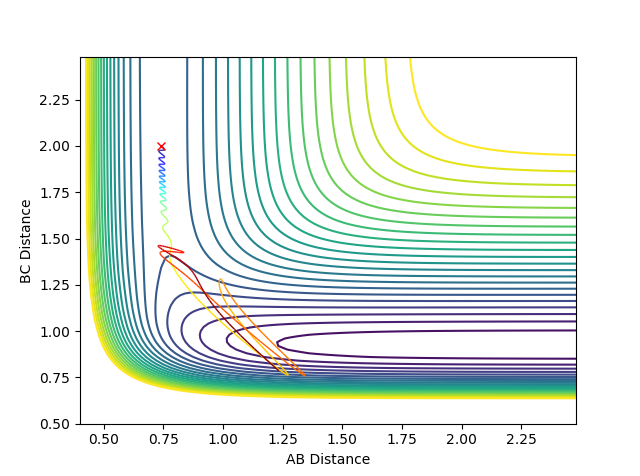
| -1.5 | -2.5 | -98.96 | R | 3 |
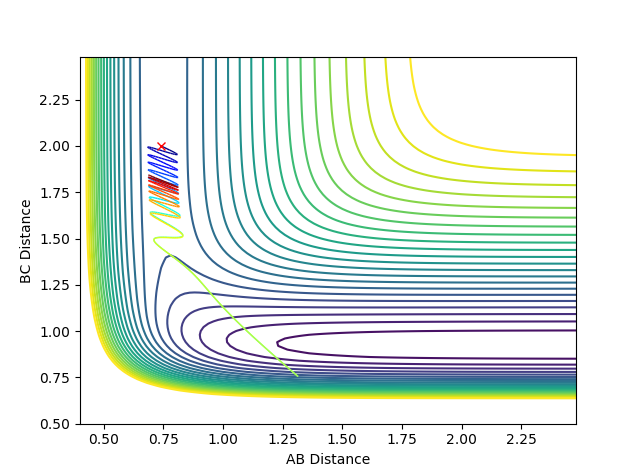
| -2.5 | -5.0 | -84.56 | UNR | 4 |
| -2.5 | -5.4 | -81.80 | R | 5 |
Graph 1:
This is a reactive path way. With time, atom C draws closer to the A-B bond. The A-B bond breaks and the B-C bond is formed.
Graph 2:
This is an un-reactive path way. It is very similar to the first reaction pathway (graph 1). However, as C approaches the A-B bond it does not have enough momentum to form a bond with B. Therefore, atom C then moves away from the A-B bond. The A-B bond remains.
Graph 3:
This is a reactive pathway. It is very similar to the first pathway, atom C takes the same pathway as it does in graph 1. However, in this circumstance it has less energy, therefore requires more time to reach the transition state and react in the transition state.
Graph 4:
This is a un-reactive pathway. Atom C has a lot of momentum as it reaches the A-B. This pulls apart the A-B bond and atom B is pulled towards atom C. However, atom B is pulled back by atom A, reforming the A-B bond.
Graph 5:
This is a reactive pathway. As atom C approaches the bond A-B it pulls apart the bond. It is then followed by A pulling B bond to reform the A-B bond. However, as the momentum of C is very high, it pulls back atom B, consequently forming the B-C bond.
Case1-3, good. Case 4-5: I think you have accidentally swapped Graph 5 and 4. Also, 'pull' is not a very accurate word to use. ABC are three same atoms. I think some words you could consider are 'oscillating' or 'cross TS, re=cross TS', etc--Sw2711 (talk) 19:15, 15 May 2018 (BST)
Transition state theory
Transition state theory (TST) aims to understand how chemical reactions take place by explaining the reaction rates of elementary chemical reactions. The transition state theory works because of assumptions. One of these being that there are no quantum effects and classical mechanics is applied. The TST assumes that unless molecules have enough energy to reach transition state, they will not react. Which means, as long as it has enough energy to reach TS, it will react. Compare to the five tests you did above, do you agree this assumption or not?--Sw2711 (talk) 19:23, 15 May 2018 (BST) Hence, TST does not take into account quantum-tunneling effects, which can cause a reaction to occur without atoms reaching transition state. The TST also assumes that the atoms in the reactant state have energies that are Boltzmann distributed. our system only has three atoms. Does Boltzman distribution apply?--Sw2711 (talk) 19:23, 15 May 2018 (BST)This is satisfied if the system has had enough time to calibrate. However, this is not the same in all cases.
Another assumption of TST is that the reactants, once past the energy maxima: the transition state, forms the products, and it cannot return to the reactants.
Overall, I think it is good effort here. You've read literature and attempted to explain based on your knowledge. You just need to sometimes think about in a more coherent way - how does it link to what I am doing.--Sw2711 (talk) 19:23, 15 May 2018 (BST)
F-H-H system
F + H2 --> HF + H
The conditions of this reaction is as follows:
H-F bond distance: 2 Å
H-H bond distance: 0.74 Å
H-F momentum: -0.5 kgms-1
H-H momentum: 2.90 kgms-1
The reaction is exothermic as the products are lower in energy than the reactants.
Neat and clearly with evidence. Great!--Sw2711 (talk) 19:24, 15 May 2018 (BST)
HF + H --> F + H2
The conditions of this reaction is as follows:
H-H bond distance: 2 Å
H-F bond distance: 0.74 Å
H-H momentum: -0.5 kgms-1
H-F momentum: 2.55 kgms-1
The reaction is endothermic as the reactants are lower in energy than the products.
Same here. Great!--Sw2711 (talk) 19:25, 15 May 2018 (BST)
This indicates that the H-F bond is stronger than the H-H bond, as the reaction that requires the breaking of the H-F bond requires energy to occur. Up to here, great!--Sw2711 (talk) 19:31, 15 May 2018 (BST) Unlike the breaking of the H-H bond, which releases energy. Here is a No. Breaking HH bond doens't release energy -> then why does it form a bond? how could it be stable. it is just in this case, the activation energy is small. Breaking bond=>Absorb energy; Forming bond=> release energy. It is just in this case, Breaking HH bond=>Absorb energy (small); Forming HF bond=> release energy (big). So overall - release energy--Sw2711 (talk) 19:31, 15 May 2018 (BST)
Transition state
distance between :
HF: 1.811 Å
HH: 0.745 Å
Yes, I can see some diagrams. But I would still like some word explanations -> Pretending I am not the marker. But a normal chemist with general chemistry knowledge. What do those figures mean? --Sw2711 (talk) 19:33, 15 May 2018 (BST)
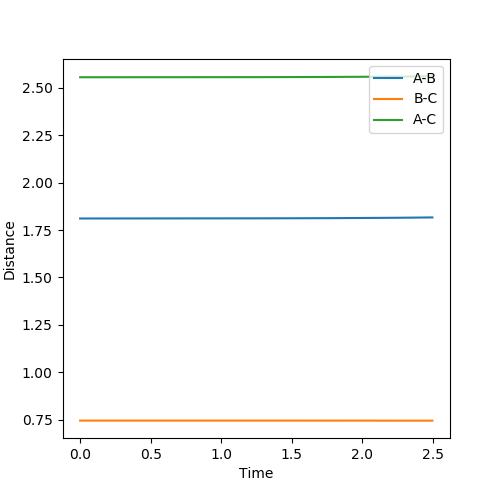
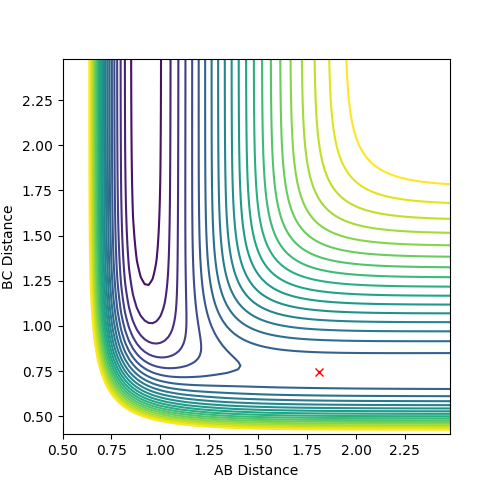

Activation energy:
The activation energy is essentially the difference in energy between the reactants and the transition state.
Now this part is good again, because you've told me how to read those figures, what that means and what you've got--Sw2711 (talk) 19:36, 15 May 2018 (BST)
The energy of the transition state is -103.752
The energy of the reactants and products can be obtained by adding or subtracting some distance ( in this case 0.1 Å) is added to the H-F bond length. This plots the trajectory of the atoms. If 0.1 Å is added, the reaction falls into the reactants, F + H2. If 0.1 Å is subtracted, the reaction falls into the products, HF + H. From this , the last point of the trajectory can be chosen and the energy of that state can be worked out.
The transition state energy can then be worked out by finding the difference.
F + H2
Energy of reactants are: -103.962
Energy difference/ activation energy for F + H2 : 0.21 kcal/mol
This can be supported by a MEP energy vs time plot of the F + H2 region:
HF + H:
Energy of products are: -133.996
Energy difference/ activation energy for HF + H : 30.244 kcal/mol
Reaction dynamics
The conditions of a reactive trajectory were found before, through trial and error, and are as listed below:
F + H2 --> HF + H
H-F bond distance: 2 Å
H-H bond distance: 0.74 Å
H-F momentum: -0.5 kgms-1
H-H momentum: 2.90 kgms-1
HF + H --> F + H2
The conditions of this reaction is as follows:
H-H bond distance: 2 Å
H-F bond distance: 0.74 Å
H-H momentum: -0.5 kgms-1
H-F momentum: 2.55 kgms-1
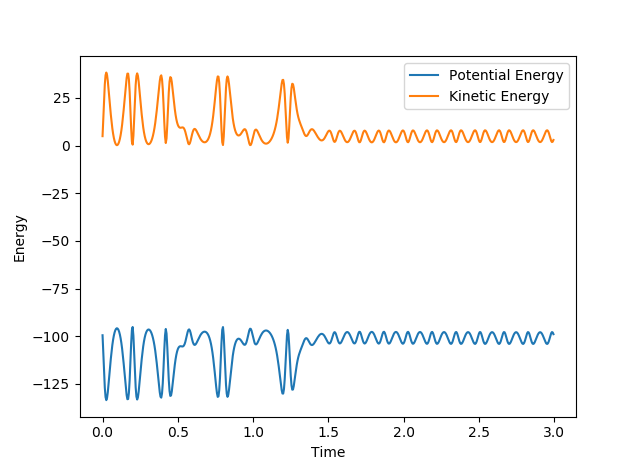
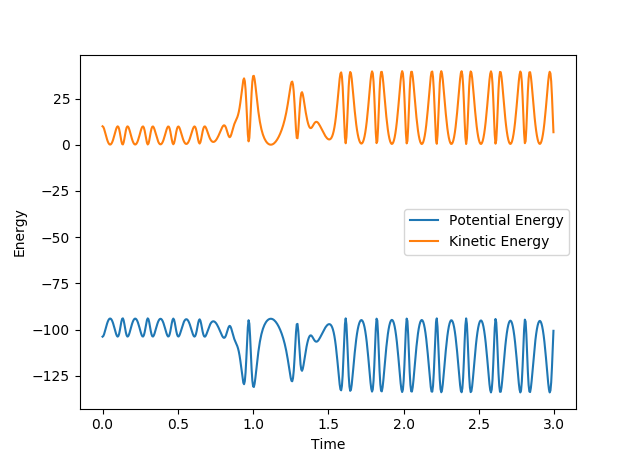
The fact that energy is conserved can be shown by the time vs energy graphs shown:
The two images show that the change in kinetic and potential energy is mirrored, they are symmetric. Kinetic energy is being converted into potential energy and vice versa. This change can be measured with calorimetry, as there are heat changes for both reactions. Good, you just need one more sentence to explain -> what kind of change means what--Sw2711 (talk) 19:38, 15 May 2018 (BST)
Changing momentum values
Keeping these values constant: H-H bond distance: 0.74 Å
H-F bond distance: 2 Å
H-F momentum: -0.5 kgms-1
The momentum of H-H was varied from -3 to 3:
-3:
In this example the is system crossing, where the H-F bond forms but quickly breaks. This is an un-reactive pathway which falls back into the products
-2
This is a reactive pathway. The H-F bond forms.
-1
This is an unreactive pathway, although the H-f bond does form but breaks.
0
This is an unreactive pathway. The H-H bond has very low momentum so it approaches F with insufficient energy. Although the H is attracted by the F's pull, it is not enough to form the bond.
1
This is an unreactive pathway. It is similar to the example above but still has insufficient energy to form the H-F bond.
2
This is a reactive pathway. The H-H approaches the F with enough energy for the H-F bond to form.
3
This is an unreactive pathway. The H-F bond forms but breaks quickly.
Changing initial conditions
The initial conditions for F + H2 --> HF + H were changed to:
H-F bond distance: 2 Å
H-H bond distance: 0.74 Å
H-F momentum: -0.8 kgms-1
H-H momentum: 0.1 kgms-1
The graph produced is as follows:
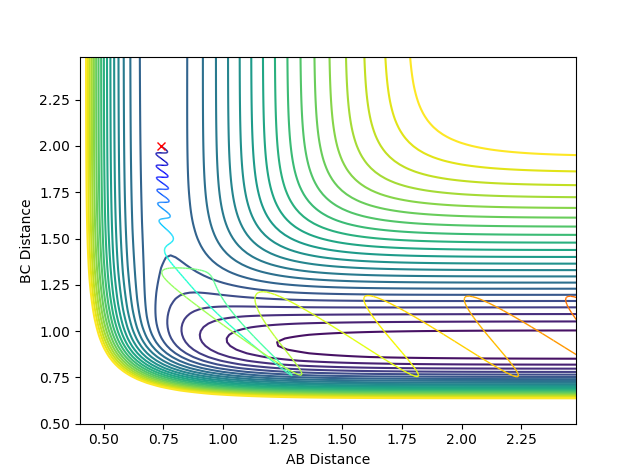
This is a reactive pathway where there is system recrossing.
Focusing on reverse: H + HF
The initial conditions, presented previously, are given by:
HF + H --> F + H2
The conditions of this reaction is as follows:
H-H bond distance: 2 Å
H-F bond distance: 0.74 Å
H-H momentum: -0.5 kgms-1
H-F momentum: 2.55 kgms-1
If the distances are kept the same, and the momenta are changed to: H-H momentum: -7 kgms-1 (a high arbitrary value)
H-F momentum: 1 kgms-1 (lower than initial)
This graph shows that the high energy H which collides with the H-F, although has energy higher than the energy needed, does not cause a reaction.
Polanyl's empirical rules:
The distribution of translational and vibrational energy affect the efficiency of the reaction as it is dependent on the energy of the transtiion state and therefore there needs to be an optimum of both to achieve a successful reaction.
If there is a late transition state, such as that in an endothermic reaction, vibrational energy affects the efficiency.
If there is an early transition state, such as that in an exothermic reaction, translational energy affects the efficiency.
For example, in the examples below the momenta of the atoms/molecules is changed, but the total momenta is kept constant. The example shown is for the exothermic reaction F + H2.
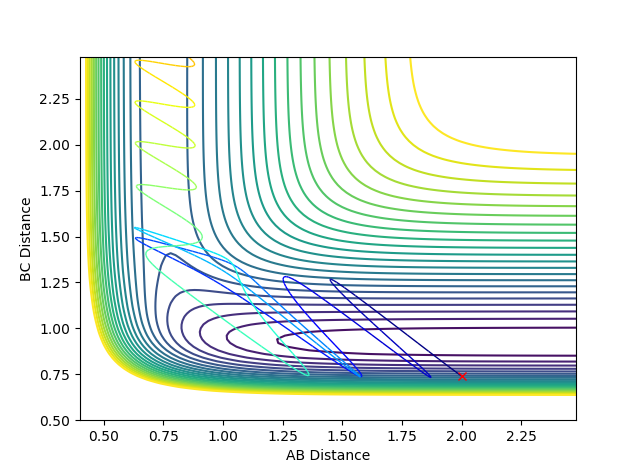
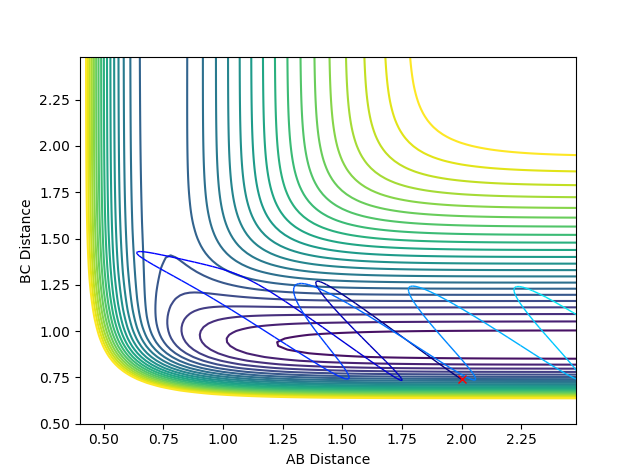
However, the change in momenta of the individual atoms/molecules changed the reactive pathway to an un-reactive pathway. This shows exothermic reactions favour the vibrational energy in terms of efficiency.
I think your last sets of experiments are great and conclusion is great too!--Sw2711 (talk) 19:42, 15 May 2018 (BST)

