
MRD:bs4618
Overall this report was a pleasure to mark. Your presentation was perfect. Additionally, you have answered each question in depth explaining your methodology and reasoning. It is great to see you have also included references. Keep up the great work! Mys18 (talk) 10:34, 26 June 2020 (BST)
EXERCISE 1: H + H2 system
The transition state
The transition state is a saddle point on the potential energy surface. As such, it is a stationary point and the gradient of the potential energy is zero. For a two-variable function, the first derivative with respect to both variables must be 0:
fr1 = 0 and fr2 = 0
where fr1 is the first derivative of the potential energy with respect to r1 and fr2 is the first derivative of the potential energy with respect to r2.
To differentiate the saddle point from local maxima or minima of the function, the nature of the obtained stationary points can be determined calculating the discriminant (D) of the potential energy function:
D = fr1r1 (r1,0,r2,0)×fr1r1 (r1,0,r2,0) - [fr1r2 (r1,0,r2,0)]2
If D < 0 then the potential energy function has a saddle point at (r1,0,r2,0,), whereas if D > 0 and fr1r1 (r1,0,r2,0) > 0 the stationary point is a local minimum, if fr1r1 (r1,0,r2,0) < 0 it is a local maximum.
Good. With differentiating between TS and local minimum the value of the second derivative being negative does not instantly mean it is a TS, but rather the value being positive in all directions indicates it is a local minimum. With the second derivative being negative and then positive in the orthogonal direction it indicates it is the TS (this makes sense because check out what a saddle point is). Mys18 (talk) 10:14, 26 June 2020 (BST)
The best estimate for transition state position
As all three atoms are hydrogens, the transition state must be symmetric i.e. r1(ts) = r2(ts) = rts. To give a good approximation for this distance, a simulation can be set up with arbitrary, but equal r1 and r2 values. This way both 'outside' hydrogens will be at equal distance from the middle hydrogen atom at all times (r1= r2) and will undergo an oscillation centred at the middle hydrogen that remains stationary. The potential energy will reach it's minimum every time the distances are equal to the transition the transition state distance. These time coordinates can be read from the energy vs time plot. At these time coordinates the atoms are in their transition state positions, and this internuclear distance can be read from the internuclear distance vs time plot.
-

Energy vs. time plot of a three hydrogen system with r1 = r2 = 140 pm initial distances. As it can be seen the potential energy is the lowest at around t = 7, 12, 27, 32 and 47 femtoseconds. -
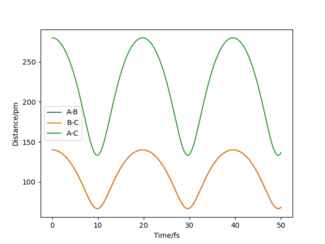
Internuclear distance vs. time plot of the same system. A-B = r1, B-C = r2. At the same time coordinates where the potential energy was minimal, r1 = r2 ≈ 90 pm. Note that the plot of r1 and r2 is in complete overlap due to symmetry.

These values can be plugged in for a second simulation to refine the results. When the exact value of rts is matched, the atoms remain stationary and both the energy and the distance over time functions remain constant, the kinetic energy is 0 and no oscillatory behaviour can be seen. The transition state position (rts) value was obtained to be 90.8 pm.
-

Energy vs. time plot of the same system with r1 = r2 = 90.8 pm initial distances. This value was obtained to be closest to the rts value. The potential energy remains constant at its minimum, equalling total energy and the kinetic energy is 0 as there is no nuclear motion. -

Internuclear distance vs. time plot at r1 = r2 = rts = 90.8 pm. There is no visible change in any distances as there is no nuclear motion.


Excellent! Good job in explaining your methodology! Mys18 (talk) 10:15, 26 June 2020 (BST)
Calculating the reaction path
Changing the settings to minimum energy path from dynamics allows allows calculating the reaction path. This works by setting the velocities to 0 in each step, therefore the motion of the atoms will not be affected by their initial momenta, only the forces acting upon them. The trajectory appears the following after a small displacement from the transition state(r2 = rts, r1 = rts)

The same can be seen on the interatomic distance plot:

If the simulation is set back to dynamic, the momenta are transmitted between the steps. This will result in an oscillatory behaviour.
-

Potential energy trajectory of the previous system but with dynamic setup. It can be seen that the r2 distance (BC) is not at the energy minimum but oscillating in the potential well, while r1 (AB) increases. This is due to the propagation of the momenta between the steps that prompts the atoms for oscillation. -

Internuclear distance vs. time plot with dynamic setup. A-B = r1, B-C = r2 After passing the transition state, r2 is oscillating around the lowest potential energy distance. The r1 is increasing, approaching a constant gradient but is slightly affected by the oscillatory behaviour of r2. The distance increases at a much higher rate as the velocities are not being reset to zero. -

Momenta vs. time plot with dynamic setup. A-B = r1, B-C = r2. The momenta do not stay 0 anymore. After leaving the transition state, the momentum of r1 tends to a constant value as the velocity of the free H atom tends towards constant, getting practically unaffected by the interatomic forces. The oscillating momentum of r2 corresponds to the close-harmonic vibration of the bonding hydrogen atoms.


Changing the initial displacement in a way that r1 = 90.8 pm (transition state distance) and r2 is displaced by 1 pm (91.8 pm) relative to transition state, the simulation shows the same results but with the properties of r1 and r2 'flipped' as now r2 is longer than the transition state distance and atom C will detach.
-

Potential energy trajectory with the initial r1 distance equal to the transition value (90.8 pm), and r2 slightly displaced from that (91.8 pm), with dynamic setup. -

Internuclear distance vs. time plot of this setup. -

Momenta vs. time plot of this setup.


If the parameters are 'reversed' i.e. the position and momentum data of the last step of the previous dynamic simulation are set as initial parameter (the momenta with opposite signs), the resulting path will be the same but reversed. The system will arrive to the previous starting point:
-

Potential energy trajectory with reversed parameters (the ending positions and momenta of the previous simulation): r1 = 73.6, r2 = 581.1, p1 = - 3.195, p2 = - 5.073. -

Internuclear distance vs. time plot of this reverse setup. The interatomic distance plot is the mirror image of the previous system -

Momenta vs. time plot of this reversed setup. the plot is mirrored compared to the original, and the momenta take values of the opposite signs.


Perfect! Visually you can see how your first point alters each graph! Mys18 (talk) 10:18, 26 June 2020 (BST)
Reactive and unreactive trajectories
From certain initial positions and momenta reactive trajectories are achievable. One would assume if there is a reactive trajectory with a certain value of kinetic energy and momenta, increasing the kinetic energy by setting higher initial momentum values (in absolute value), the resulting trajectories would also always be successful as the higher kinetic energy helps to overcome the activation energy barrier faster. However, testing this hypotheses shows different results.
The initial values were the same for each calculation, r1 = AB = 74 pm, r2 = BC = 200 pm. This means the initial potential energy is constant, -433.787 kJ/mol.The kinetic energy moves the total energy towards a more positive value.
| p1 (g mol-1 fs-1) | p2 (g mol-1 fs-1) | Etot (kJ/mol) | Reactive? | Description of dynamics | Illustration |
|---|---|---|---|---|---|
| -2.56 | -5.1 | -414.280 | YES | The system overcomes the activation barrier and a new bond is formed, similarly to simulations above. | 
|
| -3.1 | -4.1 | -420.077 | NO | The system can not reach the activation barrier, it is 'turning back' from the potential hill. The total kinetic energy is lower as indicated by the less positive Etot, and it appears to be too low to overcome the barrier. | 
|
| -3.1 | -5.1 | -413.977 | YES | The barrier has been overcome, similarly to the previous reactive setup, with slightly higher kinetic energy than the previous. | 
|
| -5.1 | -10.1 | -357.277 | NO | The barrier is passed, however, it reverts ('bounced back') and, while atoms B and C came temporarily close together, the potential energy was too high to maintain this bond and the molecule from A and B hydrogens is reformed. | 
|
| -5.1 | -10.6 | -349.477 | YES | The barrier is passed similarly to the previous, r2 is temporarily shorter than r1 then it reverts to r1 < r2 then goes 'forward' again, and r2 becomes shorter once again, now forming the B-C hydrogen molecule in a stable way. | 
|
In conclusion, the total amount of kinetic energy is not the only term determining the outcome. In the first three cases, it can be seen that a certain amount of kinetic energy is necessary. However, in the fourth case, with a steep increase of the momenta therefore the kinetic energy the trajectory wasn't reactive. Slightly adjusting p2 momentum lead to a reactive trajectory again. This was a further increase in kinetic energy therefore it can not be assumed, that there was an upper limit in kinetic energy of the reactive trajectories. The explanation is not only in the magnitude but in the ratio of momenta and kinetic energies: part of the kinetic energy is translated into vibrational motion which is, if too high, prevents the formation of a bond, whereas the energy translated into translational motion does not affect the bond formation. If the gained vibrational kinetic energy is too high, no bond will form until a sufficient amount of vibrational kinetic energy is translated into translational.
:) Mys18 (talk) 10:20, 26 June 2020 (BST)
Transition State Theory vs. experimental reaction rates
Transition State Theory (TST) can be used to obtain the rate constant of bimolecular reactions, such as the H + H2 reaction studied above. TST has several assumptions to predict the rate. One of them is assuming every trajectory that has enough kinetic energy to overcome the activation energy barrier (this kinetic energy is along the reaction coordinate i.e. following the mean energy path length) will lead to the formation of products. These can not return to form reactants, there is no re-crossing of the barrier either way. It is also assumed that in the TS the reaction coordinate may be separated and treated as translational motion. At this point, there is a discrepancy with the experimental/simulation methods: in the table above, the 4th simulation has shown that after passing the activation barrier, the reactants can be reformed from the product; furthermore, a back-and-forth mechanism is possible until the vibrational kinetic energy is reduced sufficiently. It was shown by the same simulations that there is interconversion between translational and vibrational energy. This factor can lead to the overestimation of an experimentally measured rate. Another assumption in TST is using a model based on classical mechanics. This will not account for quantum tunnelling which can also influence the mechanism (especially for small atoms such as hydrogen), and which would be possible to account for by modelling the particles with wavefunctions. As tunnelling provides a lower energy pathway, not accounting for this effect can lead to an underestimation of the rate. However, this is a minor effect compared to the first assumption therefore the rate is more likely to be overestimated overall.
Excellent. I think you mean TST leads to an overestimation of the rate compared to experimentally measured rate (because it does not consider barrier recrossing, but experimentally this can happen - so not a simple Reactants to products). Remember, reference information this is smiled upon.Mys18 (talk) 10:23, 26 June 2020 (BST)
EXERCISE 2: F - H -H system
Potential energy surface inspection
Unlike the H - H - H system, the potential energy surface of the F - H - H system is not symmetric. The potential energy surface has a much deeper well for low H-F and higher H-H distance (the HF + H system) than for the opposite (F + H2) and is therefore thermodynamically more stable. This leads to the conclusion that the F + H2 → HF + H is exothermic as the system is getting into a lower energy state, releasing energy. This also means that the opposite reaction, HF + H → F + H2 will be endothermic. The F-H bond strength is higher than the H-H bond strength, which can be explained in two ways: since the F + H2 → HF + H process is exothermic, and only one bond, H-H is broken and only one, F-H is formed, the new bond must be lower in energy and therefore be stronger than the former. The other approach is by looking at the potential energy surface it can be seen that the HF + H system needs much higher amount of energy to reach the top of the energy barrier, therefore (partially) break the bond than that of H2 + F, therefore the H-F bond is stronger.
Also you can justify the bond strengths using your knowledge of bonding for HF and H2. A step further, search the literature for bond energy values for each and see how that can support your answer. Mys18 (talk) 10:26, 26 June 2020 (BST)
According to Hammond's postulate, the geometry of the transition state will resemble the one from the reactant or product system which is closer in energy. As the H2 + F system is higher in energy than the HF + H, it is expected to be closer to the reaction coordinate energy maximum. This means the transition internuclear distance between the hydrogens will be close to the equilibrium H2 bond length, and the F-H distance will be relatively high. Considering this, and refining the distance parameters towards minimal net forces on the atoms, the transition state positions were found to be r1 = rFH = AB = 181.0 pm and r2 = rHH = BC = 74.49 pm. The potential energy i.e. the transition state energy was obtained to be 433.98 kJ/mol.
Similarly to the H + H2 system, MEP calculations can be run by setting initial coordinates close to the transition state, but with a small offset to either towards the reactants or the products. Regarding this small offset, a HF + H or an F + H2 system will form. As the MEP method excludes vibrational motion by setting nuclear velocities to zero at every step, the trajectory will follow towards the lowest potential energy pathway. This will approach the energy of the reactants or the products depending in which direction the simulation was aimed. The difference between the transition state and these obtained energies can be calculated, and these energy differences are the activation energies of the reactions HF + H → F + H2 and F + H2 → HF + H. The findings are summarised in a table below.
| System (reactants) | r1 = rFH = AB (initial) | r2 = rHH = BC (initial) | Contour plot | Potential energy vs. time | Final potential energy | Activation energy |
|---|---|---|---|---|---|---|
| HF + H | 178.0 pm | 74.49 pm |  |
 |
-560.36 kJ/mol | 126.38 kj/mol |
| F + H2 | 183.0 pm | 74.49 pm |  |
 |
-435.05 kJ/mol | 1.07 kj/mol |
| Comments | The number of steps was set to 5000 and the step size (similarly to every previous calculation) was 0.1 fs for the HF + H system, but the number had to be increased to 7000 and step size to 0.2 fs for F + H2 due to the low gradient of this part of the potential energy surface. | The HF + H system reaches its minimal energy rapidly as the potential gradient is very high whereas the H2 + F system arrives to this state slowly due to the low gradient. |
Values look correct. good job on remembering your units throughout. Mys18 (talk) 10:28, 26 June 2020 (BST)
Reaction dynamics
By setting appropriate initial internuclear distances and momenta a reactive F + H2 → HF + H trajectory can be simulated. In the following example r1 = rFH = AB = 183 pm and r2 = rHH = BC = 76 pm was set for positions and p1 = p(AB) = -1.6 g mol-1 fs-1 and p2 = p(BC) = -1.0 g mol-1 fs-1 for momenta in a dynamic setup. On the contour plot it can be seen that the system starts with some translational and a low amplitude vibrational motion.

These two contribute to the total amount of kinetic energy. Passing the energy barrier and forming the products, the amplitude of the vibration has greatly increased. Looking at the three-dimensional surface plot, it can be seen that the system reaches the approximate 'height' of the energy barrier in these vibrations.

The reason for this is the conservation an conversion of energy. Passing the barrier, the system 'falls down' into the potential well. This means the potential energy is released and converted into kinetic energy. Due to the characteristics of this particular potential energy surface, most of this energy is being converted into vibrational kinetic energy and a smaller amount to translational. This high amount of vibrational energy is expressed in high amplitude (high energy) vibration of the molecule.
This energy conversion can be verified experimentally. In real molecules the levels of vibrational energy are quantised (unlike in the classical model used up to this point), and transition between these levels is possible via excitation (absorption of infrared light with a wavelength corresponding to the energy gap) or relaxation (light emission of the corresponding wavelength). If the molecule gains significant amount of vibrational energy as shown in the previous example, it will get into a vibrational excited state. The proof for the existence of this state can be found by further excitation resulting in infrared absorbance, or by detecting the emitted infrared light during relaxation.
The first technique uses the principles of infrared spectroscopy. According to the Boltzmann-distribution, the majority of the molecules are in their vibrational ground state therefore the E0 → E1 transition will be detected almost exclusively at ambient temperatures, resulting in a single IR-absorption peak corresponding to the vibration of the bond of interest. However, if the molecules follow a similar trajectory described above, many or even most molecules will be in vibrational excited states which means only a small amount will absorb in the frequency of E0 → E1 transition. The molecules in excited state will absorb the light corresponding to the E1 → E2 or higher transitions and vibrational hot band(s) will appear on the spectrum. These have a slightly lower frequency as the energy spacing between the higher vibrational levels decreases due to anharmonicity. After some time the excited molecules undergo relaxation, and the ground state level becomes populated. This will result in increasing intensity of the fundamental, decreasing intensity of the hot bands. The initial ratio, and the rate of change in intensity of the bands reveals information about the dynamics of the reaction. The other technique uses the infrared emission of the vibrational relaxation, called infrared chemiluminescence (IRCL). The intensity of the light emission and the rate of luminescence decay can be used to study the reaction dynamics similarly to the excitation method.
This is an incredibly thorough discussion! Great job. Mys18 (talk) 10:30, 26 June 2020 (BST)
Influence of initial translational and vibrational energy components
In the following simulations trajectories for the F + H2 → HF + H reaction are calculated with various initial momenta of pHH (p(BC)), thus varying mostly the vibrational and partly the translational energy. The other initial parameters, kept unchanged, rHH = BC = 74 pm (equilibrium bond length), rFH = AB = 220 pm, pFH = p(AB) = -1.0 g mol-1pm fs-1. The findings were summarised in the table below.
| pHH (g mol-1pm fs-1) | Reactive? | Comment | |
|---|---|---|---|
| -6.1 | NOT | Unreactive due to double-crossing the TS. The translational motion is faster relative to the vibration than initially. | |
| -6.0 | NOT | Unreactive due to double-crossing the TS. The translational motion is faster relative to the vibration than initially. | |
| -4.8 | YES | The most negative pHH found to lead to reactive trajectory | |
| -4.0 | YES | ||
| -3.9 | NOT | Unreactive due to double-crossing the TS | |
| -3.6 | YES | Reactive without multiple barrier crossing. | |
| -3.3 | NOT | Highest negative pHH found to be crossing the barrier. Unreactive due to double-crossing | |
| 0 | NOT | Unable to cross the barrier. | |
| 2 | NOT | Unable to cross the barrier. | |
| 2.2 | NOT | Lowest positive pHH found to be crossing the barrier. | |
| 3.5 | YES | ||
| 3.6 | NOT | ||
| 4.0 | YES | ||
| 6.0 | NOT | ||
| 6.1 | YES |
According to the results, there is no simple way of telling if the trajectory will be successful just by knowing the magnitude of the pHH, apart from low values where the barrier can't be passed.
The reverse reaction was studied similarly, changing the pHH, thus the translational kinetic energy of the incoming hydrogen. The other, unchanged initial parameters wererFH = r(AB) = 92 pm (around equilibrium), rHH=r(BC) = 175 pm, pHF = -0.5 g mol-1pm fs-1.
| pHH | Reactive? | Contour Plot | Comments |
|---|---|---|---|
| 0 | NOT | 
|
|
| -5 | NOT | 
|
The trajectory moved towards the TS but couldn't reach it. |
| -10 | NOT | 
|
|
| -14.7 | NOT | 
|
|
| -14.8 | YES | 
|
Lowest value found to overcome the barrier. Multiple barrier crossings, but reactive trajectory. High amplitude vibration of the product. |
| -15 | YES | 
|
|
| -16.9 | YES | 
|
Highest value found to lead to reactive trajectory. |
| -18 | NOT | 
|
Hitting high potential value before TS, leading to 'reflection'. Any test above this value lead to the same phenomenon. |
Apparently, there is a certain value of momentum and kinetic energy needed for the hydrogen to hit the HF in order to perform a successful endothermic reaction that seems to be more dependent on the translational energy than the vibrational. After a certain momentum, the energy will be too high to form new bonds. The translational energy does not have to be chosen as precisely as it could be seen for the F + H2 system.
It is possible to achieve reaction with lower incoming translational energy if the HF has high vibrational energy, however, it requires precise aiming to hit the barrier in a sufficient way. Most of the vibrational energy must be in its kinetic and not potential energy form to pass the barrier. An example for this is the following: rFH = r(AB) = 91.43 pm (around equilibrium), rHH=r(BC) = 187.57 pm, pHF = 14.3783 ± 0.0002 g mol-1pm fs-1, pHH = -2.18 g mol-1pm fs-1. It is important to note that the product has a much lower vibrational amplitude therefore less vibrational kinetic energy.

The Polanyi rules provide a relationship between the endo-, and exothermic reactions and their energy consumption during the collision. For exothermic processes, i.e. reactions with early transition state, the translational energy is translated into vibrational in case of reactive trajectory. Higher initial vibrational kinetic energy but lower translational energy is less likely to lead to reaction. For endothermic processes, with late transition state, a high translational energy is needed to cross the barrier, whereas a lower amount of vibrational energy can be sufficient but it needs the vibration to be in the correct phase. It is hard to find obvious agreement between the rules and the simulations of the exothermic system: no matter if the translational energy was high, due to the multiple barrier crossings the trajectory was often unreactive. However, if succeeded, high vibrational kinetic energy was gained, not translational energy which is in agreement with the rules. Also with low translational energies the system could not reach the barrier regardless of the initial vibrational energy. On the endothermic path the system seemed to be less sensitive to multiple crossing and a high, but not too high translational energy led to reaction. The momenta needed to cross this barrier was very high especially compared to the case where high vibrational energy could make the reaction succeed besides rather low translational energy. It is important to note that overcoming the barrier with vibrational energy needed to be precisely in the correct phase. The formed products had low vibrational energy unlike the exothermic path.
Wow. It is clear you have understood Polanyi's rules!Mys18 (talk) 10:33, 26 June 2020 (BST)
References
The following scientific literature was used for this report:
- Steinfeld, J. I., Francisco, J. S., Hase W. L. Chemical Kinetic and Dynamics 2nd ed., Prentice-Hall, 1998.
- Atkins P. and de Paula J. Physical Chemistry 8th ed., W.H.Freeman 2006.
- Polanyi, J.C., Science, Vol. 236, Issue 4802, 1987, pp. 680-690 DOI: 10.1126/science.236.4802.680