
MRD:bibabu
H+H2 system
Running and visualising a trajectory
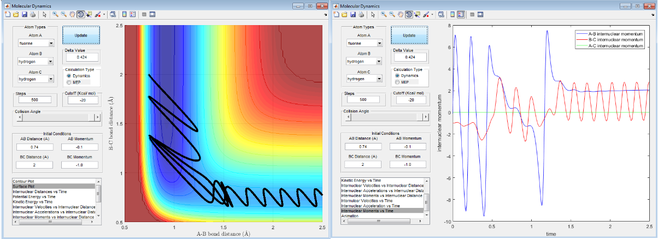
With initial conditions r1 = 0.74, r2= 2.30, p1=0, p2 = -2.7, several plots are reviewed and the following pictures are the screenshots.

(1) The first screenshot is a contour plot of the Potential Energy Surface. It shows a reactive trajectory from HA-HB to HB-HC. It is curly due to vibration of each of the diatomic molecules.
(2)(3) The second and third screenshots are kinetic energy vs time plot and potential energy vs time plot. As the total energy is conserved in the system, the loss of kinetic energy must be transformed to potential energy, and vice versa. The lowest part of kinetic energy vs time graph/the highest part of potential energy vs time graph indicates that the reaction is going through a high-energy transition state.
(4) The last screenshot is a plot of internuclear momentum vs time. The negative value indicates a velocity that decreases the interatomic distance and a positive value indicates the opposite.
Dynamics from the transition state region

- What value does the total gradient of the potential energy surface have at a minimum and at a transition structure? Briefly explain how minima and transition structures can be distinguished using the curvature of the potential energy surface.
The total gradient of the potential energy surface at a minimum is zero and that at a transition structure is also zero. Even though the gradient of both minimum point and transition structure are all zero, they are different points and therefore have different meanings. The minima is the point with the most negative potential energy but transition structure is not. The transition structure is a saddle point, a point where the derivatives of orthogonal function components defining the surface become zero(a stationary point), but is not a local extremum on both axes. Its second derivative is also zero. The saddle point will always occur at a relative minimum along one axial direction and at a relative maximum along the crossing axis. Therefore, the potential energy at transition structure is always less negative than the minima.
(This contrived explanation is a bit hard to follow and can be avoided if you mathematically define the TS using first and second derivatives. The 2nd derivate of the TS is not zero. Je714 (talk) 17:44, 8 May 2017 (BST))
Trajectories from r1=r2
- Report your best estimate of the transition state position (rts) and explain your reasoning illustrating it with a “Internuclear Distances vs Time” screenshot for a relevant trajectory.
The best estimate of the transition state position: HA-HB = HB-HC = 0.9091 A. In this case, the trajectory will oscillate on the ridge and will never fall off. Since a transition state point is a saddle point, the point on the trajectory which has the minimum value(derivation is zero) is the transition state position. The internuclear distance between HA and HB, and that between HB and HC is always the same, with a regular up and down period between 2.0 A and 0.6 A. Since the distance between three atoms does not change overtime, they must be at transition state.

screenshot
 of animation of transition state position, for r1=r2. (2)estimation of transition state position. (3)Internuclear Distance vs Time]
Trajectories from r1=rts+δ, r2=trs
- Comment on how the mep and the trajectory you just calculated differ.


For the screenshots on the left, the top two are the surface plot and the internuclear distance vs time plot for molecules under dynamic calculation, while those at the bottom are the surface plot and the internuclear distance vs time plot for molecules under mep calculation.
[r1(BC)=0.9191 A, r2(AB)=0.9091 A] For both calculations, the trajectories follow the valley floor to HA-HB and HC, but are slightly different.
For mep calculation, HA-HB has a constant bond distance(0.7468 A at 5 s); the bond distance between HB and HC increases but stops at 1.475 A.
For dynamics calculation, HA-HB bond vibrates(0.7276 A at 5 s) and does not have a constant bond distance; the bond distance between HB and HC increases steadily and continuously(18.31 A at 5 s).
For mep calculation, p1(average)=p2(average)=0; for dynamics calculation, 0.8933<p1<1.586,p1(average)=1.24, p2(average)=2.479.
If r1(BC)=0.9091 A, r2(AB)=0.9191 A, the trajectories follow the valley floor to HB-HC and HA. All data are opposite.
Reactive and unreactive trajectories
- Complete the table by adding a column reporting if the trajectory is reactive or unreactive. For each set of initial conditions, provide a screenshot of the trajectory and a small description for what happens along the trajectory
| # | p1 | p2 | reactive or not | description |
|---|---|---|---|---|
| 1 | -1.25 | -2.5 | reactive | From the initial state to the transition state, there is not much of vibration for HA-HB molecule. As HC approaches, it forms bond with HB and HA-HB bond breaks. The new molecules actually undergoes more vibration. |
| 2 | -1.5 | -2.0 | unreactive | The energy of HC is not enough for it to approach close enough to HA-HB molecule. It bounces back when the distance between HC and HB is about 1.1 A. HA-HB molecule vibrates constantly. |
| 3 | -1.5 | -2.5 | reactive | p1 is at the maximum value of the limited reactive range of momentum. This is a standard trajectory of an atom colliding a diatomic molecule. |
| 4 | -2.5 | -5.0 | unreactive | All of the atoms have enough energy to overcome the activation barrier. However, since p1 is very large and HA makes HC to form and break the bond with HB. |
| 5 | -2.5 | -5.2 | reactive | All of the atoms have enough energy to overcome the activation barrier. p2 here is larger than that in 5th condition, HC is then able to kick out HA and forms bond with HB. |

- State what are the main assumptions of Transition State Theory. Given the results you have obtained, how will Transition State Theory predictions for reaction rate values compare with experimental values?
The theory assumes a special type of chemical equilibrium (quasi-equilibrium) between reactants and activated transition state complexes. The theory assumes that each intermediate is long-lived enough to reach a Boltzmann distribution of energies before continuing to the next step in a multi-step reaction. It assumes that unless atoms or molecules collide with enough energy to form the transition structure, then the reaction does not occur. As long as the molecules have energy higher than activation energy, the reaction proceeds. Given the results from the experiment, Transition State Theory is not very reliable as some of the molecules have energy higher than activation energy but unreactive. Transition State Theory predictions for reaction rate values will be larger compared to experimental values. The theory overestimates the probability of reactive reaction, which means it also overestimate the reaction rate. Not all collisions are accessible in reality, so reaction rate will be lower experimentally.
F-H-H system
PES inspection
- Classify the F + H2 and H + HF reactions according to their energetics (endothermic or exothermic). How does this relate to the bond strength of the chemical species involved? Locate the approximate position of the transition state. Report the activation energy for both reactions.
Classification: F+H2 is exothermic reaction and HF+H is endothermic reaction. Bond breaking is endothermic and bond forming is exothermic. HF bond is stronger than H2 bond. If considering the exothermic F+H2 reaction, the energy of forming H-F bond is larger than that of break H-H bond, which means HF bond energy is higher than H2 bond energy.
The approximate position of transition state between HA and HB is 0.75 A and that between HB and F is 1.81 A.
(Proof of this would be needed Je714 (talk) 17:51, 8 May 2017 (BST))
H2 bond energy: 103.9 kcal/mol; HF bond energy: 133.9 kcal/mol.
F+H2: Activation energy is 0.7 kcal/mol.
HF+H: Activation energy is 30.7 kcal/mol.
(How did you get these? Je714 (talk) 17:51, 8 May 2017 (BST))
Reaction dynamics
F+H2 reaction
- Identify a set of initial conditions that results in a reactive trajectory for the F + H2, and look at the “Animation” and “Internuclear Momenta vs Time”

- In light of the fact that energy is conserved, discuss the mechanism of release of the reaction energy. How could this be confirmed experimentally?
Since it's an exothermic reaction, the release of the reaction energy is through transferring heat to the surroundings, and this could be confirmed by using a thermometer to monitor the reaction. The decrease in potential energy is transferred to an increase in kinetic energy, which consists both translational and vibrational kinetic energy. The translation and vibration can be probed by colorimetric methods and IR spectroscopy.
- Setup a calculation starting on the side of the reactants of F + H2, at the bottom of the well rHH = 0.74, with a momentum pFH = -0.5, and explore several values of pHH in the range -3 to 3 (explore values also close to these limits). What do you observe? Note that we pare putting a significant amount of energy (much more than the activation energy) into the system on the H - H vibration.
They are all unreactive trajectories.
- For the same initial position, increase slightly the momentum pFH = -0.8, and considerably reduce the overall energy of the system by reducing the momentum pHH = 0.1. What do you observe now?
It is now a reactive trajectory with low vibrations for reactant H2 and high vibrations for product HF.
H+HF reaction
- Setup initial conditions starting at the bottom of the entry channel, with very low vibrational motion on on the H - F bond, and an arbitrarily high value of pHH above the activation energy (an H atom colliding with a high kinetic energy).Try to obtain a reactive trajectory by decreasing the momentum of the incoming H atom and increasing the energy of the H - F vibration
one reactive trajectory for HC + HBF: HB-F 0.74 A; HB-HC 2.0A; P(HB-F) -0.1; P(HB-HC)-1.0

- Discuss how the distribution of energy between different modes (translation and vibration) affect the efficiency of the reaction, and how this is influenced by the position of the transition state.
If the distribution of energy is higher for vibration, the reaction is more efficient as H+HF is a late-barrier reaction. The stretching of the bond weakens it, resulting in easier cleavage. If the system has more vibrational energy, it is easier to go over the energy barrier. Since the position of the transition state ensembles the state with nearest energy, in this case, it ensembles products F and H2, not the reactants. So if the molecules vibrate more, they look like the transition state more and their energy is closer to the transition energy barrier. If the transition state ensembles reactants, vibrational energy is not that important then because translation can also overcome the energy barrier easily. So for the endothermic reaction, excitation of vibration modes gives higher efficiency to the reaction.