
MRD:bd316
Molecular reaction dynamics of an H2 + H reacting system
In this section the reaction dynamics of the following system, whereby a free hydrogen atom collides with a H2 molecule to form a new H2 molecule and a new free H atom, are considered:

The three atoms HC, HB and HA are constrained to a 180° angle such that a potential energy surface for the reaction may be calculated.2
The dynamics of the potential energy surface plot - the energy minima and transition state region

The trajectory of the reaction follows the path of energy minima. The transition state region is defined as the energy maximum on the path of minimum energy between the reactants and products.
Hydrogen atom A approaches hydrogen molecule BC (starting from the left hand side of figure 1) following the path of the potential energy surface along which ∂(V(rBC))/∂(rBC) = 0. Along this path the value of the gradient ∂(V(rBA))/∂(rBA) gradually increases until it reaches a maximum along the path of minimum energy - this is the transition state region. From the transition state region, the AB bond forms and the hydrogen atom C moves away from H2 molecule AB along the path along the potential energy surface on which ∂(V(rBA))/∂(rBA) = 0. The reaction coordinate continues along this path until it reaches the minimum of the potential energy surface on both axes, at which ∂(V(rBA))/∂(rBA) = ∂(V(rBC))/∂(rBC) = 0, at which point the reaction is complete.
In the transition state region, the potential energy surface has reached a saddle point, which has the minimum potential energy whereby rCB = rBA. In the transition state region, we can consider there to be a third 'axis', running diagonally from the rBC axis to the rBA axis through the saddle point (s), which defines the reaction coordinate (the view along this axis is given in figure 1). At the saddle point ∂(V(s))/∂(s)= 0; this is an energy maximum along the reaction pathway - ∂2(V(s))/∂(s)2 < 0. The 'axis' running orthogonal to the axis s, through the saddle point from the origin (o) also has ∂(V(o))/∂(o)= 0 and is an energy minimum with respect to this axis - ∂2(V(o))/∂(o)2 > 0.1 Taking the second derivative distinguishes the minima and maxima along a given axis.

Determining the geometry of the transition state
Computationally we can use the fact that, in the transition state, rBC = rBA (if this were not the case the potential energy surface in figure 1 would not be symmetrical) to determine the value of rTS. The results of this calculation are illustrated by the plot of rTS vs time in figure 3. When the transition state has zero momentum and the reaction does not proceed, its potential energy fluctuates in the transition state region and the value of rTS oscillates between approximately 0.8 to 1.0 Å.
An enlarged section of the potential energy surface plot (shown in full in figure 1) in figure 4 shows these inter-atomic vibrations. The value of rTS fluctuates because the transition state is able to interconvert between kinetic energy and potential energy, as is illustrated in figure 5. There are three vibrational degrees freedom at the saddle point - one of these corresponds to infinitesimal motion along the reaction path, and the other two are vibrational motion orthogonal to the reaction path (through the saddle point and along the energy minima).1,2
Mm10114 (talk) 17:50, 7 June 2018 (BST) You correctly observe that the TS is somewhere between the values of 0.8 and 1.0 Å. However, there is only one TS at this potential energy surface. And it was the purpose of this exercise to find it. You were supposed to sample different r1=r2 until you find your best estimate. You would be able to tell this when, for example in Figure 5, you would have no oscillation for the distances and there would be no interconversion of the potential-kinetic energies. So, in the end you were supposed to report a single value for r1=r2, with your best estimate for the TS. In your current calculation, if you would increase number of steps significantly, the aggregation of numerical errors would probably result in your trajectory skewing towards reactants/products. With a good estimate for TS that would not happen.
-
 Figure 3: plot of internuclear distance vs time for the transition state
 -
 Figure 4: the transition state region of the potential energy surface showing vibrational excitation of the transition state
 -
 Figure 5: kinetic energy and potential energy vs time for the transition state


Calculating the reaction path
The minimum energy path, or reaction path, is the path that follows the energy minima from the saddle point to the products along a series of infinitesimally small steps - the vibrational degree of freedom mentioned previously (figure 7). At each of these steps, the kinetic energy is removed, such that the reacting system always has the minimum possible potential energy.1 This distinguishes the minimum energy path from the dynamic reaction path (figure 8), which gives a realistic picture of the trajectory that the reacting system will follow, vibrating orthogonally to the reaction path as the reaction coordinate progresses.1
-
 Figure 7: the minimum energy path
 -
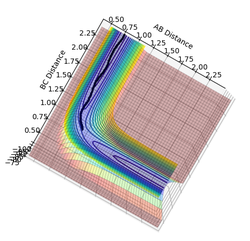 Figure 8: the dynamic reaction path


Figure 9 shows the progression of the values rCB and rBA as the reaction progresses from the transition state region to the products, following the dynamic reaction trajectory. At time zero rCB = rBA = rTS. As HC leaves and the HB-HA bond forms, the value of rCB increases to infinity, and the value of rBA reaches the value of the equilibrium H-H bond length - this fluctuates between values of approximately 0.715 - 0.748 Å, with an average value of approximately 0.726 Å.
Mm10114 (talk) 17:54, 7 June 2018 (BST) Very good observation for the MEP and dynamics calculations differences. However, as you have not given the value for rCB = rBA = rTS in the previous exercise, which value have you used here? Although, it does look on the plots like you're at the transition state, but without a value reported I can't be sure.
The progression of the values of interatomic momentum are shown in figure 10. As the reaction coordinate initially progresses from the transition state the values of both momenta initially increase (figure 11). The value of pCB increases sharply and plateaus at 2.5 when C and B are fully dissociated. The value of pBA first decreases as the HB-HA bond contracts on forming, then reaches the equilibrium value of approximately 1.2, oscillating between 0.95 and 1.53 as the HB-HA bond vibrates.
-
 Figure 9: plot of internuclear distance vs time for the dynamic reacting system
 -
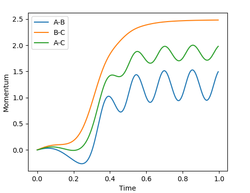 Figure 10: plot of internuclear momentum vs time for the dynamic reacting system
 -
 Figure 11: expanded region of the plot of internuclear momentum vs time for the dynamic reacting system


Reactive and unreactive trajectories
A trajectory may be reactive or unreactive depending on the values of pCB and pBA, which determine the kinetic energy with which the constituent species collide; they must have sufficient total energy to overcome the activation energy barrier and pass through the transition state region to the products. The reactivities of a series of trajectories of varying initial values of the momenta are compared below.
| Trajectory | pCB | pBA | Total energy (kJ mol-1) | Reactivity | Plot | Comment |
|---|---|---|---|---|---|---|
| 1 | -1.25 | -2.5 | -99.1 | Reactive |  |
The reacting system has sufficient energy to pass over the transition state region. The products HC + HBHA are formed and the resultant HBHA molecule shows a greater degree of vibrational excitation relative to the HCHB molecule. |
| 2 | -1.5 | -2.0 | -100.4 | Unreactive |  |
The reacting system has insufficient energy to pass over the transition state region. |
| 3 | -1.5 | -2.5 | -99.0 | Reactive |  |
The reacting system has sufficient energy to pass over the transition state region. The resultant HBHC molecule shows a greater degree of vibrational excitation than that resulting from trajectory 1 because of the greater initial value of pCB. |
| 4 | -2.5 | -5.0 | -85.0 | Unreactive |  |
The species collide with a great deal of kinetic energy - the activation barrier is passed and re-passed, because the initially formed products HC + HB-HA have such a high degree of vibrational excitation that they recollide with sufficient kinetic energy to re-form the reactants. |
| 5 | -2.5 | -5.2 | -83.4 | Reactive |  |
The reacting species collide with even greater kinetic energy than in trajectory 4 - the activation barrier is crossed, re-crossed and crossed again, until the product species are formed with internuclear momenta such they do not re-collide. |
Mm10114 (talk) 17:55, 7 June 2018 (BST) Good observations. For the reported total energies, are these the values taken directly from the LepsGUI? If yes, are you sure the unit is kJ mol-1?
Using transition state theory to predict rates of reaction
Transition state theory provides a means of predicting the rate constant for a given reaction that passes through a transition state, based on the concepts of statistical thermodynamics.3 It is assumed that the reactants are in rapid equilibrium with the transition state complex; the products are formed when this complex decays in to the products. Upon further calculation, the rate constant of reaction is given by the Eyring equation:3

In which kr is the reaction rate, κ is a proportionality constant between the rate of passage of the reacting system through the transition state and the vibration frequency of the reacting system along the reaction coordinate, k is the Botzmann constant, h is Planck's constant, T is the temperature and K-barcǂ is the rate of formation of the transition state.3 K-barcǂ may be determined from the partition functions of the reactants and products, which are themselves easily calculated spectroscopically. The subscript c denotes that the the motion along the reaction coordinate has been separated from the other modes of motion of the species (equivalent to the Born-Oppenheimer approximation) and treated entirely classically.1,3
In calculating the rate constant using transition state theory, three main assumptions are made:4
1. That the reacting species are in equilibrium with the transition state complex, as mentioned previously - this allows the rate constant to be determined using statistical thermodynamics expressions in which partition functions appear (is is assumed that the 'phase space' of the reactants is populated according to the Boltzmann distribution), which are derived with the assumption of equilibrium.
2. That the system can be described adequately with classical mechanics.
3. That systems which pass the transition state barrier always become products.
Each of these assumptions may cause deviations of the calculated rate constants from the experimentally determined rate constants to different extents, depending on the reality of the system considered. For our reacting system in which the molecules may repass the transition state region when they collide with sufficient kinetic energy, as in trajectory 4 in the table above, assumption three may lead to marked deviations between the experimental and calculated rate constants. Assumption two neglects the possibility of quantum tunneling over the activation barrier, underestimating the rate of reaction - as yet there is no transition state theory model that successfully takes quantum mechanical effects in to account.1,3
Mm10114 (talk) 17:57, 7 June 2018 (BST) Well explained.
Molecular reaction dynamics of an F - H - H reacting system
In this section the dynamics of the following, slightly more complex, reaction between a free flourine atom and an H2 molecule are considered:

Inspection of the potential energy surface


The reaction is exothermic in the F + H2 --> FH + H direction, because the products are lower in energy than the reactants, and endothermic in the reverse direction (figure 12a). This indicates the greater bond strength of the H-F bond relative to the H-H bond - this is confirmed by literature values.5
The activation energy of the F + H2 reaction is small - this makes the transition state difficult to locate by eye alone. Hammond's postulate states that the transition state will have the geometry closest to the species (reactants or products) that are closest in energy.6 The location of the transition state for the exothermic F + H2 reaction will therefore most closely resemble the geometry of the reactants. The location of the transition state can be found by starting from the F-H-H geometry with the H-H bond length and optimising until the potential energy surface no longer shows a trajectory with zero internuclear momentum - the location of the transition state is given in figure 13. The transition state complex obtained by this method has an F-H bond length of 1.813 Å and an H-H bond length of 0.741 Å.
Calculating the activation energies
The activation energy is defined as the difference in energy between the reactants and the transition state, i.e. the minimum energy that the reactants must have in order to react. Comparison of the energy of the transition state (-103.5 kJ mol-1) with the minimum energy of the reacting species (-133.3 kJ mol-1) gives a value of 29.8 kJ mol-1 for the activation energy of the endothermic H + HF --> F + H2 reaction. The minimum energy of H2 was found to be -104.3 kJ mol-1, hence the activation energy in the exothermic direction is 0.8 kJ mol -1.
Mm10114 (talk) 17:59, 7 June 2018 (BST) This is good. However, the unit of energy you report here is wrong. It is kcal/mol. This might be a very honest mistake. However, in the future, if you're not certain please try to confirm with any of the demonstrators.
Energetics of the reacting system
According to the first law of thermodynamics, it is not possible for energy to be created or destroyed.3 Hence, when reactants collide with insufficient energy to reach the transition state they may not react (quantum mechanical possibilities aside), and when they collide with more than sufficient energy to react, the excess energy of reaction must 'go somewhere'. This excess energy may be dissipated as heat (random motion, which results in an increase in temperature), or stored in one of the molecules translational, vibrational, rotational or electronic modes of energy (excited electronic modes are typically thermally inaccessible). The amount of energy which is dissipated as heat relative to the amount which is stored in a given species' energetic modes is determined by how many energetic modes the species has available - this is the 'heat capacity'.
This is seen in figure 12 and in many of the reactive trajectories in the previous section, where the reactive trajectory oscillates to a greater extent orthogonal to the reaction coordinate after passing the transition state region, because some of the excess energy is converted to vibrational energy of the products.3 This is also clearly illustrated in figure 14, in which it can be seen that the internuculear momentum in the product H-F molecule oscillates to a significantly greater extent than in the reactant H2 molecule because there is more energy in the H-F vibrational modes.
Calorimetry may be used to experimentally measure the flow of heat resulting from an exothermic reaction, and from the difference in this value, the activation energy and the energy of the reactants the amount of energy stored in the reacting species' energetic modes may be deduced.3
Polanyi's empirical rules
The energy that contributes to a reacting system's ability to pass an activation barrier on collision may be stored in the colliding species' vibrational, translational, rotational or electronic modes, as mentioned previously. Polanyi's rules describe the relative efficacy of energy stored in translational and vibrational modes in allowing a reacting system to pass the energy barrier on collision. These state that vibrational energy is likely to be more efficient in supporting an endothermic reaction (i.e. one with a late-stage transition state resembling the products, according to Hammond's postulate), an example of which is the H + HF reaction, and that translational energy is likely to be more efficient in supporting an exothermic reaction, an example of which is the F + H2 reaction.7
An example of a successful reactive H + HF trajectory with a high initial value of H-F vibrational energy is given in figures 15 and 16 below; figures 17 and 18 show an unreactive trajectory with a lower initial value of H-F vibrational energy and a higher value for the translational energy of the colliding hydrogen atom. This demonstrates the effect described by Polanyi's rules. However, these relative values are approximate, and it is not possible to predict with certainty the reactivity of a given trajectory based on the relative amounts of vibrational and translational energy.7
-
 Figure 15: potential energy surface of an H + HF reactive trajectory
 -
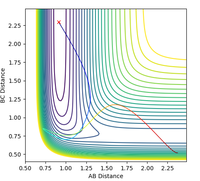 Figure 16: contour plot of an H + HF reactive trajectory
 -
 Figure 17: potential energy surface of an unreactive H + HF trajectory
 -
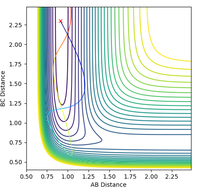 Figure 18: contour plot of an unreactive H + HF trajectory


References
1. Steinfeld, J.I., Francisco, J.S., Hase, W.L., Chemical Kinetics and Dynamics, Prentice Hall, 1989
2. Pilling, M. J., Seakins, P. W., Reaction Kinetics, Oxford University Press, 1995
3. Atkins, P. W., Atkins' Physical Chemistry, Oxford University Press, 2014
4. Mahan, B. H., J. Chem. Educ., Activated Complex Theory of Bimolecular Reactions, University of California, 1974
5. Polanyi, J. C., Tardy, D. C., J. Chem. Phys., Energy Distribution in the Exothermic Reaction F+ H2 and the Endothermic Reaction HF + H, 1969
6. IUPAC, Compendium of Chemical Terminology, 2nd ed. (the "Gold Book"), compiled by A. D. McNaught and A. Wilkinson, Blackwell Scientific Publications, Oxford, 1997
7. Zhang, Z., Zhou, Y., Zhang, D.H, Czakó, G., Bowman, J., J. Phys. Chem. Lett., Theoretical Study of the Validity of the Polanyi Rules for the Late Barrier Cl + CHD3 Reaction, 2012