MRD:bc2116
Molecular Reaction Dynamics: Boru Chen
+ H system
Dynamics from Transition State Region
The PES has two components:
and
Where V is the potential energy, and is the intermolecular distance between , is the intermolecular distance between and . At transition structure, both components have value of zero. At energy minima and transition structure, their first derivatives equal to zero. Transition state can be distinguished by taking the second derivative of potential energy. Transition state is at energy maximum along reaction coordinate, and at energy minimum in any other direction, whereas energy minimum is at a minimum in all directions. Mathematically speaking, energy minimum’s second derivative is always a positive value at any position, whereas transition state’s second derivative is negative along reaction coordinate, and positive everywhere else.
(Almost perfect! You need to make sure to say second partial derivative though. Fjs113 (talk) 22:32, 9 June 2018 (BST))
Transition State Position Estimation
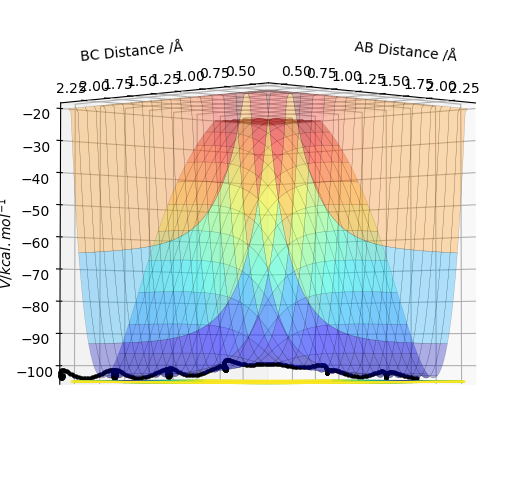
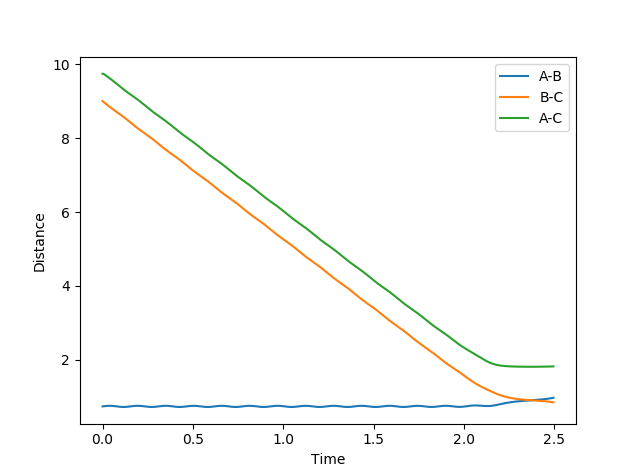
Best estimate = 0.9075 Armstrong. Inter nuclear distance vs time plot
Note: A-B line can be vaguely seen behind the yellow line.
(Ok, but how did you arrive at this value? Fjs113 (talk) 22:32, 9 June 2018 (BST))
MEP Model
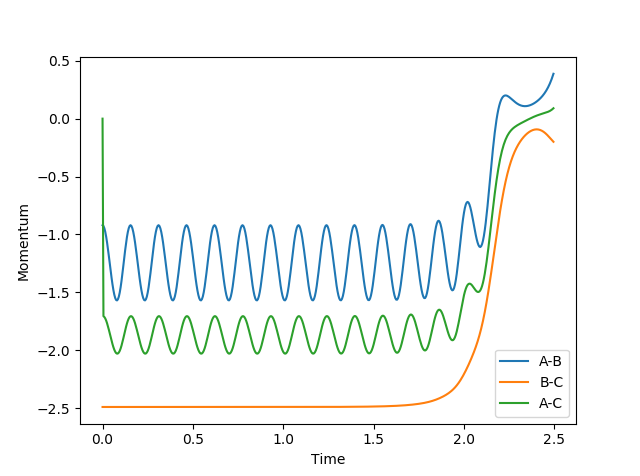
In MEP model, internuclear momentum remains constant, BC distance increases slowly and AB distance decreases slowly. This is because in MEP model, velocity is equated to 0 after every calculation. This means despite the fact that atoms should be accelerating as it picks up kinetic energy, its velocity is kept constant, hence its momentum is kept constant.
(Velocity is actually always 0 as you can see from your momentum plot. Fjs113 (talk) 22:32, 9 June 2018 (BST))
Dynamic Model
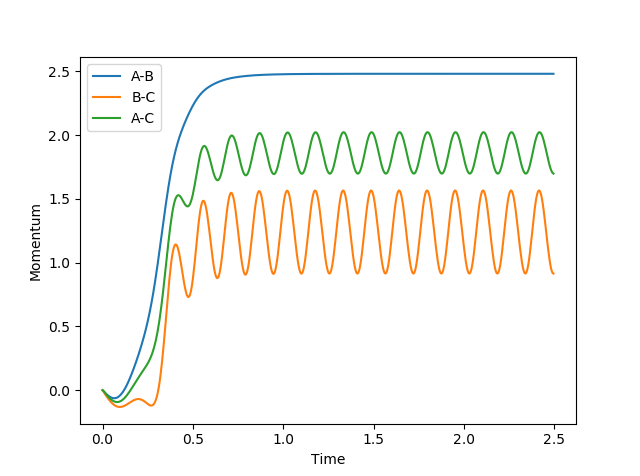
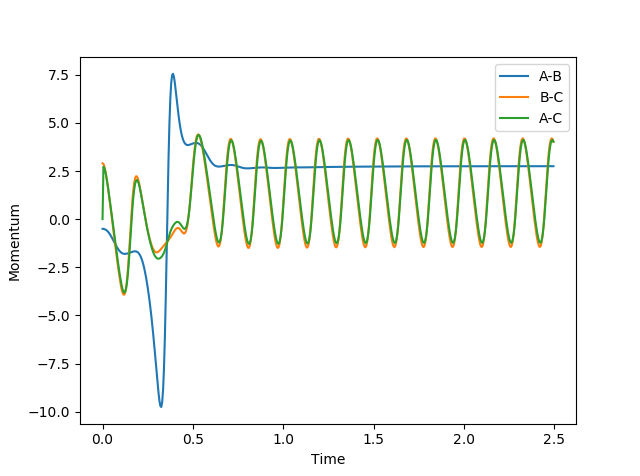
In this model, as distance between BC increase, and BC momentum increases with an increasing rate. This is because as reaction goes from transition state to AB, potential energy in transition state is released as kinetic energy. Since the system is isolated, this kinetic energy is captured by C, and it begins to accelerate. Since momentum is proportional to velocity, BC momentum increases.
AB momentum experiences periodic fluctuation after collision, because it is expressing the extra kinetic energy as vibrational energy between A and B.
MEP calculations with different initial conditions
(Why does this say MEP? These calculations are clearly not MEP. Fjs113 (talk) 22:32, 9 June 2018 (BST))
1. If we changed the initial conditions (reverse)?
In this scenario, transition state structure rolls back to BC + A structure. As distance between AB increase, and AB momentum increases with an increasing rate. This is because as reaction goes from transition state to BC, potential energy in transition state is released as kinetic energy. Since the system is isolated, this kinetic energy is captured by A, and it begins to accelerate. Since momentum is proportional to velocity, AB momentum increases.
BC momentum experiences periodic fluctuation after collision, because it is expressing the extra kinetic energy as vibrational energy between B and C.
2. If the new initial positions correspond to the final positions above and final momenta values but with their signs reversed?
AB moves towards to and stops at transition state. AB distance is kept constant as BC distance decreases. AB momentum fluctuates periodically as it is vibrating. BC momentum is kept constant then experience sudden increase as it accelerates up the potential energy hill to reach transition state.
Reactive and Unreactive Trajectories Table
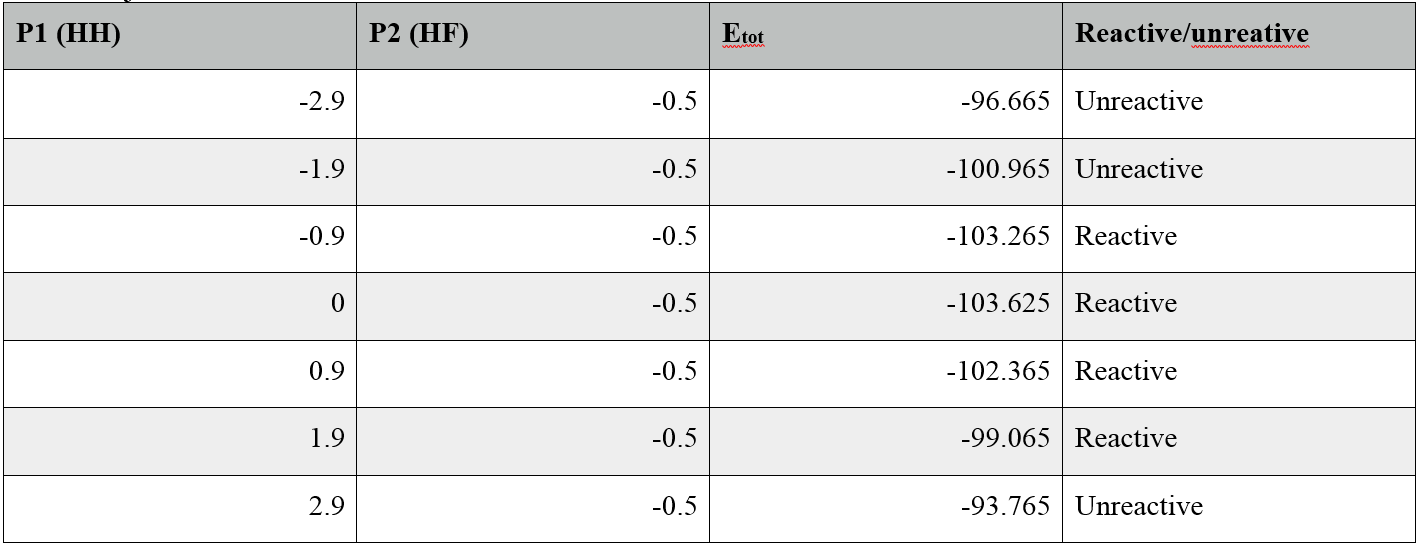
The main assumption is if the incoming atom has enough kinetic energy to overcome kinetic barrier, the reaction will occur. This model also assumes atoms follow newtonian physics.
(You need to elaborate more here. This is a very lacklustre answer. Fjs113 (talk) 22:32, 9 June 2018 (BST))
F + H + H System
PES Report
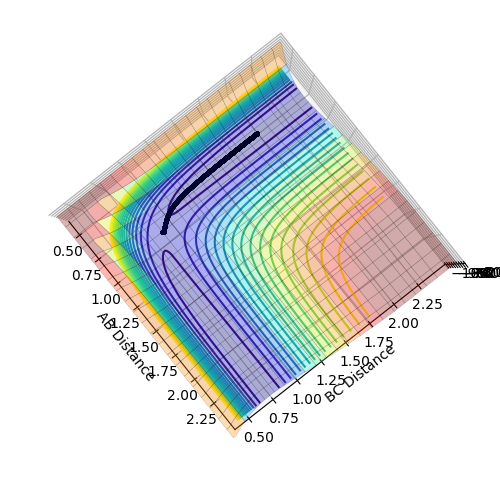
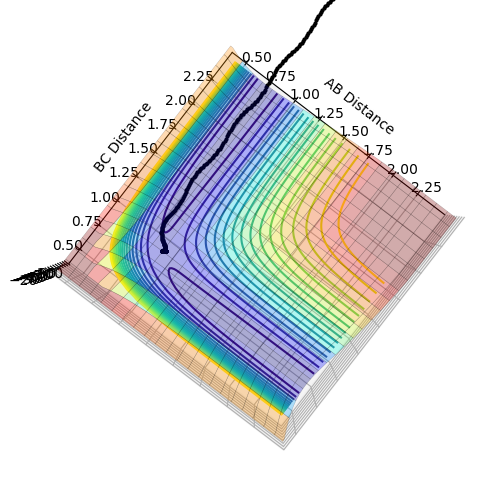
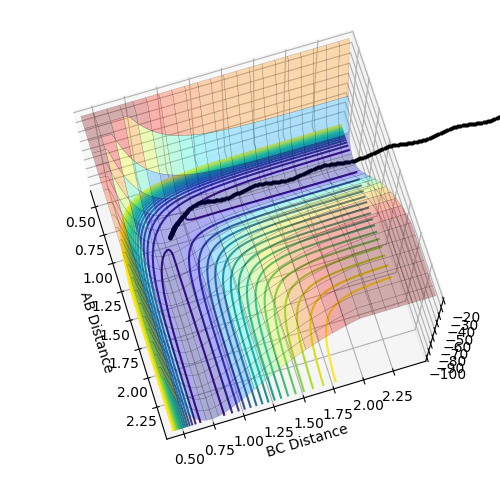
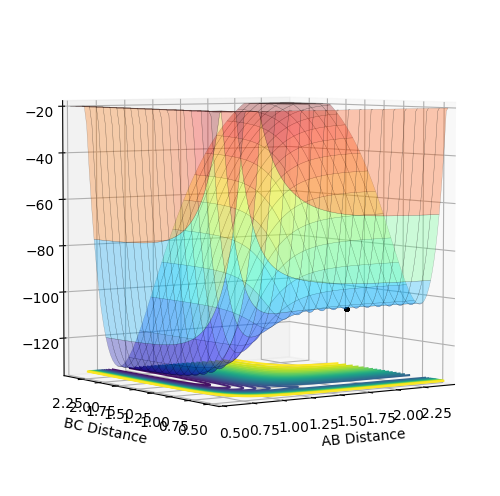
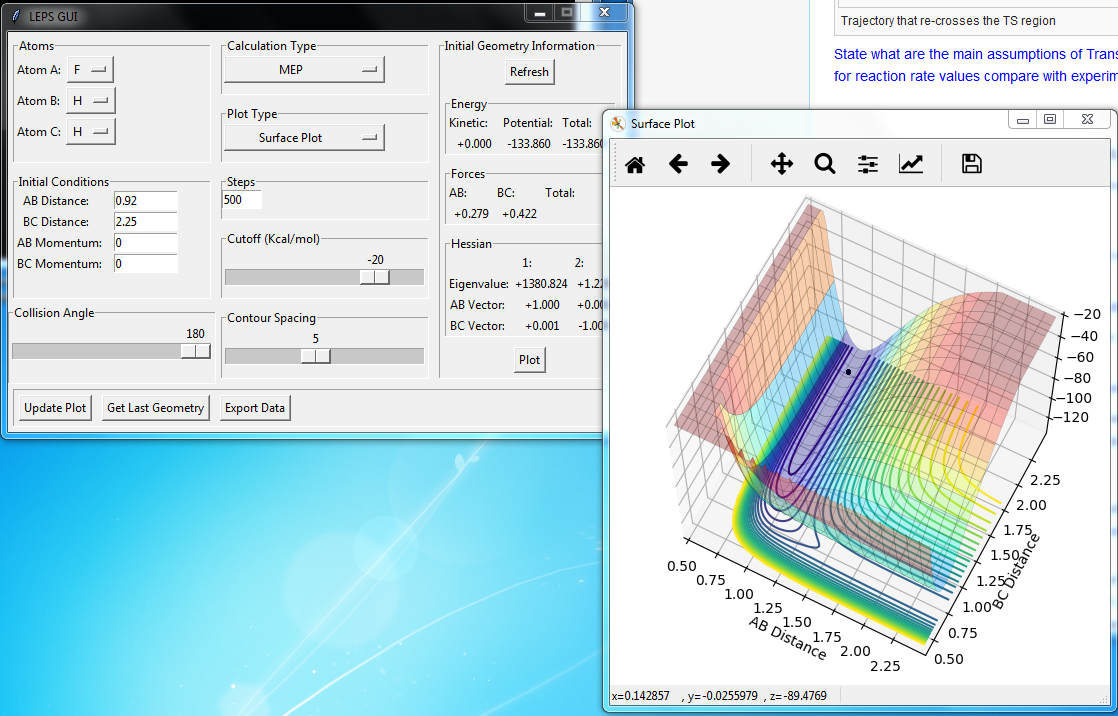
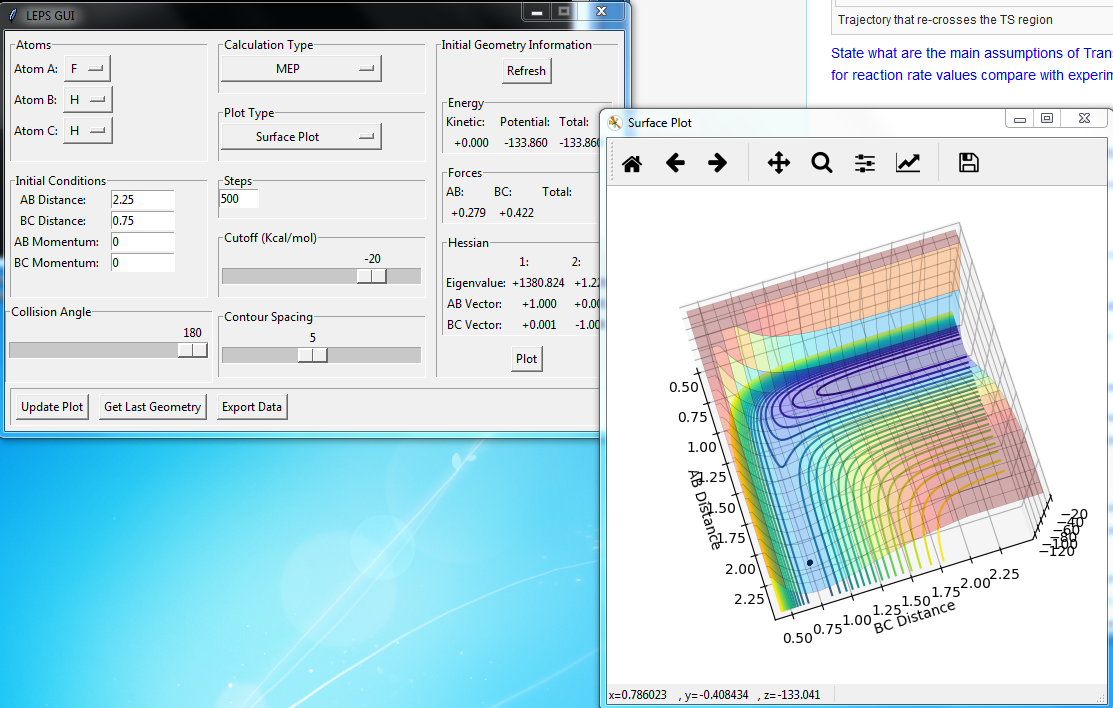
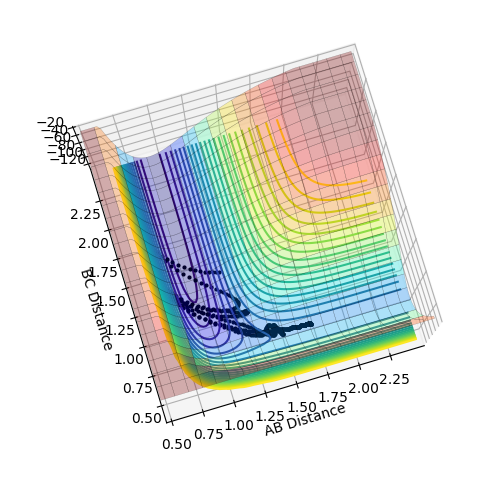
Plot above illustrate reaction H + H + F system potential energy surface, where A = F, B = H and C = H. Graph shows that HH appears to be deeper in energy valley, hence HH formation is exothermic, and HF formation is endothermic.
Position of transition state
HH distance 1.812 A
HF distance 0.744 A (Again, how did you get these values? Fjs113 (talk) 22:32, 9 June 2018 (BST))
Activation energy calculation:
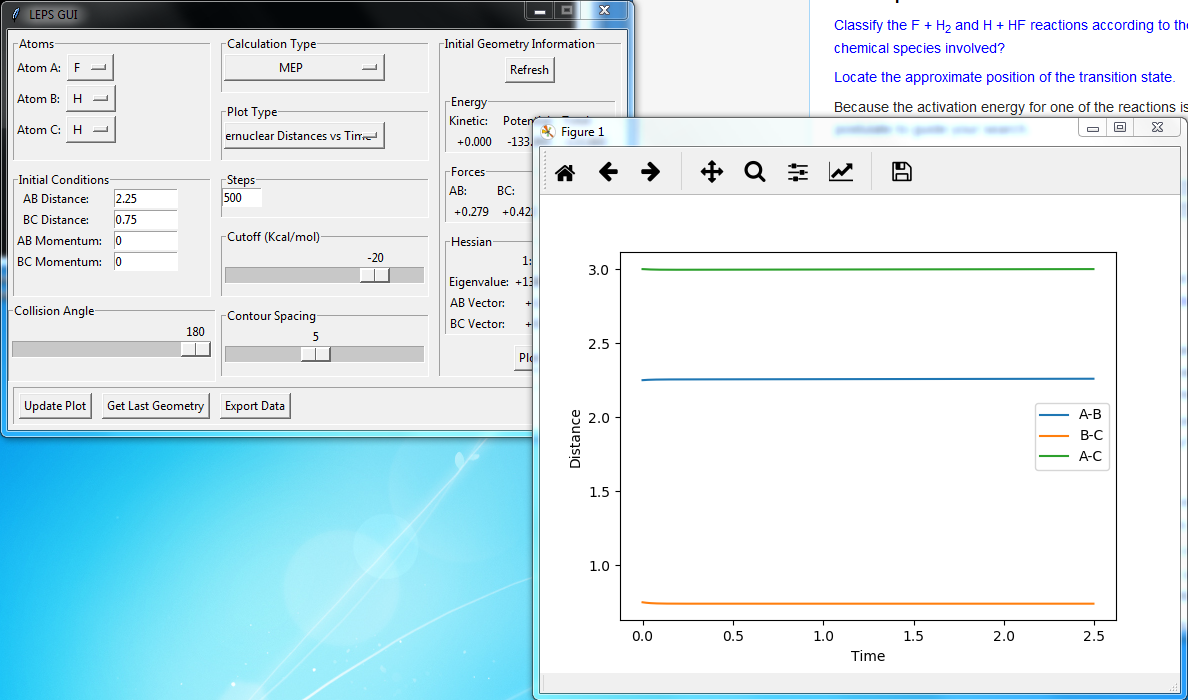
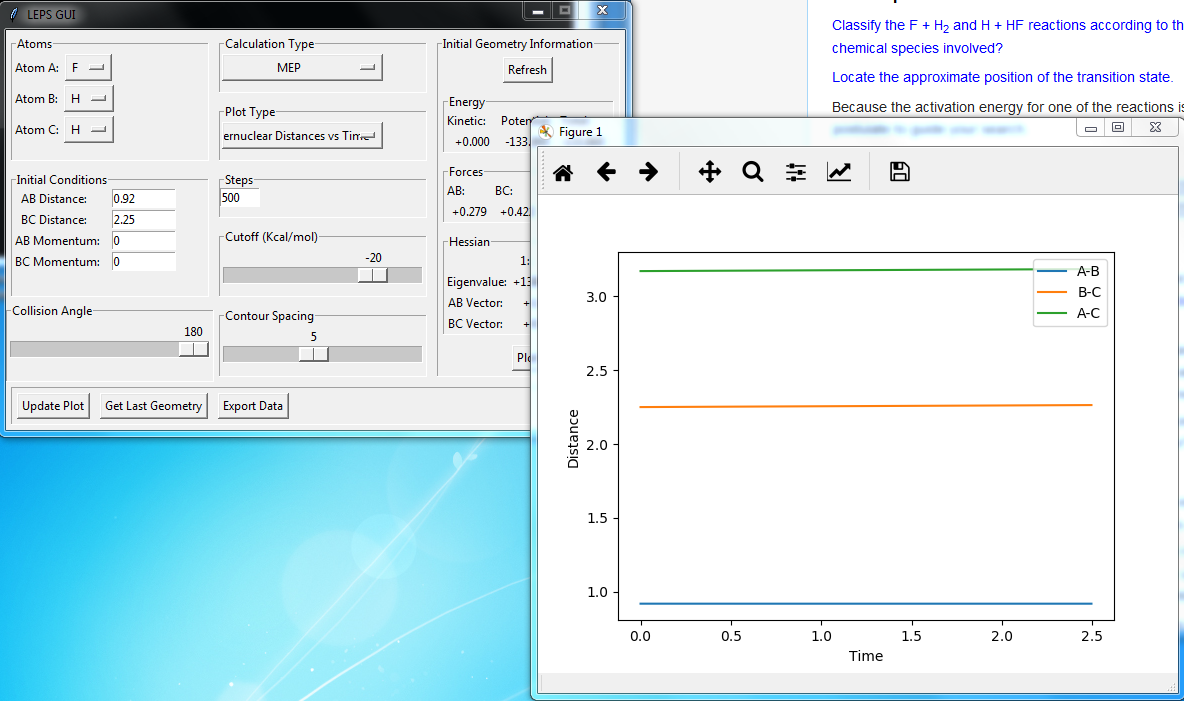
Positions of these structures were estimated using MEP plot
Transition state potential energy: -103.749
H2 potential energy: -133.871
HF potential energy: -103.837
HF + H activation energy = -103.749 - -103.837 = 0.088
HH + F activation energy = -103.749 - -133.871 = 30.122
Reaction Dynamics
Energy conservation
Model sets reaction as an isolated system, and all atoms obey newtonian laws of physics. Once atom moves downhill, the potential energy is converted into kinetic energy, and is released as vibration of bonds. Temperature is directly proportional to the kinetic energy molecules have, hence as reaction progress, temperature of system would rise. This can be measured by calorimetry experimentally.
Trajectories table
During the collision, HH momentum has relatively a small change in comparison with HF momentum After the collision, if the trajectory is reactive, HH momentum will have none to small fluctuation, vice versa for HF momentum. If the trajectory is unreactive, HH momentum will have very large fluctuation, vice versa for HF momentum.
If pHH = 0.1 and pHF = -0.8, HH momentum has small periodic fluctuations and HF momentum has large periodic fluctuations.
(You're missing a few questions at the end! Overall, this is not a good report. You did not explain most of what you did. Fjs113 (talk) 22:32, 9 June 2018 (BST))


