MRD:balu
Molecular Reaction Dynamics: Applications to Triatomic systems
H2 + H
Potential Energy Surfaces
What value do the different components of the gradient of the potential energy surface have at a minimum and at a transition structure? Briefly explain how minima and transition structures can be distinguished using the curvature of the potential energy surface?
A minimum or maximum is dependent on two variables, being the distance between A and B, and B and C. If the derivative with respect to both variables is '0' a point of inflection is observed.
The transition state occurs at a saddle point where the minimum energy path way is at a maximum. Therefore, both variables have to differentiate to '0' with one of them resembling a maximum and the other a minimum. If the second order partial derivative of both variables is below 0 a saddle point has been found[1].
Thus, following conditions need to be satisfied:
∂f/∂x=0, ∂f/∂y=0 and fxxfyy-(fxy)^2 < 0
Report your best estimate of the transition state position (rts) and explain your reasoning illustrating it with a “Internuclear Distances vs Time” plot for a relevant trajectory.
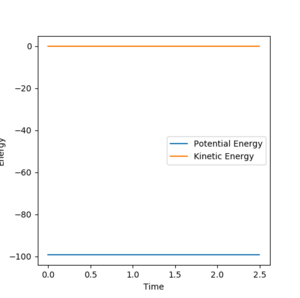
All atoms are roughly 0.9 Å away from each other in the transition state. Improving upon that value yielded an optimised distance of 0.90775 Å. If both bond distances are set to that value with no momentum between them, none of the atoms have the energy required to escape the transition state.
The graph below illustrates that quite nicely as the normally oscillating plot representing the position of the atoms now resembles a straight line, where all energy is saved up as potential energy with no kinetic movement.
Comment on how the mep and the trajectory you just calculated differ.
By using a minimum energy path (mep) calculation instead of a dynamic one the inertia of the individual atoms is taken out of the equation leading to a smooth curve instead of an oscillating one. This can be seen in the plot below.
For the mep the trajectories of r1 r2 diverge much less abruptly than the trajectories of the dynamically calculated steps.
Plots comparing the two modi of calculating the reaction
Contour Plots
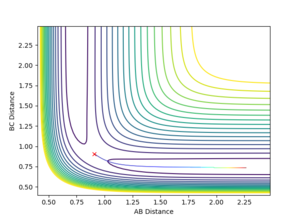
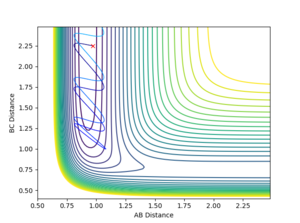
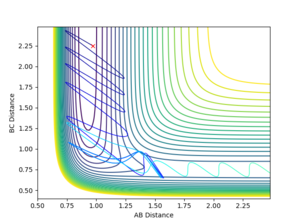
The mep calculated curve is much shorter due to the resetting of the velocity of the atoms to zero at each step, thus removing any inertia on the atoms on each step. This way the atoms move much slower relatively
Intermolecular distance
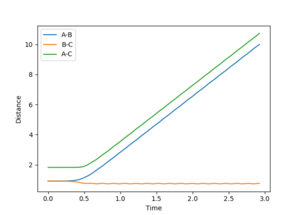
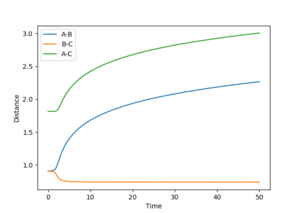
No oscillating behaviour is witnessed in the mep plot for the same reasons as above. The mep plot also exhibits a plateauing behaviour after an initially quick separation of A and B and the concomitant approaching of B and C. This is due to an early repulsion and attraction that does not exist at sufficient distance anymore and due to the resetting of the velocity both of these graphs will slowly peter out.
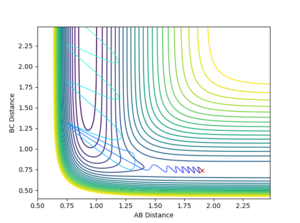
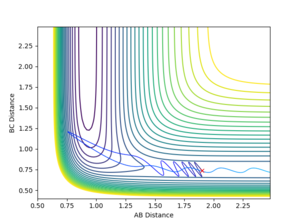
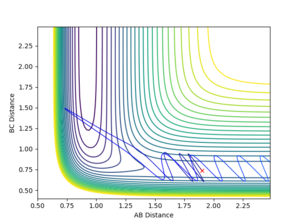
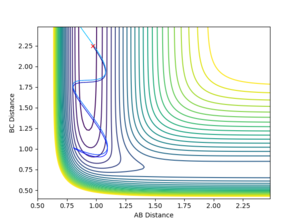
Complete the table by adding a column with the total energy, and another column reporting if the trajectory is reactive or unreactive. For each set of initial conditions, provide a plot of the trajectory and a small description for what happens along the trajectory.
- For the initial positions r1 = 0.74 Å and r2 = 2.0 Å, run trajectories with the following momenta combination:
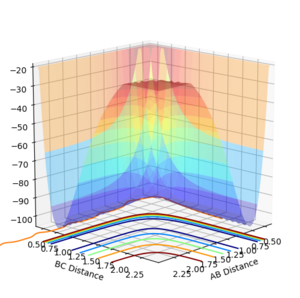
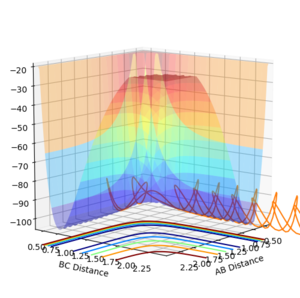
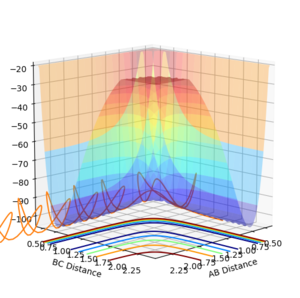
Jas213 (talk) 01:19, 29 May 2018 (BST) An overall concluding comment would have been expected. Also you could have commented on the amount of vibrational energy in each case, the wiggly or straight lines are not very obvious in the perspective of the surface plot shown.
State what are the main assumptions of Transition State Theory. Given the results you have obtained, how will Transition State Theory predictions for reaction rate values compare with experimental values?
As illustrated above the transition state is essentially the watershed at which the product is formed. In Transition State Theory This marks the point of no return for the reactants and separates the reaction into two distinct spaces.
Transition State Theory (TST) is built on three Assumptions[2]:
- The activated complex is in thermal equilibrium with the reactants at a fixed temperature.
- The reactants along the reaction path-way behave classically.
- The reaction proceeds via the lowest energy pathway, represented by the transition state, on the PES.
This is a theory that tries to explain rate of reaction but its predicted rate can deviate from reality as reactants can revert back to the reactants even if they collided "successfully". This opposes the classical view suggested by TST as in a classical chemistry any colliding reactants with sufficient energy will form a product and stay there. This can be seen in the 4th modeled system above. Another aspect contradicting the classical view is that molecules can technically tunnel, thus "bypassing" the reaction barrier or rather not completely going all the way up the reaction path-way, instead taking a short-cut.
Ignoring these effects leads to a higher predicted rate than is observed.
H2 + F
Classify the F + H2 and H + HF reactions according to their energetics (endothermic or exothermic). How does this relate to the bond strength of the chemical species involved?
The reaction between dihydrogen and Flurine (H2 + F ⇌ HF + F) is exothermic meaning that the formed bonds (F-H) are stronger than the bonds broken (H-H)[3]. The reaction being in equilibrium means that the backwards reaction is endothermic. This is supported by the literature values of the respective bonds formed: F-H's ΔHf= ; and H-H's ΔHf=
Jas213 (talk) 01:20, 29 May 2018 (BST) You forgot to finish your sentence and look up the bond energies. Otherwise you could have described the difference in energy between the channels on the surface plot.
Locate the approximate position of the transition state.
The transition state is observed at an AB distance of 1.81 Å and a BC distance of 0.7455 Å, where A=Fluorine, and B and C the two Hydrogen atoms respectively.
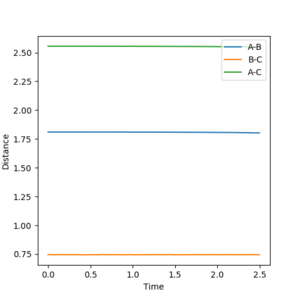
Jas213 (talk) 01:21, 29 May 2018 (BST) How did you find this TS?
Report the activation energy for both reactions.
F + H2 ⇌ HF + F
As the forwards reaction is an exothermic one the transition state most resembles the reactants (lit.). To determine the activation energy the bond distance between A (Fluorine) and B (Hydrogen1) needs to be slightly increased. The next highest decimal was chosen such that AB bond distance was 1.90 Å. The BC bond distance remained constant at 0.7455 Å. The total energy of the products at that bond distance was -103.763 kcalmol-1. The energy of the transition state equals -103.752 kcalmol-1. Hence, the Activation Energy (Ea after subtracting the product energy (Ep) from the transition state energy (Ets) equals:
Ea= Ep-Ep = -103.752 - (-103.763) = 0.011 (kcalmol-1)
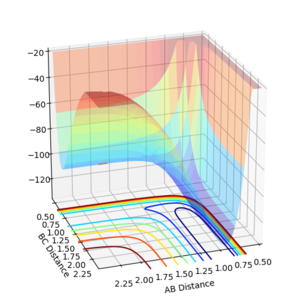
Conversely, to determine the activation energy of the backwards reaction the bond distance AB needs to be decreased, since the transition state now mostly resembles the products. An AB bond distance of 1.72 was chosen. The BC bond remained constant at 0.7455 Å. At that bond distance the product energy equals -133.467 kcalmol-1.
Ea= Ep-Ep = -103.752 - (-133.467) = 29.751 (kcalmol-1)
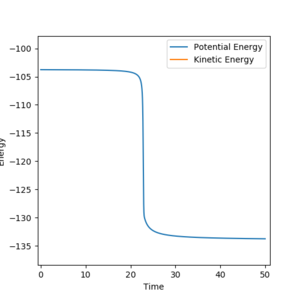
In light of the fact that energy is conserved, discuss the mechanism of release of the reaction energy. How could this be confirmed experimentally?
The reaction between H2 and F was analysed. Momentum was reintroduced to find a successful reaction pathway. The bond distances taken were the ones from investigating the Activation Energy of the forward reaction, i.e. the distance between A (Fluorine) and B (Hydrogen1) was 1.9 Å, whereas the distance between B (Hydrogen1) and C (Hydrogen2) was 0.7455. The momentum, p1, - i.e. between A and B - was -1.5, whereas p2 (between B and C) was increased to 0.5. The calculation type chosen was Dynamics.


Figure 8 illustrates the reaction going to completion. Noticeable is the continuing oscillation in the AB bond.
As can be seen in Figure 9 above the Energy released in the bond formation manifests itself in the oscillation of the atoms.
Discuss how the distribution of energy between different modes (translation and vibration) affect the efficiency of the reaction, and how this is influenced by the position of the transition state.
Forward Reaction
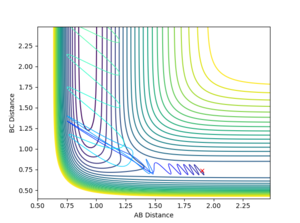
The AB distance was 1.90 Å and the BC distance 0.74 Å. The blue line represents the reaction the more it changes colour the further the reaction has proceeded.
The sweet spot of momenta seems to be between -1.5 and 1.5. In that area the molecules have a sufficient momentum to form the products but not too much to "bounce back" and revert to the reactants.
| p1 | p2 | Reactivity | Plot | Description | |
|---|---|---|---|---|---|
| 1 | -0.8 | 0.1 | reactive | 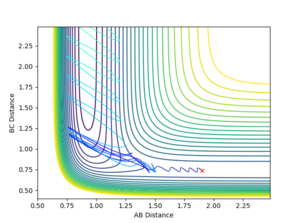 |
After considerable looping the reaction the reaction successfully proceeds. |
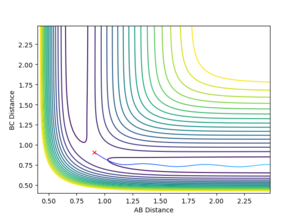
At considerably reduced energy the reaction needs some time to successfully form the products. To get there the reaction crosses the transition state multiple times. Reaction 3 in the table above is quite comparable in Energy and thus also shape of the contour plot.
Backward Reaction
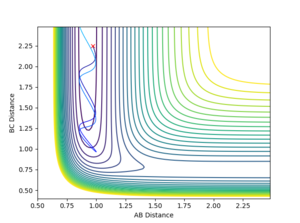
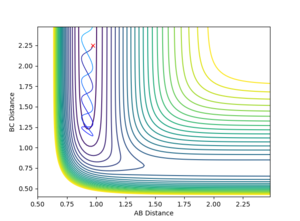
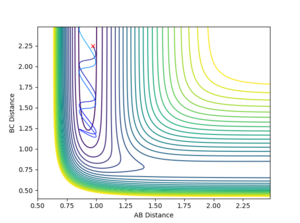
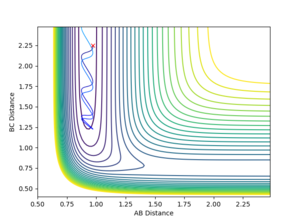
The distance between A and B is 0.97. Between B and C 2.25. The blue line represents the reaction the more it changes colour the further the reaction has proceeded.
The AB bond needs to oscillate quite strongly (high p1) and the approach of C cannot be too fast (small p2) for the reaction to proceed successfully. Thus, the observations agree with Polanyi's empirical rules.
Polanyi's empirical rules
Polanyi's empirical rules consider the effect of two modes of energy distribution on the transition state of molecules in a reaction: translational and vibrational[4]. They state that for a reaction with an early transition state (exothermic) translational energy is more effective at promoting said transition, whereas vibrational energy promotes a later transition state (endothermic), i.e. for the forward reaction translational energy would have made the biggest difference in promoting the successful crossing of the transition state - the reverse is true for the backwards reaction.
With reference to the plots above it would suggest that an initially high momentum of the starting material makes the backwards reaction more reactive whereas if the momentum between the reagents were too high the reaction would break down into the initial reagents again. Conversely, for the forward (exothermic) reaction a high relative momentum between the reagents is required to successfully form the products. Compare Reaction 2 for an illustrative example of the forward reaction needing high translational energy energy and Reaction 9 of the backward reaction for an example of a reaction needing high vibrational energy.
References
- ↑ The potential energy surface for the F+H2 reaction as a function of bond angle in the saddle point vicinity, J. Chem. Phys., D. Schwenke et al., DOI: 10.1063/1.449929
- ↑ Chemical Kinetics and Dynamics (Second Edition), J. Seinfeld et al., p.289
- ↑ Quantitative Hammond Postulate, J. Amer. Chem. Soc., N. Amgmon., DOI: 10.1039/F29787400388
- ↑ Theoretical Study of the Validity of the Polanyi Rules for the Late-Barrier Cl + CHD3 Reaction, J. Phys. Chem. Lett, Z. Zhang et al., DOI: 10.1021/jz301649w

