MRD:az916
Molecular Reaction Dynamics
EXERCISE 1: H + H2 system
1. What value do the different components of the gradient of the potential energy surface have at a minimum and at a transition structure? Briefly explain how minima and transition structures can be distinguished using the curvature of the potential energy surface

In the transition state region and minima, the potential energy gradient is 0 with respect to r1 and r2 . The transition state region is a saddle point on the surface plot; it is a local maximum in one direction and a local minimum in another. At the minima, any change in r1 or r2 will result in the slope increasing. Consequently, minima correspond to stable chemical species - the reactants and products.
To distinguish between the two plataues in gradient, the second partial derivative can be taken for both the minima and transition state. At the minima, ∂2V/∂r1 and ∂2V/∂r2 > 0. The curvature is the same in both directions, corresponding to an absolute minimum. At the transition state, the second derivative is positive in one direction and negative in another. As a simultaneous local maximum and minimum, this location must be a saddle point.
2. Report your best estimate of the transition state position (rts) and explain your reasoning illustrating it with a “Internuclear Distances vs Time” plot for a relevant trajectory

When both internuclear distances r1 and r2 are equal and within the transition state region, the gradient orthogonal to the ridge is zero. Hence, if the atoms have no momentum, they cannot follow a lower energy gradient. Only a small amount of oscillation is observed due to the transition state position being not quite exact, but the internuclear distances are otherwise constant. the value of r1 and r2 were adjusted until no change in internuclear distance was observed. rts is approximately 0.908. This is slightly larger than the H-H bond distance, as the transition state is a region between bond formation and breaking.
Jas213 (talk) 19:25, 28 May 2018 (BST) 0.908 what? Unit missing.
3. Comment on how the mep and the trajectory you just calculated [dynamics] differ
 |
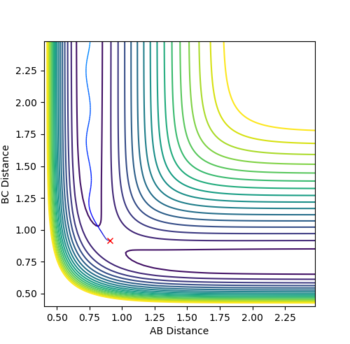 |
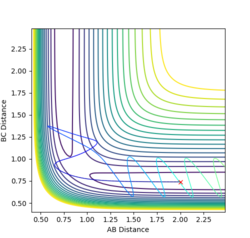
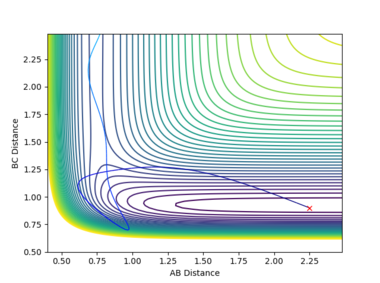
The minimum energy path assumes infinitely slow motion; the particles have no momentum as they move. As a result, the trajectory calculated follows the path of lowest energy without deviation. In reality, atoms have a resistance to change in position - intertia. The dynamics calculation accounts for this inertial movement along the reaction pathway. Rather than instantaneously changing velocity to follow the lowest energy path, particles will gain velocity as they move down from the transition state. Upon encountering an increase in potential energy gradient, or 'a wall', they will move up it slightly rather than continuing along the lowest energy path. Velocity will reach a minimum, then the particle will accelerate down the valley and an oscillation will be induced. Consequently, the trajectory calculated by this method displays oscillating motion along the reaction path. This oscillating motion is manifested as vibration in the molecule.
4. Complete the table by adding a column with the total energy, and another column reporting if the trajectory is reactive or unreactive. For each set of initial conditions, provide a plot of the trajectory and a small description for what happens along the trajectory
Jas213 (talk) 19:28, 28 May 2018 (BST) An overall concluding comment on what you learned from this experiment would have been expected.
5. State what are the main assumptions of Transition State Theory. Given the results you have obtained, how will Transition State Theory predictions for reaction rate values compare with experimental values?
Assumptions:
- Atomic nuclei behave according to classical mechanics.
- Reactants must pass over the energy barrier of the saddle point to reach products.
- Reactions have one saddle point and therefore one transition state between reactants and products.
Transition State Theory (TST) predication are likely to be relatively accurate at mild temperatures. At higher temperatures, reactants may experience re-crossing of the transition state. This means reactions that pass the transition state may still not be succssful, lowering the observed rate relative to the one predicted by TST. At very low temperatures, TST assumes reactants will never have sufficient energy to pass the saddle point. In reality, quantum tunelling can occur which allows reactions to overcome the energy barrier despite having insufficient energy to classically react. At very high temperature, reactants may gain access to a number of transition states away from the lowest saddle point. At these extremes, TST is unlikely to yield accurate reaction rate predictions.
Jas213 (talk) 19:28, 28 May 2018 (BST) Correct, but where are your references?
EXERCISE 2: F - H - H system
6. Classify the F + H2 and H + HF reactions according to their energetics (endothermic or exothermic). How does this relate to the bond strength of the chemical species involved?

F + H2 is exothermic, whilst HF + H is an endothermic reaction. The bond dissociation energy of HF is 132.6 KJmol-1 greater than that of H2 [1]. since a much stronger bond is being formed in the former reaction, it is exothermic as the products are more stable than reactants. Similarly, the latter reaction is endothermic as it involves a decrease in the stability of reacting species.
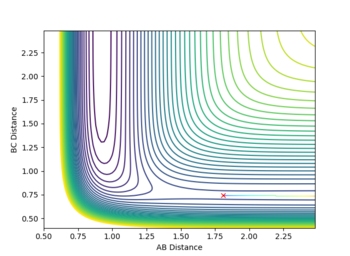
The figure above illustrates this through a surface plot. On the left, H2 is of a much higher energy than HF on the right of the figure. Therefore moving from left to right (H2 + F) decreases the energy of reacting species and from right to left (HF + H) increases it. If the reacting species gain energy from the surroundings, they cool down. Whilst if the reacting species lose energy to the surroundings, they heat up.
Jas213 (talk) 19:31, 28 May 2018 (BST) Brutally clear, nice!
7. Locate the approximate position of the transition state
 |
 |
The transition state is approximately located at r1 = 0.745 and r2 = 1.81069322. It was located by adjusting both internuclear bond distances until no vibration was observed in an internuclear distance vs time plot. When the particles have no momentum, if no motion is observed then the gradient in both directions must be zero - indicating a saddle point. Given the much lower energy state of HF relative to H2, the saddle point is much closer towards reactants than products. As F approaches H2, the reaction rapidly proceeds to products given the energetic favourability of the process. The transition state position for the backwards reaction would be identical, but with r1 and r2 exchanging values (this reaction is a mirror image of the forward process).
8. Report the activation energy for both reactions
The activation energy of a reaction is potential energy gained from the minimum of reactants to the saddle point of the transition state. The activation energy was calculated by displacing the atoms in each reaction slightly towards reactants from the transition state then allowing them to follow the valley floor through MEP calculation.
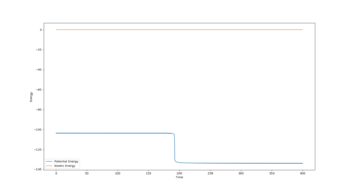
In the reaction between H + HF, the initial potential energy was -103.752 and the final potential energy was -133.968. The net activation energy was 30.216, representing a large gain in potential energy required for the reaction to overcome the transition state. For H2 + F, the initial potential energy was -103.752 and the final energy was -103.964. A net activation energy of 0.212 was observed, thus the energy barrier for reaction in this direction is almost non-existent and it is far more feasible.
Jas213 (talk) 19:33, 28 May 2018 (BST) Nice meps, but again units missing everywhere. These energy values are meaningless without units.
9. In light of the fact that energy is conserved, discuss the mechanism of release of the reaction energy. How could this be confirmed experimentally?

The reaction of H2 + F is considerably exothermic, owing to the loss in potential energy during the reaction. Total energy must be conserved, so in the formation of a the new HF bond, the potential energy lost is converted to vibrational energy in the new molecule. The figure above displays the dramatic increase in vibrational energy once HF is formed. This large vibrational energy will be dissipated to other molecules in a sample through collisions, resulting in an increase in kinetic energy among molecules in a reaction vessel. Temperature is a measure of the average kinetic energy of molecules in a sample, so an increase in temperature during a reaction would indicate the release of potential energy.
10. Discuss how the distribution of energy between different modes (translation and vibration) affect the efficiency of the reaction, and how this is influenced by the position of the transition state
space
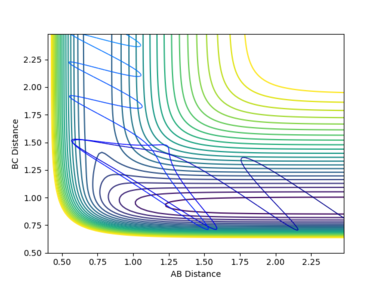
Polanyi's rules[2] provide guidlines for the required energy distribution between translation and vibration for successful reactions with transition states at various positions. In reactions with a transition state close to reactant energy, it is very easy for reactants to overcome the saddle point energy and reach products. As such, only a small amount of momentum from the incoming particle and almost no vibration in the reactants is required. This is the case in the first H2 + F reaction, as a succesful reaction was performed with these conditions. Conversely, if the transition state is close in energy to the products, a large energy barrier must be overcome for the reaction to occur. The barrier is primarily in the BC direction, as this bond in the reactants is very stable. A large amplitutde vibration and little momentum from the incoming particle is therefore required for a succesful reaction. This was demonstrated in the first HF + H reaction.
space
Polanyi's rules are only general guidelines, however. Successful trajectories were obtained when the incoming F atom had little momentum, but H2 was vibrating with a large momentum. Given the very small energy barrier for reaction, F needn't approach with much momentum to induce bond formation. An obstruction to reaction is the transition state vigorously vibrating whilst the independent hydrogen is close by, causing the H-F bond to break again and the H-H bond to re-form. A large amplitute H2 oscillation ensures the donor hydrogen is far from the hydrogen it was originally bonded to upon forming the H-F bond. Consequently, the H2 bond cannot re-form, leaving HF intact. This process is sensitive to many factors, however, and if the H2 oscillation is occuring too with too much momentum, hydrogen may be ejected from the H-F bond.
In the reaction of HF and F, a large momentum of incoming H and little oscillation in HF can also be used for the reaction to proceed. A large energy barrier must be overcome due to the strength of the H-F bond. If H approaches with a large translational momentum, the collision of reactants induces a very large oscillation in H-F, breaking the bond and expelling F. If the pre-existing vibration in HF is too large, the collision will be dampened and less impulse will be imparted into the H-F bond, thus failing to break it. These reactions demonstrate the lack of consistency with Polanyi's rules, although they can be generally applied in most cases.
Jas213 (talk) 19:37, 28 May 2018 (BST) In the HF and F reaction? There is no such reaction. Otherwise detailed discussion of the topic.
- ↑ T. L. Cottrell,The Strengths of Chemical Bonds,2d ed., Butterworth, London, 1958;B. deB. Darwent,NationalStandard Reference Data Series,Nationa lBureau of Standards, no.31, Washington, 1970; S. W. Benson,J. Chem. Educ.42:502 (1965); and J. A. Kerr,Chem. Rev.66: 465 (1966)
- ↑ Theoretical Study of the Validity of the Polanyi Rules for the Late-Barrier Cl + CHD3 Reaction Zhaojun Zhang, Yong Zhou, Dong H. Zhang, Gábor Czakó, and Joel M. Bowman The Journal of Physical Chemistry Letters 2012 3 (23), 3416-3419 DOI: 10.1021/jz301649w


