
MRD:aw2415
H + H2 System

Finding Minima and Transition States

At both a minimum and at the transition structure the gradient of the potential energy surface will be zero. This is due to both of these scenarios being examples of stationary points.
The minima and transition structures can be distinguished by looking at the partial derivatives of the potential energy function. For a point to be a minimum:
and
On the other hand, as the transition structure is a maximum on the minimum path it is classed as a saddle point. As such it is defined such that:
Transition State Position
The estimated transition state position was:
rts = 0.9075
From figure 2 the internuclear distances at the transition state are shown to be constants, it is also clear that the A-B and B-C distances are the same, showing that this value is a good estimate for transition state geometry. This is a collinear system; the bond formed is the same as the bond being made therefore the transition state will be the mid-point of bond-forming or bond-making.[1] At this point both of the bonds will be of the same length. This information was used to educate the first guess of transition state position.
The transition state is a potential energy maximum on the minimum energy pathway (the saddle point), or the peak of a potential energy hill. This is a metastable point and as such if the system of atoms has no momentum at the start it will remain at this point. Since the system is remaining at a single fixed point the bond distances will not change with time and so a plot of internuclear distance against time will be a straight line (figure 2).
MEP vs Dynamic Simulation
Overall the two simulations show the same trend whereby the A-B bond length initially shortens from the transition state geometry before remaining roughly constant whilst the B-C length increases.
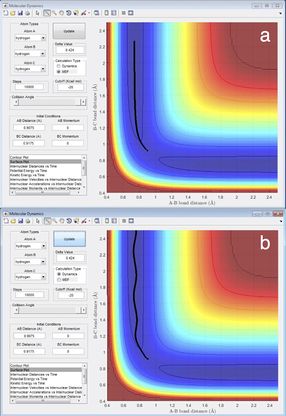
However, there are significant differences between the MEP (Molecular Electrostatic Potential) and dynamic simulations and the trajectories that they produce. In the case of the MEP simulation the only consideration is the potential energy surface based on the electrostatic charges.[2] The position of the molecule is calculated in order to minimise the potential energy of the system. As can be seen the trajectory follows the minimum channel of the potential energy surface with no deviations.
The dynamic simulation is more sophisticated and realistic and allows for many more degrees of freedom. As such there is clear evidence of molecular vibrations from the trajectory. This is shown by the bendy line which moves away from the potential energy minimum, therefore during the course of the vibrations the potential energy will take values higher than the minimum.
| r1(1.495) | 0.7457 |
| r2(1.495) | 5.281 |
| p1(1.495) | 2.481 |
| p2(1.495) | 1.2365 |
Altering the displacement from equilibrium

After investigating the trajectories from r1 = rts+δ, r2 = rts, the trajectories were then investigated from r1 = rts, r2 = rts ++δ. As can be seen from the animations in figure 3 altering this parameter in the way leads the the system descending the potential energy surface on opposite sides of the transition state maximum. Physically this shows that the displacement to one side of the transition state leads to the formation of an A-B bond whilst displacement to the other leads to a B-C bond. Put simply, reversing the direction of the reaction. Figure 4 shows clearly how the bonds are formed between the alternative atoms when the displacement is changed.
Reactive and unreactive trajectories

| p1 | p2 | Reactive | |
|---|---|---|---|
| (a) | -1.25 | -2.5 | Yes |
| (b) | -1.5 | -2.0 | No |
| (c) | -1.5 | -2.5 | Yes |
| (d) | -2.5 | -5.0 | No |
| (e) | -2.5 | -5.2 | Yes |
a.) As the momentum in the coordinate r1 (p1) is not large enough to allow for large deviations from the potential energy minimum on the approach, the molecules follow a nearly straight approach trajectory. However, the overall momentum on collision is large enough to over come the activation barrier so the reaction leads to the breaking of the B-C bond and the formation of the A-B bond.
b.) Whilst the momentum p1 was increased, as is shown by the deviations from the minimum potential energy, the momentum p2 momentum was decreased by a larger amount. As a result the system does not have sufficient energy to overcome the activation barrier so the system remains as reactants.
c.) The raised momentum p2 means that the system has sufficient energy to overcome the activation barrier so the A-B bond forms.
d.) In this example the momentum p2 is significantly increased. The high kinetic energy leads to the high energy transition state being favoured by the system. This leads to the system reaching the transition state and partially forming the product bond before reverting to the transition state then returning back to the reactants.
e.) When the momentum p2 is increased slightly further to -5.2 the transition state is formed, the trajectory infact passes through the transition state 3 times. However, rather than reverting to reactants as in (d) the products are formed.
Transition State Theory
In transition state theory the trajectory is set by following the minimum energy path. This involves passing through the lowest energy transition state, the saddle point. In reality the molecules will take other paths, not going over the saddle point and moving up the sides of the well for instance. These paths will have higher activation energies and therefore the calculated energy will be lower than the experimental value so the predicted rate will be faster than the experimental value.[3] Another assumption of transition state theory is that the trajectory passes through the transition state only once.[4] The flaws in this argument are immediately obvious from looking at both (d) and (e) where the trajectory passes through the transition state multiple times. As is shown in (d) these multiple passes allow the system to return to the reactants and this also means that experimentally determined rate of reaction will be lower than the prediction.
F - H - H system
Exothermic and Endothermic Reactions
The well on the right of this diagram corresponds to the H + HF whilst the left corresponds to the H2 + F system. As can be seen the left hand side is higher in energy than the right and therefore the H + HF reaction is endothermic whilst the F + H2 is exothermic. Since the direction of F + H2 → H + HF is exothermic the products are lower in energy. This means that the bond in the products is stronger than that in the reactants. Consequently the bond strengths are:


| H-F | 570 kJmol-1 |
| H-H | 436 kJmol-1 |
The Transition State
The exothermic reaction of F + H2 will have an early transition state and therefore from Hammond's postulate the transition state will be in the reactant channel rather than the products as it will more closely resemble reactants than products. Then by using a process of trial and error, the transition state was found to be at:
| Bond | Length |
|---|---|
| H-F | 1.808 |
| H-H | 0.74 |
By looking at the internuclear distance vs time graph (figure 6) this was verified.
At this point the energy was -103.750 kcalmol-1, this is the transition state energy, this was found by looking at the potential energy vs time graph in figure 7a. The activation energy is the difference between the transition state energy and the reactant energies (for H + HF = -104.02 kcalmol-1 and F + H2 = -134.0). These values were found by a potential energy vs time plot (figure 7b and c).
This gives an activation energy of the H + HF reaction as 0.270 kcalmol-1 = 1.12 kJmol-1 and that of the F + H2 reaction as 30.25 kcalmol-1 = 126.6 kJmol-1.
Conservation of Energy

Given that energy must be conserved and the potential energy of the products is lower in the reaction of F + H2 than the reactants this excess potential energy must have been transferred to other forms of energy, namely vibrational and translational energy. From the potential energy surface (figure 8) it can be seen that the product vibrations have a much greater magnitude, shown by the trajectories moving higher up the potential valley on the products side compared with the reactants. This means that the products have a greater vibrational energy than the reactants. It can also be seen that the density of the vibrational lines is greater for the reactants than for the product. This is most likely due to the fact that the products have more translational energy than the reactants so the hydrogen atom moves further away between vibrations. However, as this hydrogen is a lighter atom than fluorine the H-F bond will vibrate slower than the H-H bond, this will also lead to the reduction in density of the vibrational lines. It is likely that the decrease in the density of the vibrational lines is due to a combination of the two effects.
Detecting this experimentally
The most facile way to detect this increase in vibration and translational energy would be to use calorimetry. As the products have less potential energy and there is more vibrational and translational energy the reaction will produce heat. This release of heat can be picked up using calorimetry.[5]
It would also be possible to look at IR spectroscopy. Due to the increase vibrational energy the higher vibrational levels will be more populated. Therefore bands corresponding to relaxation from these levels could be detected. The best technique to detect this would be looking at the radiation emitted from a continuous flow of the reactants being mixed.

Polanyi's Rules
Polanyi's rules state that "vibrational energy is more efficient in promoting a late-barrier reaction (that is, a transition state resembling the products) than translational energy, whereas the reverse is true for an early barrier reaction." [6]
As is illustrated in figure 9 for the reaction of H + HF the reaction goes to completion when the momentum of the HF bond is high, corresponding to considerable vibrational energy. Physically, this can be rationalised by considering that the increased vibrational energy will lead to the bond being weakened thus making this exothermic reaction more enthalpically favourable. At high translational energies the hydrogen atom simply bounced off the H-F molecule with no reaction taking place.
Figure 9b shows the trajectory for the reaction of F + H2. In this example of an exothermic reaction it is more efficient for the energy to be in the translational mode, as the reaction has an early transition state. Increasing the vibrational energy by increasing the momentum of the H-H bond was found to reduce the efficiency of the reaction, as predicted by Polanyi's rules. It was however found that if the translational energy was increased too much the products would have an excess of vibrational energy which meant that the endothermic (reverse) reaction was favoured and the reaction did not go to completion.
Shown here are just two cases of initial starting conditions for the reaction of H + HF and one for F + H2. Were a reaction being studied experimentally the sample would contain many orders of magnitude more molecules, each with infinitesimally different starting positions and momentums. As such this narrow sample size gives only a limited indication of the conditions that make a reaction efficient and there will be many other sets of starting parameters that will also lead to reactions occurring. That said, even this small sample size agrees with the predictions made by Polanyi's rules.
(Great job. A very good report overall. Lt912 (talk) 03:43, 26 May 2017 (BST))
References
- ↑ D. M. Grant, P. J. Wilson, D. J. Tozer , S. C. Althorpe, H+H2 quantum dynamics using potential energy surfaces from density functional theory, 2003, vol. 375.
- ↑ J. S. (Jane S. , Murray. K. D. (Kali D. Sen, Molecular electrostatic potentials : concepts and applications, Elsevier, 1996.
- ↑ P. W. (Peter W. Atkins و J. De Paula, Atkins’ Physical chemistry, .
- ↑ D. G. Truhlar و B. C. Garrett, 1984, 35, 159–89.
- ↑ R. N. Landau, D. G. Blackmond و H.-H. Tung, Znd. Eng. Chem. Res, 1994, 33, 814–820.
- ↑ Z. Zhang, Y. Zhou, D. H. Zhang, G. Czakó و J. M. Bowman, J. Phys. Chem. Lett., 2012, 3, 3416–3419