MRD:at6318
EXERCISE 1: H + H2 system
Transition State
On a potential energy diagram the transition state can mathematically be defined as a saddle point and as the maximum on the minimum energy path between the reactants and products. The transition state can be identified by looking for where the gradient of the potential is zero . It can be distinguished from a local minimum by taking the second derivates and ensuring they are opposite signs as can be seen in the mathematical definition in figure 1 whereas for a local minimum both second derivatives would be positive. The opposite signs of the second derivatives taken from orthogonal vectors show that the saddle point (transition state) is a minimum for one vector and a maximum for the other.
and and
figure 1-The mathematical definition of a transition state on a potential energy surface
Two more vectors can be defined from and these are diagonal vectors called and and the second derivatives of these will indicate a minimum and a maximum (one more than zero, the other less than zero respectively).
Great, well defined and explained. Nicely done referring to your figures and labelling them. Rs6817 (talk) 15:12, 19 May 2020 (BST)
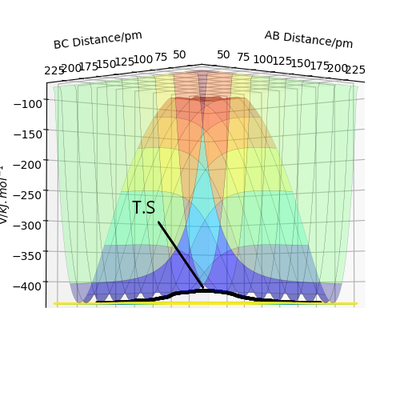
This can be represented on a surface plot, figure 2:
figure 2- Surface plot showing the transition state at the maximum when observed from this angle.
Great figure, well done. Perhaps you could have also included a plot of the actual point (the bit that actually looks like a saddle). Rs6817 (talk) 15:12, 19 May 2020 (BST)
Estimation of the transition state position
By using the internuclear distance plot as shown in figure 3 with the initial distances being the same and the initial momentum is zero. The initial distance is changed until there is no more oscillations and the gradient on the internuclear distance v time plot is zero and the forces are 0 indicating a saddle point and transition state. This occurs at .
figure 3 - internuclear distance plot with horizontal lines of gradient 0 showing the presence of a transition state at that position.
Good, perhaps you could have referred to the forces along the bonds at the saddle point or referred to use of the Hessian matrix. What does the symmetry of this surface tell us about the saddle point? Rs6817 (talk) 15:12, 19 May 2020 (BST)
Comparison of the mep and dynamic trajectories
When the initial conditions are set to , and .
For mep (minimum energy pathway) the trajectory decreases smoothly in potential energy from the transition state and to the floor of the surface plot. For the trajectory with the same initial conditions in dynamics it travels the same path as the mep but oscillates, showing vibrations. The main differences observed in these plots are that there are no oscillations in the mep and the path is shorter this highlights how kinetic energy is zero in the mep as it's infinitely slow and doesn't allow the atom to build up momentum over each time step therefore doesn't oscillate, whereas in the dynamics which is a physical representation of the atoms can build up kinetic energy so therefore starts to oscillate. This is also highlighted in the "Momenta vs Time" plot where in mep it is zero for the whole of time and in dynamic it rises and oscillates around for the and rises to for the solo atom. As seen below with figure 4 being due to dynamics caluclations and figure 5 due to mep calculations:
figure 4- Dynamics, momenta vs time graph
figure 5-MEP, momenta vs time graph
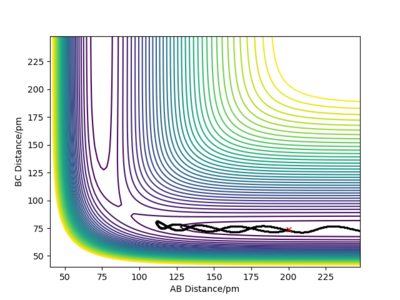
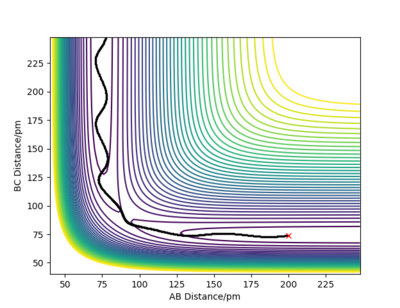
The difference is highlighted in the contour plots below with figure 6 using dynamics calculation type and figure 7 using the mep calculation type:
figure 6-dynamics, contour graph.
figure 7-MEP, contour graph.
Great, really strong answer and nice use of the different plots to explain your point, no complaints with this one. Rs6817 (talk) 15:12, 19 May 2020 (BST)
Reactive and unreactive trajectories
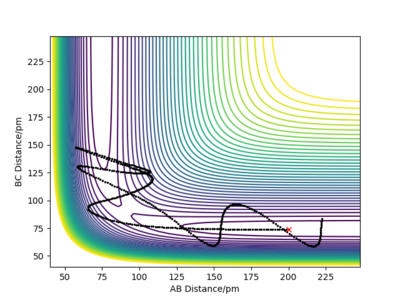
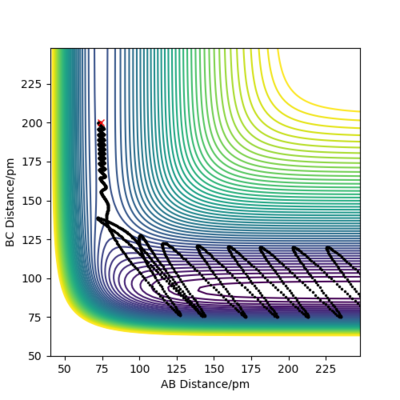
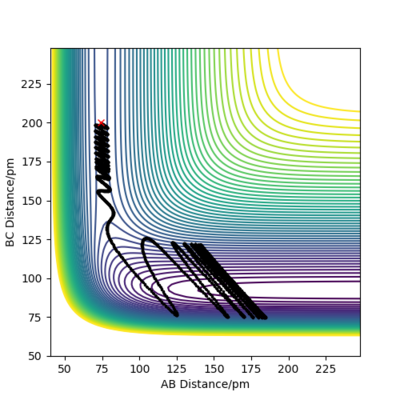
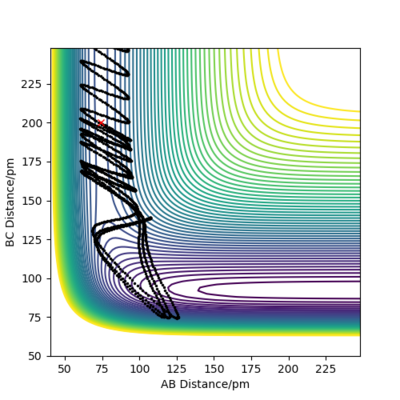
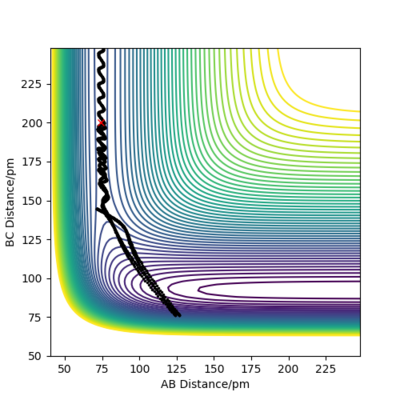
For the initial positions r1 = 74 pm and r2 = 200 pm, trajectories were run as can be seen in the table below:
This table concludes that there must be sufficient energy to overcome the potential barrier and pass through the transition state otherwise the product won't form as in row 2, however if the reactants have an excess of energy the products are able to pass back over the barrier and form reactants again and not produce the product as in row 4. This shows how having sufficient kinetic energy isn't the only factor in whether a collision leads to a successful reaction.
Great again.WHat type of energy causes the recrossing? Rs6817 (talk) 15:12, 19 May 2020 (BST)
Transition State Theory
Transition state theory predictions for reaction rate values don't include other factors that would prevent a successful reaction from occurring and states that if the reactants have more kinetic energy than a certain value (energy of the transition state) then a reaction will successfully occur which is not the case in real experimental values. This is because transition state theory makes certain assumptions such as the products not being able to reform reactants and pass back over the transition state, this is not true in experimental values as can be seen in the table above this therefore shows that the predictions for reaction rate from transition state theory will be much larger than experimental values. However, transition state theory also doesn't take in the factor of quantum tunnelling which would increase the prediction for reaction rate however this factor is much less significant than the irreversibility of transition state -> product.[1]
Good, well written but I think you could have compared this to your experimental plots in the question above. What do we observe in the simulation? Does this or does this not fit to TS? You are correct on your suggestion that TS will overestimate despite quantum tunnelling effects. Rs6817 (talk) 15:12, 19 May 2020 (BST)
EXERCISE 2: F - H - H system
PES inspection
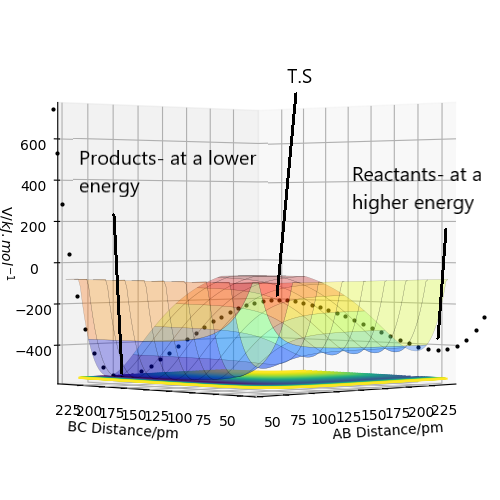
For F + H2 the reaction is exothermic as on the potential energy surface it can be seen that the reactant energy is higher than the product energy therefore indicating a loss of energy in the reaction through heat. Therefore for H + HF reaction it's reactants are the products of the F + H2 reaction and it's products are F + H2 therefore is an endothermic reaction, with the opposite direction of the figure 8 below, which shows the F + H2 exothermic reaction:
Figure 8- Surface plot of reaction F + H2 showing it's exothermic nature.
Good, well labelled figure. Rs6817 (talk) 15:12, 19 May 2020 (BST)
This therefore shows that the total energy of H2 and F are higher than HF and H so the bond energy (strength) of the HF bond is much larger than that of H2 as energy is required to be inputted for the reaction to occur (endothermic) as more energy is required to break the HF bond than used to form the bond of H2.
Ok, this could require some literature comparison values here? These bond energies are really well known! Rs6817 (talk) 15:12, 19 May 2020 (BST)
Approximate position of the transition state
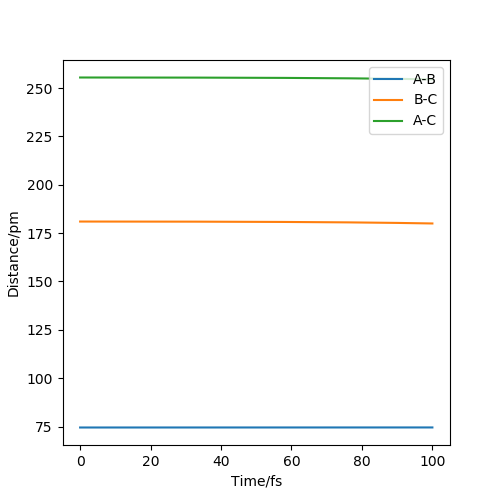
The position of the transition state was found using the method above for F + H2; by adjusting the initial positions until the force on the atoms are zero and the gradient for internuclear distances v time graph is zero. It is shown that the transition state is when AB distance = 74.5 pm and BC distance= 181 pm with A=H, B=H and C=F. This is confirmed by the hessian which confirms a saddle point. The internuclear distance-time graph is shown below in figure 9:
How does the Hessian confirm the saddle? Could improve the number of decimal points on your estimations. Rs6817 (talk) 15:12, 19 May 2020 (BST)
Figure 9- Confirms a transition state at the initial position as gradient is 0.
Activation energy for both reactions
This can be found by finding the energy at the transition state whose position was found above, as -433.98 kJ.mol-1. The activation energy can then be deduced from the difference between the reactants energy and the transition state energy. The reactants energy was found by putting atoms in a molecule their bond length apart and the atom not in the molecule 1000 pm away so that there would be no interaction between them. The bond lengths were found by trial and error until the forces between the atoms were 0. The bond length for H2 was found to be 74 pm and the bond length for HF was found to be 92 pm. Therefore the activation energy for H2 + F is 1.12 kJ.mol-1 as the reactants energy is -435.10 kJ.mol-1. The activation energy for HF + H is 126.72 kJ.mol-1 as the reactants energy is -560.70 kJ.mol-1.
Good estimates well done. Rs6817 (talk) 15:12, 19 May 2020 (BST)
Mechanism of release of reaction energy
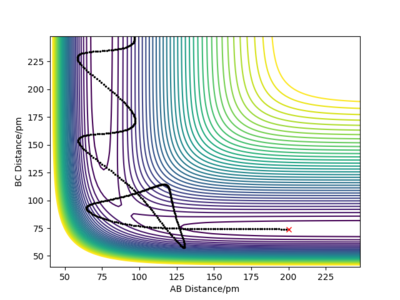
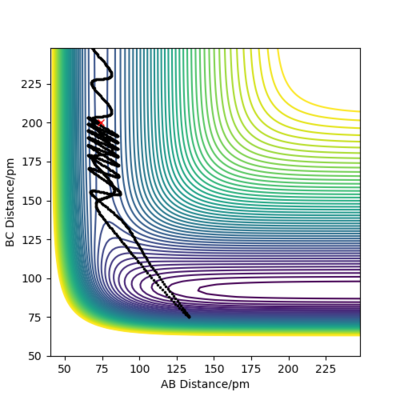
By setting the initial conditions so that the H2 + F reaction occurs with AB= 74.5 pm BC= 200 pm and the initial momenta as -0.5 g.mol-1.pm.fs-1 and -2 g.mol-1.pm.fs-1 are respectively, where A and B are H and C is F. The reaction is shown to occur as below in the contour plot (figure 10):
Figure 10- Shows the reaction is successful for the above conditions.
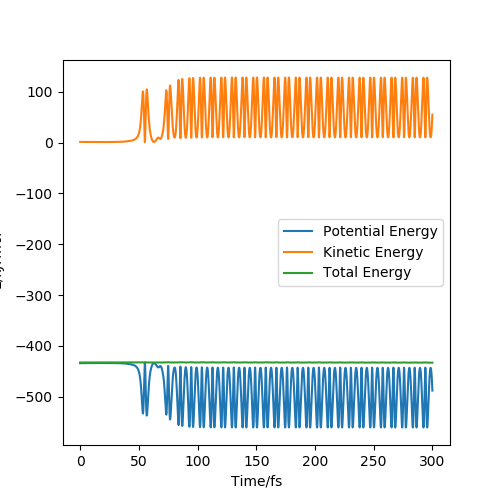
This reaction is then considered by using the energy v time graph as shown below:
Figure 11- Shows the energy v time graph for the conditions stated above
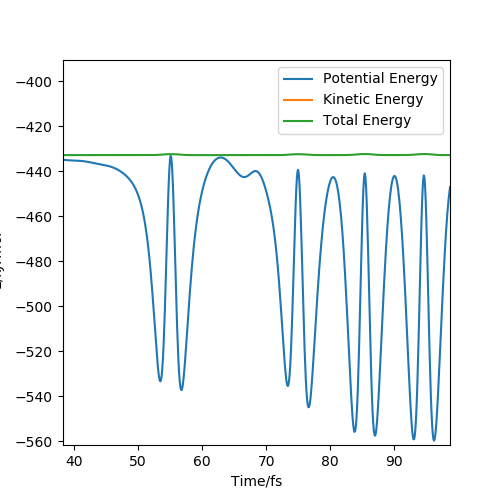
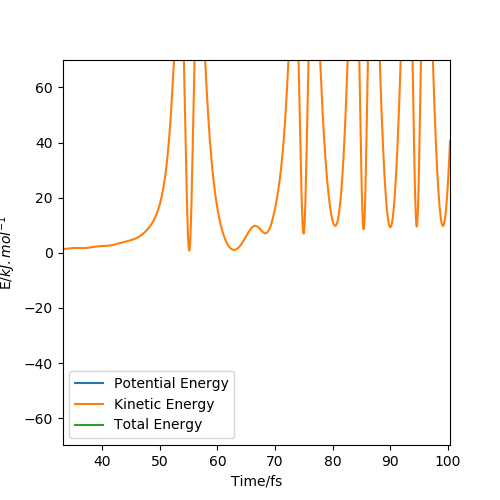
This shows that as total energy is a straight horizontal line (with gradient 0) that total energy is conserved and also shows the kinetic energy and potential energy oscillating out of phase so that kinetic energy + potential energy = total energy. After the reaction has taken place the potential energy's overall oscillation has shifted downward (decreased in energy) and the kinetic energy's overall oscillation has shifted upward (increased in energy). This shows the exothermic nature of the reaction as some of the potential energy is transferred to kinetic energy which in a real life experiment would be released as heat. Experimentally this can be measured through calorimetry which measures the heat and therefore the energy released from the reaction. These shifts are shown in the figures below:
Figure 12- Section from energy time graph showing the decrease in potential energy.
Figure 13- Section from energy time graph showing the increase in kinetic energy.
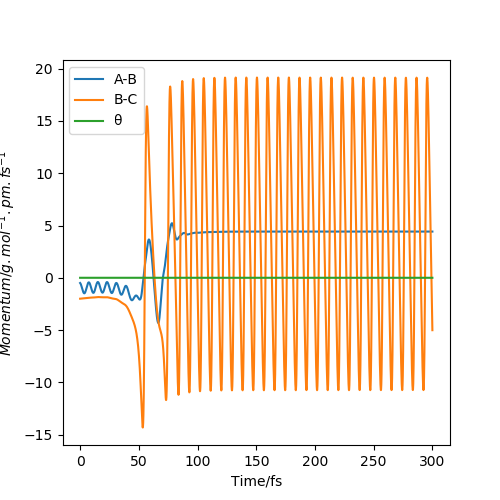
In a momenta v time graph as shown below in figure 14 it can be seen that the energy released from the reaction (difference of energies between reactants and products) is translated into vibrational energy in HF oscillations. This is seen as after the reaction occurs the BC (HF) oscillations increases and the AB plateaus to a constant momentum of ~ 5 g.mol-1.pm.fs-1, this is because energy is released from the formation of the HF bond which increases it's vibrational energy (which is measured as heat in calorimetry); the HH plateaus as the HF molecule and H atom move away from each other.
Figure 14-Momenta v time graph showing the types of energy transfer in the exothermic reaction
Very well described, great use of the graphs again, shows strong understanding. Some more detail is required in your answer to calorimetry, which type, how does this work etc? A reference may have helped here. Rs6817 (talk) 15:12, 19 May 2020 (BST)
Distribution of energy between different modes
The table below shows the reactivity and energy of the reaction H2 + F with differing initial momenta. The initial positions are set to AB = 74 pm and BC= 200 pm where A and B are H and C is F.
The pFH represents the translational energy and the pHH the vibrational energy in this reaction which is varied as seen in the table above. The table shows that even when the total energy is large it doesn't necessarily mean the reaction will be successful. The value above when pFH = -1.6 and pHH = 0.2 which is a much smaller value for the vibrational energy however has a similar overall energy of -432.4 to the successful reaction. This shows that the type of energy in the system is important to determine whether the reaction is successful. In the reactions above with total energy being large but still having an unsuccessful reaction is mainly due to the reversibility where the products are able to cross back and become reactants again.
According to Polanyi's rules which indicate vibrational energy is more efficient at promoting a late transition state than translational energy [2], which injunction with Hammond's postulate [3] where an exothermic reaction has an early transition state which resembles the reactants and an endothermic reaction has a late transition state which resembles the products. This overall can show that for an exothermic reaction translational energy (instead of vibrational) promotes an efficient reaction whereas for an endothermic reaction vibrational energy (instead of translational) promotes an efficient reaction.
So therefore for H2 + F, as it is exothermic, translational energy, pHF being higher would promote a more efficient reaction whereas for HF + H, as it is endothermic, vibrational energy, pHF also being higher would promote a more efficient reaction.
Another strong answer, minimal comments here. Reference included well done. Rs6817 (talk) 15:12, 19 May 2020 (BST)
References
- ↑ Chem Libre texts, https://chem.libretexts.org/Bookshelves/Physical_and_Theoretical_Chemistry_Textbook_Maps/Map%3A_Physical_Chemistry_for_the_Biosciences_(Chang)/09%3A_Chemical_Kinetics/9.07%3A_Theories_of_Reaction_Rates, (accessed May 2020)
- ↑ Z.Zhang, Y.Zhou, D.H.Zhang, G.Czako, J.M.Bowman, J.Phys.Chem.Lett., 2012, 3, 3416-3419
- ↑ P.W.Atkins, Atkins' Physical Chemistry, Oxford University Press, Oxford, 1940

