MRD:ar3015
Physical computational labs
H2 + H transition states
There are 3 stationary points shown on the potential energy surface where the reactants initial energy, transition state and products final energy are. As they are stationary points this means that the derivatives are 0. In order to distinguish between the minima and the transition states, the second derivative can be taken where the transition state would give a negative value (minima) and the reactants and products energy would give positive values indicating that they're minimas.
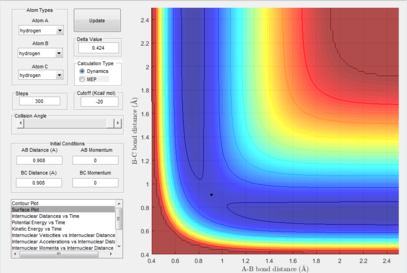
At the transition state, due to the symmetry of the system, the internuclear distances should be equal about atom B. This means that by keeping momentum at 0 and varying the internuclear distances, the point at which the bond distances don't vary can be found
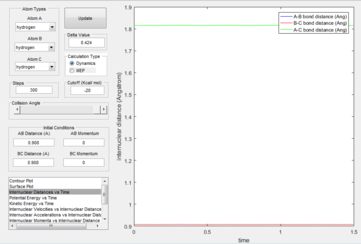
which is where the transition state occurs. The plot shows the single point where this occurs which is 0.908.
Figure 3 shows that there is no change in the internuclear distance with time. This is because as it is the transition state, there is no oscillation about the bond and the bond lengths are fixed.
 |
 |
 |
= Dynamic and MEPs
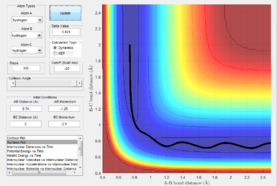
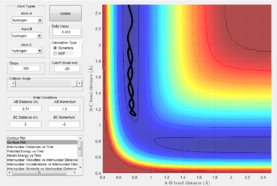
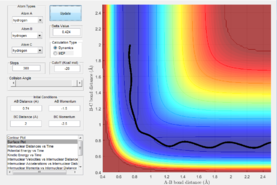
As the velocity is reset to 0 after every step in the mep this shows a single straight line rather than showing any oscillation/vibration as this means there is no kinetic energy and only the lowest energy is shown for each step in this pathway. With the dynamics setting, the whole picture is shown such as the variation in bond length in both, changes in kinetic energy and therefore changes in potential energy too.
Reactive and unreactive trajectory conditions
Transition state theory assumptions
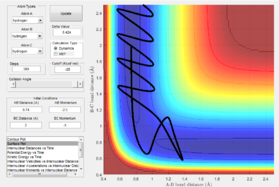
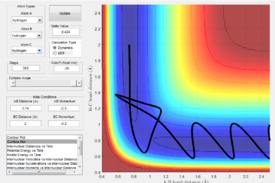
Main assumptions of transition state theory are that the reactants are in quasi equilibrium with the transition state activated form of the reactants. Once a reactant has passed the transition state, according to the transition state theory cannot cross back. This however does not take into account quantum mechanical models as the transition state theory is purely a classical mechanics model. As transition state theory states that if molecules don't collide with or have enough energy to cross the activation energy barrier the products will not be formed, this does not take into account quantum mechanics in which some molecules can quantum mechanically tunnel through the activation barrier. Figure 6 and 7 demonstrate a disagreement with transition state theory as the transition state barrier has been crossed once and then either recrossed to go to allow a successful reaction to take place or the reaction has returned to the reactants.
[Classify the F + H2 and H + HF reactions according to their energetics (endothermic or exothermic). How does this relate to the bond strength of the chemical species involved?]
The H-F bond dissociation enthalpy is 436 Kj/mol and H-H bond enthalpy is 570 Kj/mol. For F + H2 the reaction is exothermic as 436-570 Kj/mol giving -134 Kj/mol showing that the reaction is exothermic. For HF + H the reaction is endothermic as 570 - 436 giving 136 Kj/mol. This is an endothermic reaction due to the strength of the H-F bond as more energy is required to break the H-F bond so the activation barrier will be higher.
Locating the F + H2 transition state
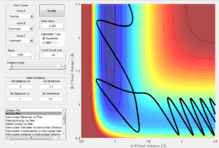
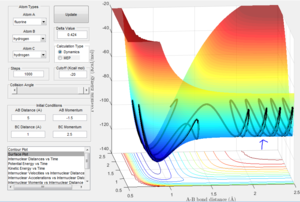
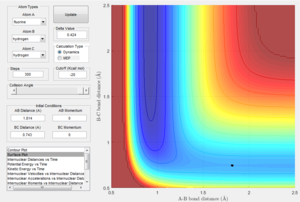
Here the reaction pathway of F + H2 can be seen which is successful. In order to find the transition state, an approximation of the bond lengths at the transition state was made by looking for the sable point on the 3D plot of PE vs time which can be demonstrated in figure x. The initial coordinates B-C bond length= 0.9 and A-B bond length= 2.1 of A series of trial and error variables were then entered in order to hone in on the transition state. The values that gave the best approximation that could be determined by trial and error were B-C bond length=0.743 and A-B bond length=1.814
 |
 |
 |
Determining the activation energies
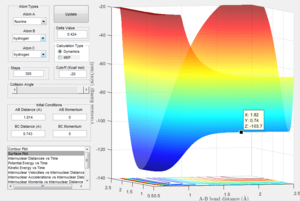
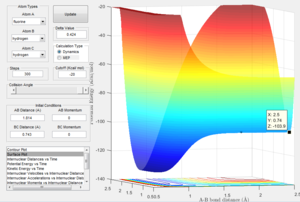
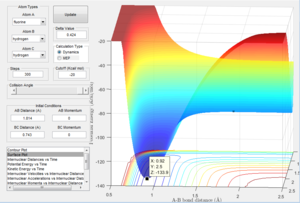
This image shows the z coordinate for activation energy which is representative of the potential energy which is the transition state sable point. This can be used to calculate the activation energy for both the exothermic reaction and the endothermic reaction as demonstrated below.
This demonstrates the change in the Z axis which represents the difference in potential energy in kcal/mol which can be converted to Kj/mol. This represents the energy barrier required for the reactants in the exothermic reaction to overcome. This gives an activation energy of 0.937 Kj/mol. Here it can be seen that the energy minimum for the endothermic reaction is a lot lower than the transition state than in the exothermic. This is due to the fact that the bond strength for H-F is much greater than H-H. The Z coordinate given here which is -133.9 giving an energy difference of 126.36 Kj/mol.
 |
 |
 |
|---|
Reaction dynamics
 |
 |
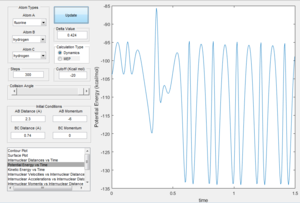 |
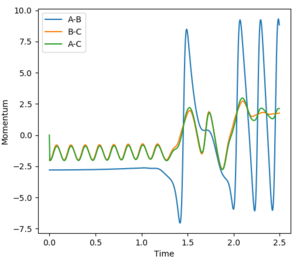
The internuclear distance shows that H-H are oscillating. After the point where the two paths cross over, the oscillation of the new F-H molecule is greater than that of H-H. This indicates that there is an increase in kinetic energy. By looking at the potential energy vs time and kinetic energy vs time graphs, it can be seen that the kinetic energy increases after the transition state. Due to the conservation of energy, as the kinetic energy has increased this means the potential energy must've decreased which is demonstrated in the potential energy graph. In order to experimentally show this, an IR of the compounds could be taken. However, this would only show the H-F bond formed in IR as there is no change in dipole for H-H. Another method to confirm the reaction experimentally would be to perform a calorimetry experiment. This will show the change in enthalpy (through heat) so the experimental and theoretical data could be compared.
H2 + F -> HF + H
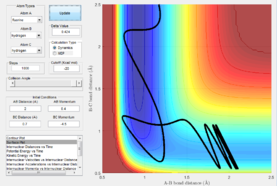
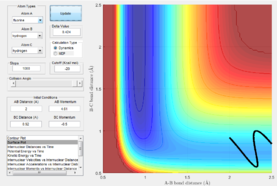
Polyani's rules state that at an early activation barrier means that the reaction should be activated by translation energy with a lower vibrational energy. However, for the example shown below this rule breaks down. If we invoke Hammond's postulate, the early transition state indicates an exothermic reaction. H2 + F -> HF + H is an exothermic reaction.
 |
 |
HF + H -> H2 + F
 |
 |
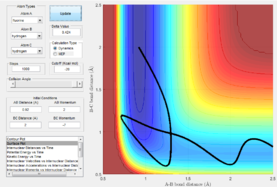
Here it is demonstrated also that the scenarios do not agree with Polyani's rules as at a late activation barrier, the reaction can proceed with higher vibrational energy. By invoking Hammond's postulate we can assume that a late transition state it is an endothermic reaction. Here it is seen with low vibrational energy the reaction proceeds and doesn't proceed with high vibrational energy.
These reactions show the opposite of polyani's rules and therefore a breakdown.
References
1- Transition state theory - Clayden, J. J., Greeves, N., Warren, S., & Wothers, P. (2001). Organic Chemistry. Oxford University Press (Vol. 40). doi:10.1086/278635 p. 253-254
2- Hammond's postulate - http://pubs.acs.org/cen/science/8120/8120sci2.html accessed on 12/05/2017
3- Bond enthalpies - https://chem.libretexts.org/Core/Physical_and_Theoretical_Chemistry/Chemical_Bonding/General_Principles_of_Chemical_Bonding/Bond_Energies accessed on 12/05/2017
4- Polyani's rules - Polanyi, J. C. (2007). ACCOUNTS of CHEMICAL RESEARCH. Chemical & Engineering News, 85(30), 35. doi:10.1021/cen-v085n030.p035

