MRD:ap6715
Part 1ː A collision between 3 H atoms
Question 1 - Distinguishing between stationary points
- What value does the total gradient of the potential energy surface have at a minimum and at a transition structure? Briefly explain how minima and transition structures can be distinguished using the curvature of the potential energy surface.
The potential energy gradient (single partial differentiation with respect to either r1 or r2) for each of the transition state (saddle point) and the minima are equal to 0. The transition state is a maximum energy on the minimum potential energy surface and is therefore a saddle point. The reactant and the product are each minimum points on the minimum potential energy surface.
Due to the three dimensional nature of the plot, partial derivatives must be considered in order to mathematically distinguish between the saddle point and the global minimum point.
The function must be differentiated twice with respect to r1, attaining fr1r1, differentiated twice with respect to r2, attaining fr2r2 and finally differentiated once with respect to r1 followed by a further differentiation with respect to r2, this attains fr1r2.
fr1r1 = , fr2r2 = and fr1r2 =
If fr1r1 is more than 0 and (fr1r1 x fr2r2 - (fr1r2)²) is more than 0 then the point is a minimum. If fr1r1 is less than 0 and (fr1r1 x fr2r2 - (fr1r2)²) is more than 0 then the point is a maximum. If (fr1r1 x fr2r2 - (fr1r2)²) is less than 0 then the point is a saddle point.
These equations are only valid for a system where there are two variables of r. If a greater number of variables are required then more terms would have to be considered.
(Good that you've clarified that this only works for two variables. For more variables, you need to diagonalise the hessian matrix (second derivatives matrix from which you've obtained the determinant) and inspect the eigenvalues Tam10 (talk) 15:55, 8 June 2017 (BST))
The transition state and minimum points can be described qualitatively as followsː At a minimum point a movement in n directions away from the minimum point will result in the increase of energy. A first order saddle point occurs when there is a maximum orthogonal to (n-1) minima. Movement in n-1 directions at a saddle point will cause a reduction in the energy (towards the minima) and movement in the orthogonal direction will cause an increase in the energy (towards the maximum).
Question 2 - Probing the transition state position
- Report your best estimate of the transition state position (rts) and explain your reasoning illustrating it with a “Internuclear Distances vs Time” screenshot for a relevant trajectory.

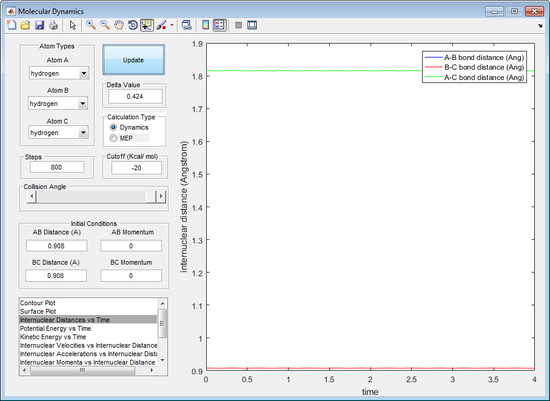
The initial r1 and r2 where tested at a value of 0.9 Å. It can be observed from the internuclear distance against time plot that, after 800 cycles, the triatomic structure splits into the singular atom and the diatomic structure (observed by the increasing A-B distance in figure 1). This indicates that the bond is not at its optimum bond length for the triatomic structure, because the transition state should be stable after an infinite number of cycles. The r1 and r2 were reduced to a value of 0.908 Å. It can be seen that the triatomic structure no longer dissipates after 800 cycles, suggesting that the rts is very close to 0.908 Å, seen by figure 2.
Question 3 - A comparison of the mep and dynamic calculation
- Comment on how the mep and the trajectory you just calculated differ.
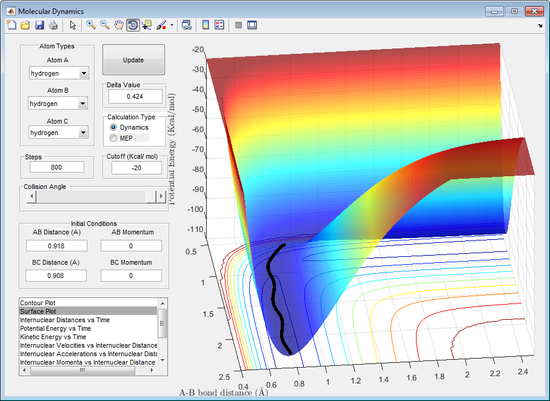
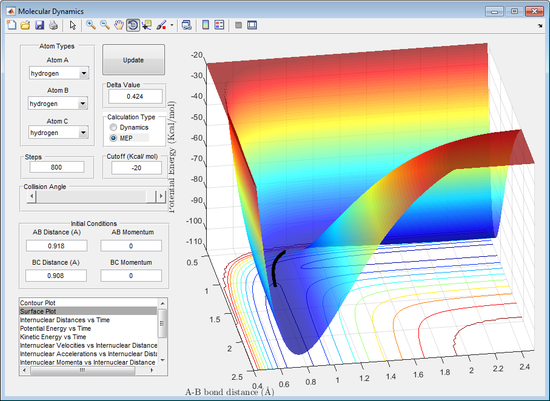
It can be observed from the figures above (dynamic left, mep right) that the trajectory pathways between the calculations differ. In the dynamic calculation the trajectory travels much further in the same number of cycles, compared to that for the mep calculation, it also appears to oscillate as the leaving atom moves away from the saddle point. The trajectory pathway for the mep calculation is shorter for the same number of cycles compared to the dynamic, it also doesn't oscillate as the path moves away from the saddle point.
The differences in the trajectories observed is due to how each calculation operates. The mep calculation resets the velocity after each and every cycle so that it is the velocity as if it was starting at that point on the potential energy surface. The dynamic calculation does not do this, instead it carries the velocity from previous cycles for each and every cycle. This results in the dynamic calculation possessing excess velocity and therefore can go up a energy gradient, mep can only go down energy gradients.
This explains why the dynamic trajectory travels much faster, because the velocity of the leaving atom is faster for each cycle excluding the first when compared to mep. The dynamic calculation causes an oscillating trajectory along the minimum energy surafce because it has a faster velocity and carries momentum from previous cycles. This allows it to reach points above the minimum energy surface (partially along the walls of the minimum energy surface). The resetting of the calculation for mep prevents this.
This gives each the dynamic and mep calculation different advantages. The advantage to mep is that it will map out a more accurate pathway along the minimum energy surface. The dynamic provides a more realistic movement along the surface, as in reality the velocity does not reset after each and every cycle.
(Well answered Tam10 (talk) 15:55, 8 June 2017 (BST))
Question 4 - Determining the reactivity upon varying trajectory momenta
- Complete the table by adding a column reporting if the trajectory is reactive or unreactive. For each set of initial conditions, provide a screenshot of the trajectory and a small description for what happens along the trajectory.
| Trajectory number | p1 | p2 | Outcome |
|---|---|---|---|
| 1 | -1.25 | -2.5 | Reactive |
| 2 | -1.5 | -2.0 | Unreactive |
| 3 | -1.5 | -2.5 | Reactive |
| 4 | -2.5 | -5.0 | Unreactive |
| 5 | -2.5 | -5.2 | Reactive |

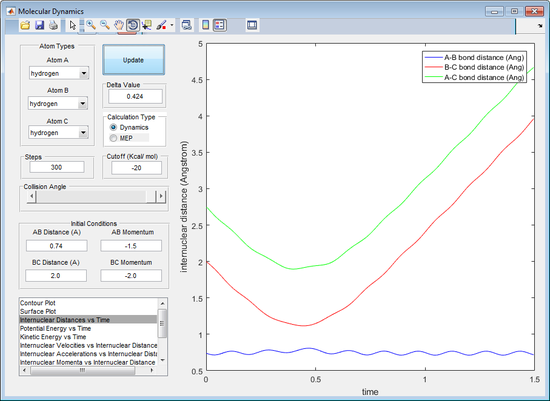
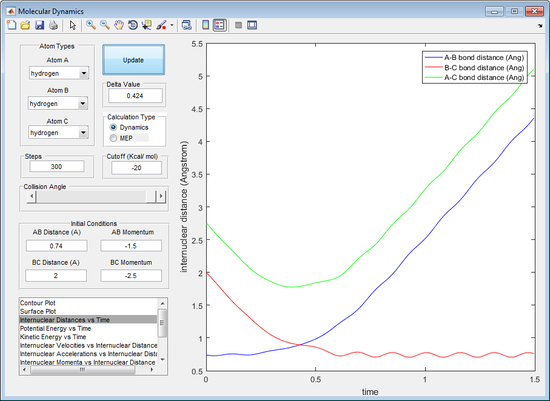

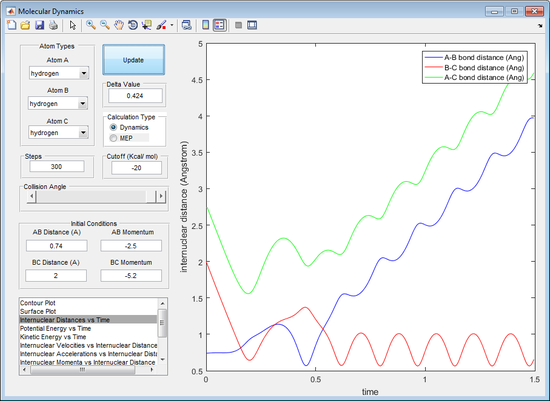
The value of p1 depicts the momentum of the molecule and p2 depicts the momentum of the incoming atom which is colliding with the molecule.
(Be careful here: p1 is the momentum by which A and B are moving apart. This means p1 and p2 are coupled (pulling B towards A also brings it away from C) Tam10 (talk) 15:55, 8 June 2017 (BST))
The reactive trajectories are the first, third and fifth trajectories. Using the reactive trajectories (see figure 5, 7 and 9) the graph of internuclear distance against time shows that the A-B bond length decreases and then oscillates. The B-C bond length oscillates until the A atom is in close proximity to the molecule and begins to increase. This shows that the trajectory is a reactive trajectory because the B-C bond is broken (seen by loss of oscillation of the B-C bond length and also the increase in B-C bond length after the A-B collision in figure 5, 7 and 9). The A-B bond length also shortens and, after the loss of the C atom after the collision, the A-B bond length oscillates (see figure 5, 7 and 9). The oscillation of the bond length indicates vibration occurring in a bond.
The first and third trajectory have a significantly greater energy than the activation energy observed by the simple crossover of the A-B and B-C bond length (seen by figure 5 and 7). The fifth trajectory has a more complicated crossover of the A-B and B-C bond length (see figure 9). The momentum of the incoming A molecule has just enough momentum in order to overcome the activation energy to break the B-C bond. Initially in the fifth trajectory the A molecule causes the B-C bond length to extend, however the C atom has enough momentum and moves back in towards the B molecule, extending the A-B bond length. This is known as barrier recrossing as the transition state is formed more than once. The A molecule then heads back towards the B molecule and extends the B-C bond length long enough that it breaks. This is also a barrier recrossing scenario. The proof of conversion from the BC molecule to the AB molecule and an atom of C is confirmed by the extension of the B-C bond length and the oscillation of the A-B bond length (indicating the vibrations of a bond).
The unreactive trajectories are the second and fourth trajectories. In these trajectories (see figure 6 and 8) the graph of internuclear distance against time shows that the A-B bond length decreases and then subsequently increases. In both the trajectories the oscillation of the B-C bond length is present at the end of both calculations. This indicates that the B-C bond does not break in the overall outcome of the reaction.
The fourth trajectory is another case of barrier recrossing as the transition state is formed more than once in the reaction. The atom A approaches the molecule BC and causes the B-C length to increase, however the C molecule has sufficient momentum to come back, reforming the transition state, and then cause the A-B to increase in length and break.
The difference in momentum between the fourth and fifth trajectory is a 0.2 increase in the momentum of atom A towards the molecule BC. The fact that barrier recrossing is observed in both the fourth and fifth trajectories, as well as the fact that the fourth trajectory was unreactive and the fifth was reactive, suggests that the in the fourth and fifth trajectories the energy of the incoming atom A is close to the activation energy. This shows that it is very difficult to predict whether a reaction will occur. Typically other parameters such as the approach angle of the trajectory also play a part in defining whether the reaction will proceed.
(Trajectories 1 and 3 have just about enough energy to cross over the barrier. Trajectories 4 and 5 have roughly 4 times the kinetic energy of 1 and 3. By looking at the kinetic energy plot and knowing the energy of the TS you can work out what the activation energy is. Tam10 (talk) 15:55, 8 June 2017 (BST))
Question 5 - Transition State theory and relation to calculated trajectories
- State what are the main assumptions of Transition State Theory. Given the results you have obtained, how will Transition State Theory predictions for reaction rate values compare with experimental values?
Transition state theory states that, for a supermolecule, if it crosses the critical dividing surface the reaction will go to completion and form the products, the Boltzmann distribution of the energy of the reactants is constant and finally that the supermolecules that cross the critical dividing surface have a Boltzmann distribution of energy in correspondence to the temperature.[1].
It can be seen in trajectory 4 and 5 (figure 8 and 9) that the critical dividing surface is crossed more than once. In trajectory 4 the reaction does not reach completion and, hence disagrees with the first assumption of transition state theory as it would predict that the reaction will occur. Looking at trajectory 5, transition state theory would predict a faster rate of reaction because it will only cross the critical dividing surface once before reaching completion.
Part 2ː A collision between a F atom and 2 H atoms
Question 6 - Classification of reaction energetics
- Classify the F + H2 and H + HF reactions according to their energetics (endothermic or exothermic). How does this relate to the bond strength of the chemical species involved?
In this calculation atom A is a Flourine, B is the central Hydrogen and C is the other Hydrogen atom.
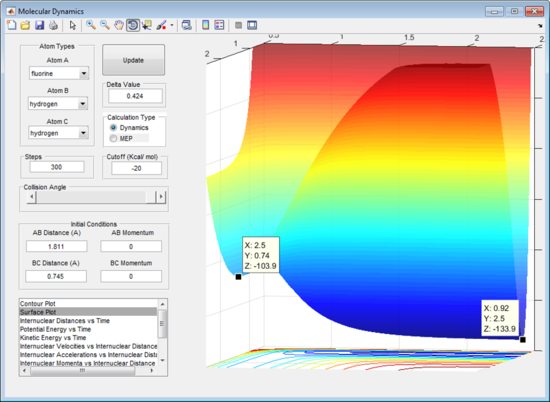
Figure 10 shows that the energy of the HF molecule = -558.1 KJ/mol and the H2 molecule = -432.6 KJ/mol.
Literature values: HF = - 565.3 KJ/mol and H2 = - 432.0 KJ/mol. [2]
The variance from the literature values is due to using a classical potential energy surface. To find an energy value that is closer to the literature value a quantum mechanically derived potential energy surface could be used.
This shows that, using our model, the energy of the HF molecule is lower than the energy for the H2 molecule (125.5 KJ/mol lower). This means that the reaction of F and H2 causes a reduction in the total energy of the system therefore the reaction must be exothermic and release 125.5 KJ/mol to the environment. This also means that the reaction of H with F-H molecule will cause an increase in the total energy of the system by 125.5 KJ/mol therefore the reaction must be endothermic and use energy from the environment.
This shows that the H-F bond is stronger than the H-H bond as it is lower in energy and, thus more stable.
Question 7 - Probing the position of the transition state
- Locate the approximate position of the transition state.
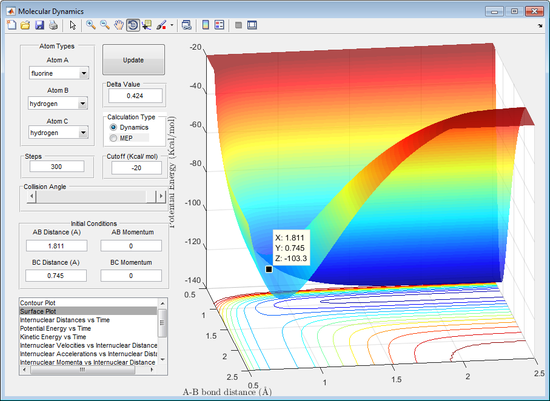
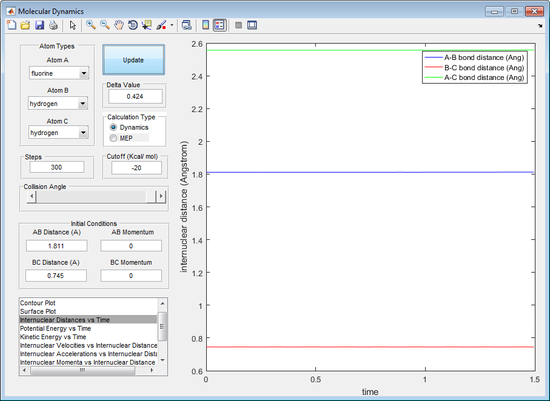
From figure 11 the transition state can be seen as when r1= A-B distance = 1.811 Å and r2 = B-C distance = 0.745 Å. From figure 12 the graph shows that when r1= 1.811 Å and r2 = 0.745 Å there is no change in internuclear distance versus time as the coordinates are perfectly positioned at the transition state.
Question 8 - Deducing the energy profile diagram and associated energetics
- Report the activation energy for both reactions.

The energy of the transition state = -432.2 KJ/mol
The energy of the HF molecule = -560.2 KJ/mol
The energy of the H2 molecule= -434.3 KJ/mol
The activation energy of the reaction of F with the H2 molecule is = 2.1 KJ/mol. The activation energy of the reaction of H with the HF molecule is = 128 KJ/mol.
Question 9 - Energy conversion throughout the reaction
- In light of the fact that energy is conserved, discuss the mechanism of release of the reaction energy. How could this be confirmed experimentally?
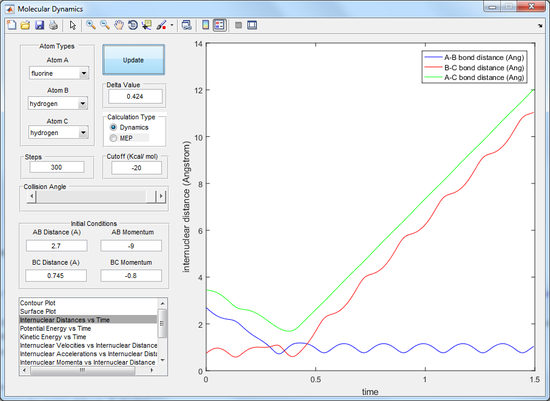
At the beginning of the trajectory there is a large amount of kinetic energy associated with the molecule A (the Fluorine atom). As the fluorine atom gets closer to the H2 molecule the energy is converted from kinetic energy to potential energy due to attraction to the hydrogen molecule. When the transition state forms the kinetic energy is at its minimum and the potential energy is at a maximum. The terminal H atom of the transition state then leaves and the potential energy is converted to kinetic energy for the atom C (hydrogen atom) moving away. There is also a loss of potential energy in the form of vibrational energy as the AB bond vibrates after the collision.
This can be seen by the internuclear distance vs time plot (see figure 14). This shows that after the hydrogen atom leaves it moves away from the newly formed A-B molecule and so therefore the energy is converted to kinetic energy. The changing distance between the A and B atoms also shows that the AB bond is oscillating and hence the energy is also being converted to vibrational energy.
The release of the excess energy as vibrational energy can be proven by observing the IR vibrational frequency of the product. If the excess energy is released as vibrational energy then the product of the collision will be at higher vibrational states. This will cause the frequency to shift to a lower energy. Calorimetry can also be used to quantify the amount of heat released by the reaction.
Question 10 - Polanyi's rules and their relation to F-H-F example
(Misleading typo in the title Tam10 (talk) 15:55, 8 June 2017 (BST))
- Discuss how the distribution of energy between different modes (translation and vibration) affect the efficiency of the reaction, and how this is influenced by the position of the transition state.
Polanyi's rules relate the different favourable energy types, vibrational and translational, for each of the approaching atom and the molecule being collided with, to the position of the transition state along the reaction coordinate that result in a reactive collision. For a late transition state a reactive collision is more likely to be observed if the vibrational energy of molecule that is being collided with is large. For an early transition state a reactive collision is more likely to be observed if the translational energy of the approaching atom is large. [3]
As seen from figure 13 the reaction between H and the HF molecule is an endothermic reaction with a late transition state. The transition state is late because it is closer to the products (H2 molecule) than it is to the reactants. It can also be seen from figure 13 that the reverse reaction, F reacting with the H2 molecule, is an exothermic reaction with an early transition state. The transition state is described as early because the transition state is closer to the reactants (H2 molecule) than it is to the products (HF molecule).
Relating the example in figure 13 to Polanyi's rule one would expect that the reaction between H and HF would be more likely to go to completion if the vibrational energy of the HF molecule is large, due to the late transition state. In the reverse reaction between the F atom and the H2 molecule, the collision is more likely to go to completion if the translational energy of the approaching F atom is greater, due to the early transition state.
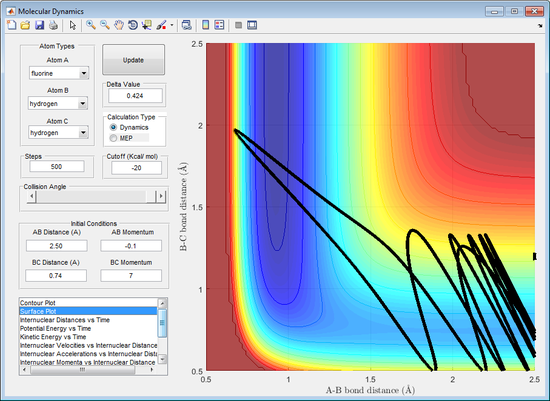
A higher vibrational energy is favoured if there is a late transition state, increasing the efficiency of the reaction. This is because largely translational energy would result in a trajectory that moves towards the transition state and moves up the wall but would not move into the product channel. The trajectory requires vibrational energy to be able to pass through the transition state to the product channel. This can be seen by figure 15.
A higher translational energy is favoured if there is an early transition state, increasing the efficiency of the reaction. This is because largely vibrational energy would result in the incoming atom being reflected back to the reactant channel. This can be seen by figure 16.

(Any examples of successful trajectories? Tam10 (talk) 15:55, 8 June 2017 (BST))
