MRD:aoz15page
Part 1ː H + H2 system
Dynamics from the Transition State Region
What value does the total gradient of the potential energy surface have at a minimum and at a transition structure? Briefly explain how minima and transition structures can be distinguished using the curvature of the potential energy surface.
The total gradient of a potential energy surface has a value of zero both at minimums and at transition structures. Note, for a function of two variables, having a total gradient of zero refers to having a partial derivative of zero with respect to both of its variable separately. i.eː a function f(x,y) will have a stationary point at a location where fx = 0 and fy = 0. This is due to both being stationary points for a function of two variables. However, they are different kinds of stationary points, with the minimum being a minimum and the transition structure a saddle point. Thus if a trajectory is started with no momentum at a position near the minimum point, it will end at the minimum point. However, if a trajectory with no initial momentum is started near the transition structure position, it will end up at either the reactants or products position. Hence this test can be used to determine whether a given point is a minimum or a saddle point for a function of two variables.
I was really enjoying your explanation until the very last part! The point about starting trajectories near the TS is a bit ad hoc. It's a good analogy (and not factually wrong), but not really a rigorous explanation. Since you were correctly discussing total gradients and first partial derivatives, why not extend that to second partial derivatives? Those have information about the curvature of a surface and are actually what's needed to give a mathematically rigorous definition of the TS. Je714 (talk) 16:33, 31 May 2017 (BST)
Locating the Transition State
Report your best estimate of the transition state position (rts) and explain your reasoning illustrating it with a “Internuclear Distances vs Time” screenshot for a relevant trajectory.
If the collision is taken to be between an atom A and a diatom BC, the transition state occurs when the bond between AB is midway through forming and that between BC is midway through breaking. At this point the system is at maximum potential energy. For a collision H with H2, the potential surface is symmetric, and so the transition state occurs when rAB = rBC. The transition state can thus be located by finding initial distances rAB and rBC such that, when the particles have no initial momentum, their internuclear distances remain constant. Through altering initial separations, an estimate for rrts of 0.908 Angstrom was made. The screenshot for the Internuclear Distances vs Time for this value is shown below (figure 1). It shows that the distances are constant over time. Good. Why are they constant, though? Je714 (talk) 16:33, 31 May 2017 (BST)

Calculating Reaction Path
Comment on how the mep and the trajectory you just calculated differ.
The minimum energy path (mep) was found by starting with both initial momenta set to zero, rAB = rrts + 0.01 and rBC = rrts. This results in a trajectory that follows the valley floor of the surface contour to the products. When these initial conditions were run with the MEP calculation type, the following surface plot was obtainedː
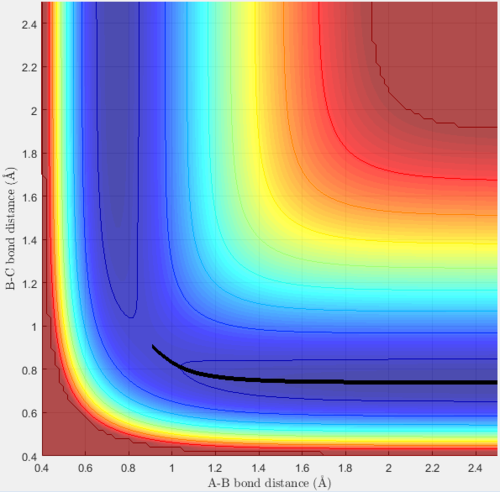
As expected, this simply shows a smooth trajectory exactly down the valley floor to the products. However, when these same conditions were run with the dynamics calculation type, the trajectory differed and the following plot was producedː
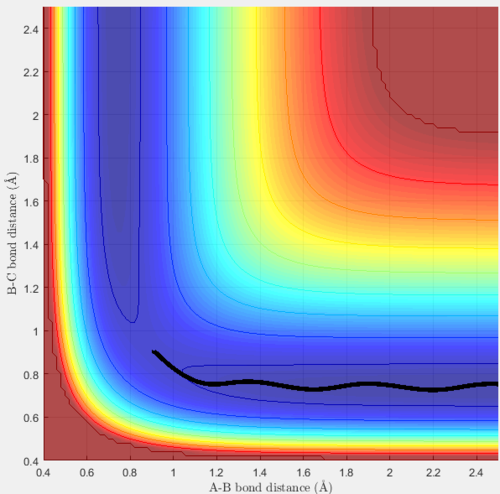
The mep and trajectory obtained differ in that only the trajectory takes into account vibrational motion; in the mep obtained, the energy stays exactly as the minimum energy of the valley and hence is a smooth line to the products. However, the trajectory takes into account vibrational motion, hence the energy oscillates about the minimum energy whilst reaching the products. This occurs due to the vibrational energy in the breaking/forming bonds, and explains the shape of the line seen in figure 3 above.
If the initial conditions rAB = rrts and rBC = rrts + 0.01 are used, the trajectory still follows the valley floor. However, it ends up at the reactants instead of the products, since it effectively 'rolls' the other way to find an energy minimum.
Fine. What's the Kinetic Energy on a MEP? What does that tell you about the velocities? Je714 (talk) 16:38, 31 May 2017 (BST)
Reactive and Unreactive Trajectories
Complete the table by adding a column reporting if the trajectory is reactive or unreactive. For each set of initial conditions, provide a screenshot of the trajectory and a small description for what happens along the trajectory.
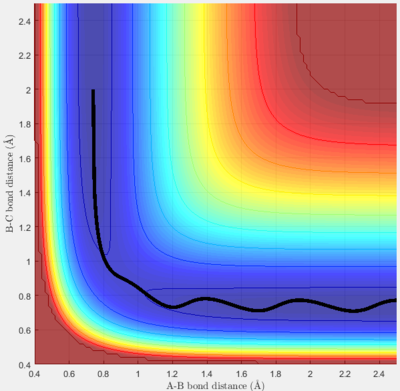
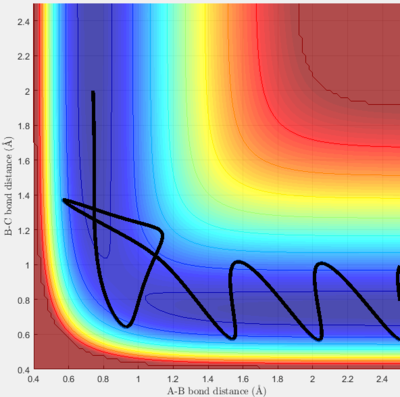
For initial bond lengths of rAB = 0.74 and rBC = 2.0, the initial momenta were varied and surface plots were found in order to determine which conditions led to reactive trajectories. The results and some discussion are found in the following table.
Transition State Theory
State what are the main assumptions of Transition State Theory. Given the results you have obtained, how will Transition State Theory predictions for reaction rate values compare with experimental values?
There are three main assumptions in Transition State Theory (TST). Before stating them, it is useful to define the terms critical diving surface and activated complex. For a given reaction potential energy surface, the critical diving surface refers to a boundary surface which passes through the surface saddle point. As such, the critical diving surface must be crossed in order for a reaction to go to completion. Any molecule whose nuclear configuration matches a point on the critical diving surface or to any point within a short distance of it is termed an activated complex. So, the saddle point of the potential surface corresponds to the equilibrium structure of the activated complex. With these terms defined, the following are the main assumptions of Transition State Theoryː firstly, that all configurations of molecules which cross the critical diving surface from the reactants side will proceed to become products. Secondly, that all reactant molecules maintain a Boltzmann-distributed energy distribution during the reaction. This leads to the third and final assumption; that the energy distribution of all activated complexes during a reaction will also be a Boltzmann distribution which depends on the system temperature.[1]
OK. Now, do the last two points make sense here? We're just simulating an isolated triatomic collision -- not an ensemble of particles. So this statistichal treatment is not applicable. Je714 (talk) 16:47, 31 May 2017 (BST)
When tested against experimentally obtained values, those found by TST are in most cases within a single order of magnitude, suggesting that the assumptions made are well placed[1]. However, there are certain aspects of reactions which TST doesn't account for. The first is barrier recrossing; since TST assumes that all molecular configurations which pass the critical dividing surface proceed to products, it cannot consider barrier recrossing, the process in which the reaction trajectory crosses the potential barrier but then recrosses it in the opposite direction. As in the fourth simulation above, sometimes barrier recrossing leads to the molecules returning to the reactants and the products not forming at all. In such a case, TST wildly misinterprets the reaction result. Even in cases where barrier recrossing occurs multiple times and the products are formed (as in the fifth simulation above), TST gives a higher reaction rate value than is experimentally obtained, since it assumes the reaction proceeds to completion as soon as the potential barrier is crossed. TST also doesn't take into account quantum effects, such as tunneling. Tunneling occurs when reactant molecules with insufficient energy to bypass the potential barrier pass through the barrier, leading to an exponential decay in their energy. This process occurs thanks to wave-particle duality, and cannot be predicted by TST[2]. However, a quantum-mechanical version of the TST was developed and showed good agreement with rate constant values for processes which involved tunneling.[1].
Good -- just to reiterate, barrier recrossing is the biggest point to be made here. Je714 (talk) 16:47, 31 May 2017 (BST)
Part 2ː F - H - H system
PES Inspection
Classifying Energetics of Reactions
Classify the F + H2 and H + HF reactions according to their energetics (endothermic or exothermic). How does this relate to the bond strength of the chemical species involved?
F + H2 → FH + Hː
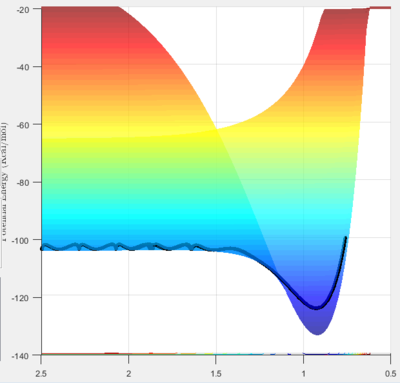
From this figure it can be seen that the products are lower in energy than the reactants, hence the reaction is exothermic and overall heat is released.
H + HF → H2 + Fː
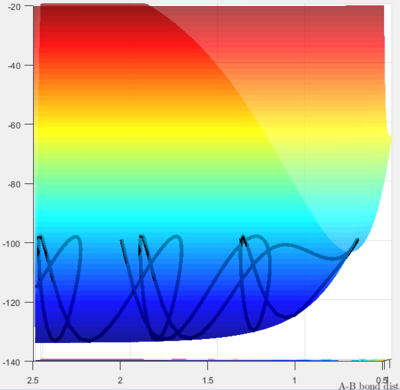
Conversely, in this case the products are higher in potential energy, and hence the reaction is endothermic.
The following values are the literature bond enthalpies for the H-H and H-F bondsː
H-Hː 435 kJ/mol [3] H-Fː 569 kJ/mol [3]
Using these bond enthalpies, the overall enthalpy change can be found for both reactionsː
F + H2 → FH + Hː 435 - 569 = -134 kJ/mol H + HF → H2 + Fː 569 - 435 = 134 kJ/mol
This confirms what the potential energy plots showed; that the first reaction is exothermic (overall heat is released) and that the second is endothermic (overall heat is taken in). This is to be expected, since the H-F bond is stronger than the H-H bond, and hence forming the H-F bond is more favourable and results in a larger energy release.
Good use of the PES to prove your points. Je714 (talk) 16:48, 31 May 2017 (BST)
Finding Transition State Positions
Locate the approximate position of the transition state.
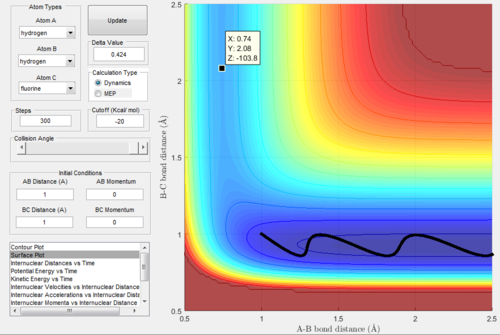
The transition state was found by initially running the trajectory with no momentum and arbitrary start bond lengths of 1 (see figure 6 below). You could've used Hammond's postulates to make a better initial guess of the TS geometry Je714 (talk) 16:48, 31 May 2017 (BST)
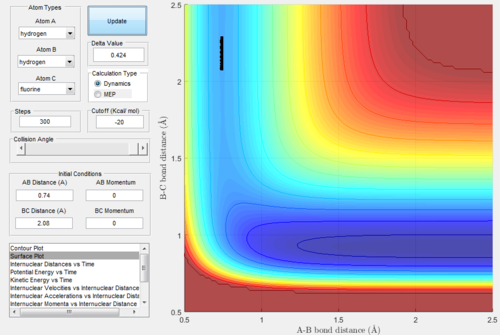
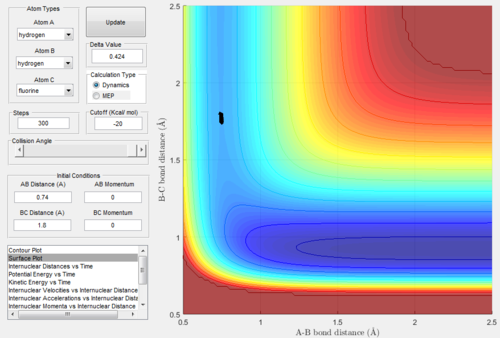
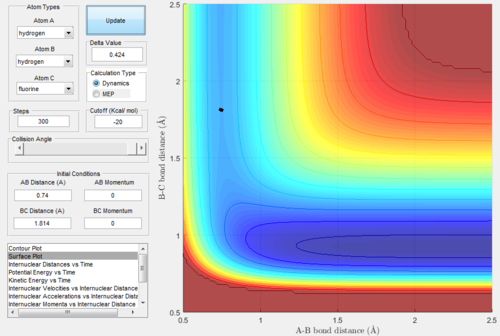
At this point, the data cursor was used to find the A-B bond length at the deepest point in the valley, which is also shown in the figure 6 below. This value for the A-B bond length was found to be 0.74 Angstrom. After this, the trajectories were run with A-B bond length as 0.74 and the B-C bond length was varied until the trajectory was a single point, which was taken to be the location of the transition state. This process of trial and error is shown in figure 7-9 below. Not every single run is shown so as not to take up too much space. From this analysis, the following bond lengths were foundː
H-Hː 0.740 Angstrom
H-Fː 1.814 Angstrom
Finding Activation Energies
Report the activation energy for both reactions.
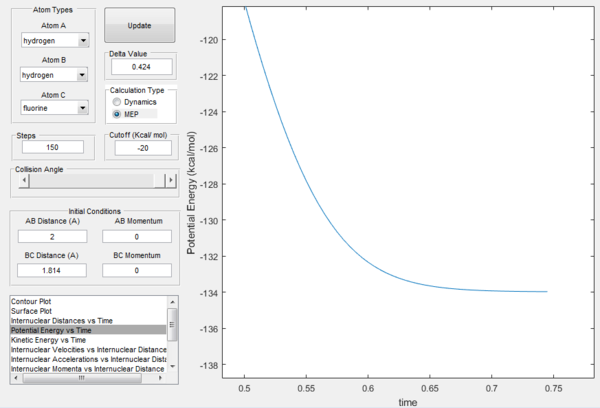
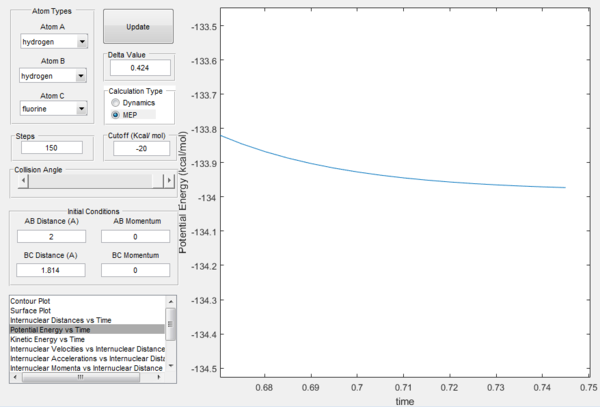
The activation energy Ea can be found by finding the energy difference between the reactants and the transition state for each reaction. From the previous part, the energy of the transition state can be found by plotting the potential energy versus time, as shown in figure 10ː
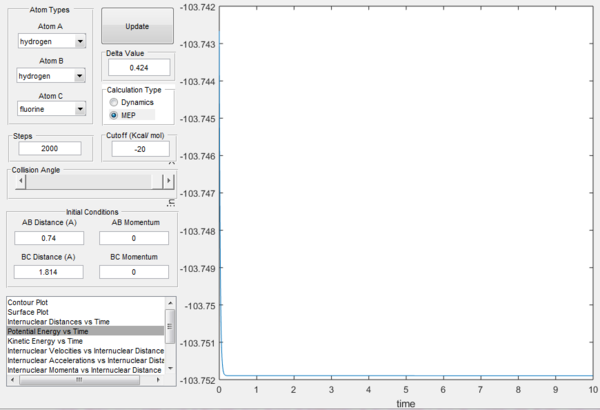
From the figure above, it can be seen that the energy of the transition state is -103.75 kcal/mol
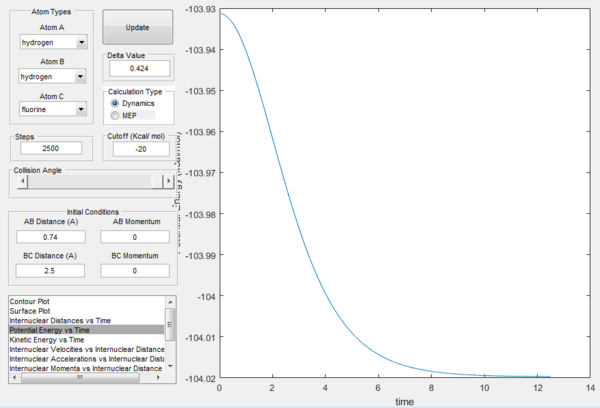
For H-F formation, the minimum energy of the reactants is -104.02 kcal/mol, as seen in the figure below. Hence the activation energy is -103.75 - -104.02 = 0.27 kcal/mol
For H-H formation, the minimum energy of the reactants is -133.97, as seen in the figure below. Hence the activation energy is -103.75 - -133.97 = 30.22 kcal/mol
Accurate values with good explanations, GJ! Je714 (talk) 16:48, 31 May 2017 (BST)
Reaction Dynamics
Released Reaction Energy Mechanism Discussion
In light of the fact that energy is conserved, discuss the mechanism of release of the reaction energy. How could this be confirmed experimentally?
The figure below shows a reactive trajectory for the F + H2 → FH + Hː reactionː

From the surface plot in figure 14 above, it can be seen that the potential energy of the reactants is higher than that of the reactants. This is to be expected since it was earlier determined that the reaction is exothermic. As of such, the potential energy is converted into other forms upon reaction. Due to this simulated reaction occurring with the F atom approaching the H2 molecule from exactly 180°, conversion into rotational energy can be discounted in this scenario. Therefore, the energy is converted into vibrational and translational energy. The conversion into translational energy is hard to discern from the plot above, but the increase in vibrational energy can be seen from the increased size of oscillations about the minimum energy path for the products compared to the reactants.
Experimentally, any heat released (thermal energy) could be measured via calorimetry. Performing IR spectroscopy with a vibrationally unexcited H-F molecule and separately with the vibrationally excited H-F obtained from the reaction would allow the comparison of the peaks, giving the vibrational energy shift between the two.
Fine discussion. Je714 (talk) 16:50, 31 May 2017 (BST)
Polanyi's Rules Discussion
Discuss how the distribution of energy between different modes (translation and vibration) affect the efficiency of the reaction, and how this is influenced by the position of the transition state.
Polanyi's rules state that a reaction with a late potential energy barrier (one in which the transition state resembles the products) is more efficiently promoted by vibrational energy than translational energy and that the converse is true for a reaction with an early potential energy barrier (one in which the transition state resembles the reactants)[4].
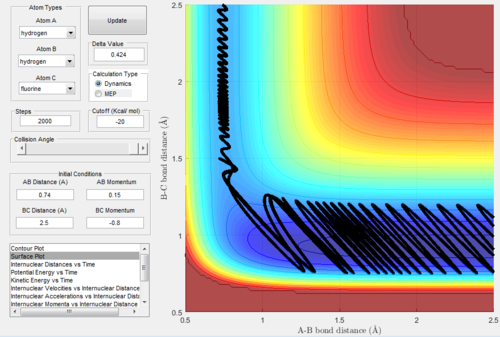
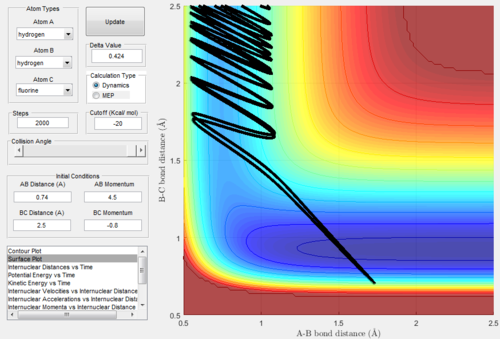
Exothermic reactions undergo an early transition state, hence via Polanyi's rules would be expected to be more efficiently promoted by translational energy. This would suggest that the F + H2 → FH + H reaction would be promoted more so by translational energy than vibrational. Figures 15 and 16 below show successful and unsuccessful cases confirming Polanyi's rules for this reactionː
Conversely, endothermic reactions have a late transition state, so the rules predicts that they will be more efficiently promoted by vibrational energy. This would suggest that the H + HF → H2 + F reaction would be promoted more so by vibrational energy than translational. Figures 17 and 18 below show successful and unsuccessful cases which confirm Polanyi's rules for this reactionː
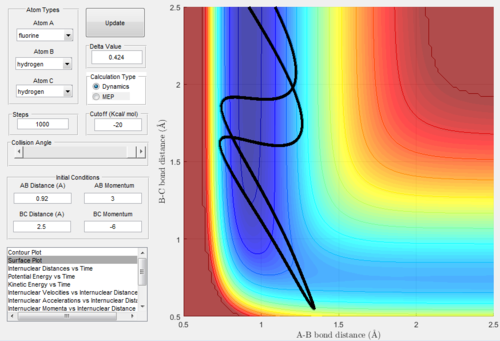
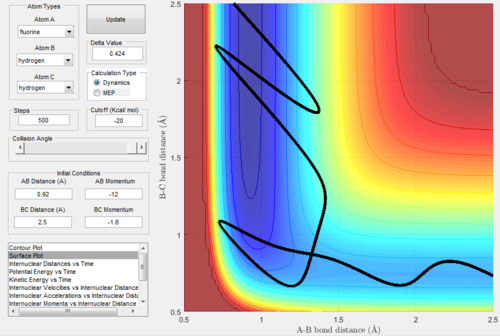
However, Polanyi's rules are not always obeyed, and sometimes act only as a guideline. For instance, figure 19 below shows a successful H + HF → H2 + F reaction with low initial vibrational energy.
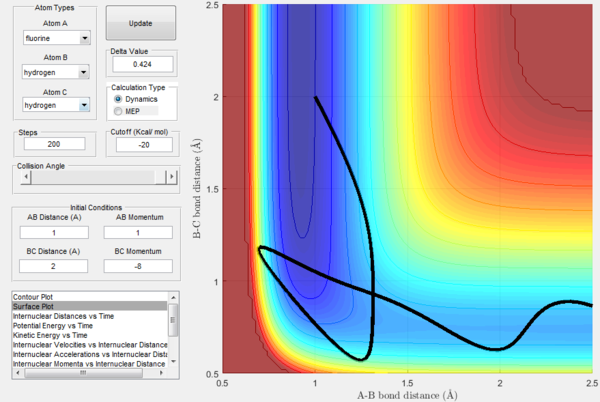
What these figures all together show is that Polanyi's rules can be a good guideline for correct conditions for reactions, since they refer to the efficiency of reactions. I.eː if many reactions with early transition states are run, having high translational energy is likely to result in more successful reactions. The converse is true for late transition states and vibrational energy.
Nice examples Je714 (talk) 16:50, 31 May 2017 (BST)
References
- ↑ 1.0 1.1 1.2 Levine, I. N., Physical Chemistry, McGraw-Hill Publishing, Sixth Edition, 2009, 887-894
- ↑ P. Atkins, J. de Paula, Atkins Physical Chemistry, Oxford University Press, 10th Edition, Chapter 21
- ↑ 3.0 3.1 M. H. Stans, Bond Dissociation Energies in Simple Molecules, Washington D.C: National Bureau of Standards, 1970, 28-32
- ↑ Z. Zhang, Y. Zhou, D.H. Zhang, Theoretical Study of the Validity of the Polanyi Rules for the LateBarrier Cl + CHD3 Reaction, The Journal of Physical Chemistry, 2012, 3416

