
MRD:anything4417
EXERCISE 1: H + H2 system
Transition States
On a potential energy surface diagram, how is the transition state mathematically defined? How can the transition state be identified, and how can it be distinguished from a local minimum of the potential energy surface?
The PE surface diagram defines the transition state as the saddle point where the gradient is 0 in orthogonal directions but is both in a minimum and maximum along different axis. ∂V(ri)/∂ri=0. It is the maximum along a reaction coordinate. The transition state is the point where the chemical structure is most unstable and has the highest free energy. It is the maximum between the two minimums of the potential energy surface and the double derivative of the potential energy function can be used to distinguish the maximum to the minimum.
Correct, but try to be more careful with your choice of words. For example, the TS is not the most unstable points, there are many points 'up the walls' that are higher in energy. It is also not the maximum between the two minimums (just draw a straight line connecting them, and you will find many other points with higher energy). Try to be as precise as possible, so nothing has to be inferred. Fdp18 (talk) 19:44, 28 May 2019 (BST)
Report your best estimate of the transition state position (rts) and explain your reasoning illustrating it with a “Internuclear Distances vs Time” plot for a relevant trajectory.
The best estimate of rts = 0.908Å. The transition state position is when rAB and rBC is identical. This value was estimated using trial and error, where there was no change in intermolecular distance for time. This can be seen in figure 2 with the plot of internuclear distance against time.
Also here: the two distances being identical is not the only criterion, as that's valid for any point on the diagonal... Fdp18 (talk) 19:46, 28 May 2019 (BST)
The plot displays two lines as the distance of AB and BC is equal and are overlapping.
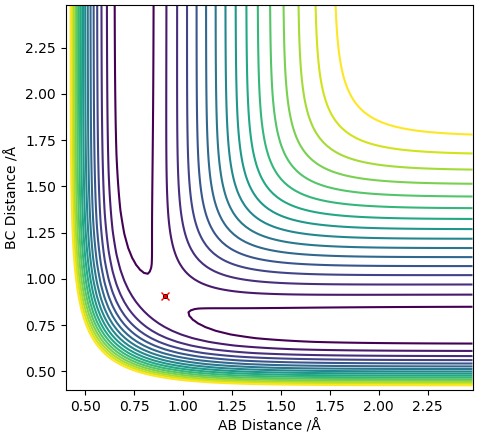
Figure 1: Contour Plot with Transition State Distance of 0.908Å in 0 Initial Momentum 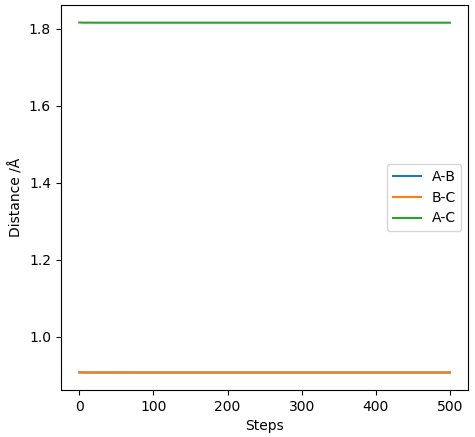
Figure 2: Plot of Internuclear Distances Against Time for a Distance of 0.908Å


Trajectories
Comment on how the minimum energy path and the trajectory you just calculated differ.
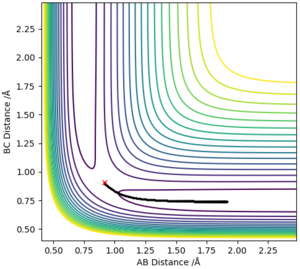
Figure 3: MEP - Contour Graph 
Figure 4: MEP - Intermolecular Distance vs. Time 
Figure 5: Dynamics - Contour Graph 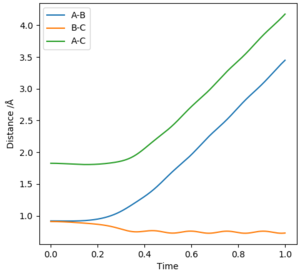
Figure 6: Dynamics - Intermolecular Distances vs. Time


MEP models the atoms in infinitely slow motion where there is no momentum. This is contrary to running the simulation in dynamics where momentum is present and there is vibrational motion. The lack of vibrational motion in MEP shows smooth lines in the graph of intermolecular distances vs. time, when the dynamics model shows a curly line depicting the vibrational motion of the atoms. The graph of intermolecular distances vs. time also shows a key difference in the two calculation types where the gradient of AB and AC is positive in the dynamics model and is slowly decreasing in the MEP model. This is due to the absence of momenta in the MEP calculation method, and thus is decelerating .
Complete the table above by adding the total energy, whether the trajectory is reactive or unreactive, and provide a plot of the trajectory and a small description for what happens along the trajectory. What can you conclude from the table?
| p1 | p2 | Etot | Reactive? | Description of the dynamics | Illustration of the trajectory |
|---|---|---|---|---|---|
| -1.25 | -2.5 | -99.02 | Yes | Atom C collides with molecule AB to form molecule BC with vibrational energy and atom A |  |
| -1.5 | -2.0 | -100.46 | No | Atom C does not have sufficient momentum to complete the displacement |  |
| -1.5 | -2.5 | -98.96 | Yes | Atom C collides with molecule AB to undergo displacement. BC has more vibrational energy than AB |  |
| -2.5 | -5.0 | -84.96 | No | Atom C collides with molecule AB to temporarily displace A, however overwhelming vibrational energy
destroys the bond and recreates molecule AB |
 |
| -2.5 | -5.2 | -83.42 | Yes | Atom C collides with molecule AB to temporarily displace A, and overwhelming vibrational energy
destroys the bond and recreates molecule AB, however the large momentum carried towards molecule AB allows atom C to displace the molecule again |
 |
State what are the main assumptions of Transition State Theory. Given the results you have obtained, how will Transition State Theory predictions for reaction rate values compare with experimental values?
The main objective of the transition state theory is to calculate the rate constant and also be able to qualitatively view chemical reactions. This theory however has several assumptions[1]:
- Born Oppenheimer approximation where nuclei-electron interactions are treated separately
- Atoms as reactants and in the transition state have energies that are Boltzmann distributed
- Molecules past the transition state can not go back to forming reactants.
- Motion in the transition state can be treated classically
- Molecules only form the transition state if a collision occurs with enough energy
Experimental values will likely be smaller due to real world effects on the reaction. Real reactions are usually in equilibrium and time is taken to reach these equilibriums.
EXERCISE 2: F - H - H system
By inspecting the potential energy surfaces, classify the F + H2 and H + HF reactions according to their energetics (endothermic or exothermic). How does this relate to the bond strength of the chemical species involved?

The potential energy surfaces (figure 7) show the H-F bond deeper in energy than the H-H bond. This indicates that the H-F bond is stronger and conversion of H-F bond to a H-H bond requires energy and the H-H to H-F reaction releases energy. Therefore:
F+H2 : This reaction is exothermic That is not an ambigous definition of a reaction, since the products are not given. I am aware that the 'sensible' reaction is again inferred, but the product could also be a system where the three atoms are all separated, or even form a triatomic molecule. Fdp18 (talk) 19:51, 28 May 2019 (BST)
H+HF: This reaction is endothermic
Locate the approximate position of the transition state.

F-H: 1.810
H-H: 0.745
Report the activation energy for both reactions.
The Hammond's postulate approximates that the transition state resembles the reactants in exothermic reactions and the product in endothermic reactions.
Activation Energies
Think carefully about the information you provide below and how you obtained it. What does a low activation barrier mean? Which one of the reactions should be the one with a lower barrier? If you simulate a MEP from a transition state to, say, HF + H, for which reaction would that give you the barrier? Fdp18 (talk) 20:07, 28 May 2019 (BST)
F + H2 -> HF + H

rHF = 1.7
rHH = 0.74
-103.78 to -133.6 = 29.862kcal/mol
HF + H -> H2 + F

rHF = 1.85
rHH = 0.74
0.0133kcal/mol
I can't see what you did here, as only the total energy is visible in your graphs above. How do you know that the reaction is complete, i.e. no further change is visible, when there is no change visible in the first place? Fdp18 (talk) 19:54, 28 May 2019 (BST)
Reaction Dynamics
In light of the fact that energy is conserved, discuss the mechanism of release of the reaction energy. Explain how this could be confirmed experimentally.
With the completion of the displacement reaction, energy is released as the H-F bond is deeper in energy and thus exothermic. The consequences of this would be that energy may be released in the form of vibrational energy and heat. To confirm the previous statement, the experiment could be monitored by a change in temperature or an IR spectrum of the product could be taken to compare the newly formed vibrational frequencies. Please read that last sentence again, and consider rephrasing it. A vibrational frequency is a concept that can't be really formed or destroyed. It is hard for the reader to understand the message you are trying to convey if its formulation is unclear, and that usually suggests the reader that you might not have understood it yourself completely. Fdp18 (talk) 19:59, 28 May 2019 (BST)
Discuss how the distribution of energy between different modes (translation and vibration) affect the efficiency of the reaction, and how this is influenced by the position of the transition state.
Polanyi's calculation showed that for reactions with a more 'early' barrier, i.e. more exothermic, the product was increasingly vibrationally excited. This indicated that endothermic reactions, with a late transition barrier, had less vibrational excitation in the products.
It is also noted that for exothermic reactions to overcome the activation energy, translational energy is most effective, while vibrational energy is more effective in endothermic reactions. In exothermic reactions, excess vibrational energies may lead to the re-formation of the initial bond.[1]