MRD:annelise
Exercise 1
On a potential energy surface diagram, how is the transition state mathematically defined? How can the transition state be identified, and how can it be distinguished from a local minimum of the potential energy surface?
On a potential energy surface diagram, the transition state (T.S.) is the point of greatest energy on the minimum energy path. This maxima is when the gradient of the potential is equal to zero and can be expressed mathematically as when . To identify the position of the transition state, trajectories can be run close to the suspected position of the T.S. with zero initial momentum, altering the conditions until the reaction does not move towards the products or reactant. This can be distinguished from any local minima because at this point rAB = rBC.
You missed a bit here. Think about curve sketching - The first derivatives give you all the extrema, i.e. the critical points (also called 'stationary points'). Some of them are minima, some maxima, some are saddle points. And some of the saddle points, those of first order, are transition states. How can you distinguish these? (hint: look up the 'Hessian') Fdp18 (talk) 13:43, 16 May 2020 (BST)
Estimate of the transition state position (rts) for .
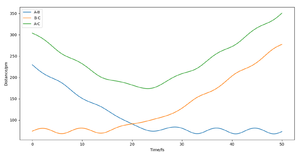
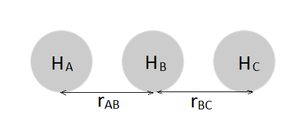
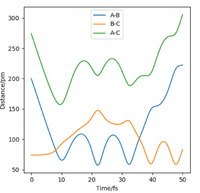
For the triatomic reaction shown to the right, the surface is symmetric[1] which means that the transition state will be located at rts, where rts = rAB = rBC. By setting pAB and pBC equal to zero, several simulations were run starting with rts = 75 pm. As rts was increased from 75 to 90 pm, the size of the oscillations decreased, whereas any increase in the internuclear distance after 91 pm, resulted in the oscillations beginning to increase in size. Therefore it was concluded that the position of the transition state lay between 90 and 91 pm. This is because a trajectory starting with no initial momentum at rts will stay at the T.S forever and so no oscillations or changed in potential would be expected. After simulating different values of rts, the position of the transition state was found to be 90.78 pm (2 d.p.). At this position the kinetic energy and forces along AB and BC are all equal to zero. The internuclear distance vs time plot below shows the reaction trajectory for rAB = 230 pm, rBC = 74 pm, pAB = -5.2 g.mol-1.pm.fs-1 and pBC = 0 g.mol-1.pm.fs-1 . The T.S. is when rAB = rBC, and so at the point where the the orange and blue lines cross on the internuclear distance vs time graph (see left). From the graph, this point looks to be between 85 and 95 pm and so my estimate of 90.78 pm seems realistic.
correct, well described. Fdp18 (talk) 13:46, 16 May 2020 (BST)
.
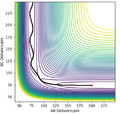
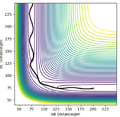
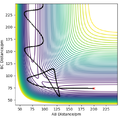
Comparing the Minimum Energy Pathway (MEP) and the trajectory you just calculated differ.
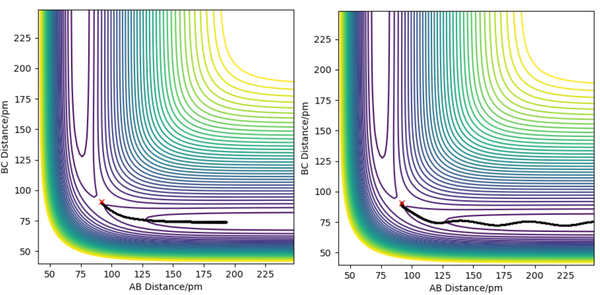
The minimum energy pathway (see right) show the reaction trajectory than requires the least amount of energy. infelicitous wording here: energy is conserved in the dynamics, so it doesn'r 'require' energy. Fdp18 (talk) 13:47, 16 May 2020 (BST)
Kinetic energy remains at 0 kJ/mol and the collision occurs from the potential energy between them alone. Once the reaction has occurred any resulting motion is due to potential energy, until the products are far enough away from each other and they become stationary. This corresponds to the minimum activation energy, but will only result in a reaction for molecules on this exact trajectory. again, rephrase carefully. The MEP is not a physical trajectory, so it will not be followed in a real system. Fdp18 (talk) 13:48, 16 May 2020 (BST)
For the dynamic trajectory calculated, kinetic energy starts at zero, however after the reaction occurs some of the potential energy is converted to kinetic energy, vibrational for the resulting molecule and translational for the atom. This vibrational excitation can be seen in the contour diagram in the figure to the right. Therefore in comparison to the MEP, the product is a molecule with vibrational energy rather than one without, and the atom possesses translational energy such that it continues to move away from the other product after the reaction rather than coming to a halt.
.
.
Complete the table above by adding the total energy, whether the trajectory is reactive or unreactive, and provide a plot of the trajectory and a small description for what happens along the trajectory. What can you conclude from the table?
| Reaction | p1/ g.mol-1.pm.fs-1 | p2/ g.mol-1.pm.fs-1 | Etot (kJ/mol) | Reactive? | Description of the dynamics | Illustration of the trajectory |
|---|---|---|---|---|---|---|
| 1 | -2.56 | -5.1 | -414.3(KE:19.5) | Y | HA , with high kinetic energy, approaches HBHC , a molecule with no vibrational energy. The collision is reactive and the resulting HAHB molecule is formed. This product has vibrational energy and so a varying bond length as it moves away from HC. | |
| 2 | -3.1 | -4.1 | -420.1(KE:13.7) | N | This reaction is unsuccessful. HA approaches the vibrationally excited molecule, HBHC , however does not get close enough to react as it does not have enough translational kinetic energy[2]. | |
| 3 | -3.1 | -5.1 | -414.0(KE:19.8) | Y | This trajectory starts with a molecule, HBHC , with low vibrational energy and upon collision with HA , results in a molecule with high vibrational energy. | |
| 4 | -5.1 | -10.1 | -357.3(KE:76.5) | N | Overall the reaction is unsucessful, however the target molecule HAHB was formed momentarily. HA approaches with high translational KE, this energy mean that the target molecule formed had so much vibrational energy that rBC never increases beyond rts. This resulted in a counter reaction where the reactants were reformed upon a second collision. This type of reaction is called barrier recrossing. Well spotted - good. Fdp18 (talk) 13:49, 16 May 2020 (BST) | |
| 5 | -5.1 | -10.6 | -349.5(KE:84.3) | Y | This reaction is similar to the one above, however with a slightly larger pAB , there is enough kinetic for one more collision to reform the products. Both reactants approach with a high translational KE and low vibrational excitement. After the collision, the molecules formed have high vibrational energy, enough to result in further reactions. By the third collision. enough energy has been lost that no more reactions take place, and molecule HAHB leaves with high vibrational excitement. |
From this table and the simulations run, it can be concluded that the success of a reaction does not simply rely on passing the minimum activation energy barrier, as too much energy can result in barrier recrossing which may lead to no reaction overall. While barrier recrossing reactions can be successful, as seen in reaction 5, it is very inefficient. Therefore alongside a minimum energy for a collision to be successful there should also be a maximum energy, after which barrier recrossing occurs. Looking at the simulations run, reaction 2 does not possess the minimum translational KE of approach and reactions 4 and 5 have too much energy for a successful and efficient reaction to take place. When comparing the two more successful reactions, 1 and 3, they both have a higher pAB , meaning a higher speed of approach to the collision, with differing levels of vibrational excitement in the reactant H2 . Reaction 2 has more vibrational energy in the starting molecule, using more KE making it a less efficient reaction than reaction 1. Reaction 2 has the same conditions of reaction 3, but with a lower translational kinetic energy in the approaching H atom, and is unsuccessful. This suggests that translational energy has a larger impact on the success of a reaction and that there is a minimum KE required for a reaction to take place.
Correct and well explained. However, "minimum and maximum energy" is not the whole story. Imagine the momentum being perpendicular to the valley - no matter how small or large, this would just lead to one of the molecules oszillating more or less heavily, but not to a reaction. Fdp18 (talk) 13:53, 16 May 2020 (BST)
Given the results you have obtained, how will Transition State Theory predictions for reaction rate values compare with experimental values?
Transition State Theory (TST) predicts the rate of a bimolecular reaction
, with the equation
[1]. TST is able to predict the rate by assuming that the system is classical, and that any trajectory where the kinetic energy along the reaction coordinate is greater than the activation energy Ea will be reactive. However as we have seen from the simulations shown above, in some cases, collisions with KE > Ea barrier recrossing (see left) can occur and the collision is overall unreactive. These unsuccessful barrier recrossing reactions are considered reactive by TST and counted towards the overall rate estimate. Therefore TST overestimates the proportion of reactive collisions and so kTST will be greater than experimental values. kTST can be considered an upper bound value for the rate constant.
If you give an equation, you also have to explain it. What are the parameters in the equation? If you don't know, then it is valid to use a simpler version of the equation, which you will easily find. Fdp18 (talk) 13:54, 16 May 2020 (BST)
Also, what you missed is the possibility of tunneling of light particles through barriers - how would that affect the reaction rate? Fdp18 (talk) 13:55, 16 May 2020 (BST)
[3]
.
.
Exercise 2
By inspecting the potential energy surfaces, classify the reactions according to their energetics (endothermic or exothermic). How does this relate to the bond strength of the chemical species involved?
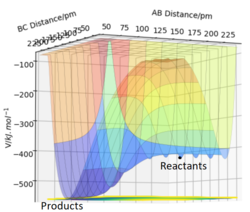
In the potential surface diagram to the right, A represents F and BC represents H2 in the reaction
. For this reaction, the plot shows that the reactants are higher energy than the products, and so the net change in energy is negative. This means the forwards reaction is exothermic, and so conversely the backwards reaction of
has a positive energy change, making it endothermic. This observation can be clearly explained when looking at the relative bond strengths of the products and reactions. Fluorine is very electronegative and so the H-F bond will be ionic and very strong, whereas the H-H bond is covalent and weaker. The table below shows the relative bond strengths and lengths of these bonds[4].
yes, but electronegativity is not the whole story. To name an example, the bond strength of N2 is 942 kJ/mol, which is much more than HF. [5] Fdp18 (talk) 13:58, 16 May 2020 (BST)
| Bond | Bond Energy
(kJ/mol) |
Bond Length
(pm) |
|---|---|---|
| H-F | 565 | 92 |
| H-H | 432 | 74 |
Therefore when forming HF, more energy is released in H-F bond formation than is required to break the H-H bond and so there is a net release in energy in this exothermic reaction. Similarly, for the reverse reaction we can predict it's endothermic nature by observing that more energy will need to be absorbed to break the H-F bond, than will be released upon H-H bond formation giving an overall increase in energy.
Locate the approximate position of the transition state
This reaction was very sensitive and difficult when it came to estimating the position of the transition state. Therefore to narrow down the range of possible values, Hammond's Postulate was used. This states that the transition state will lie towards whichever is closer in energy between the reactants and products. Therefore for an exothermic reaction such as , where the reactants are higher in energy and so closer to the transition sate, we expect the position of the T.S. to resemble the reactants. Therefore it is expected that rBC be close to the H-H bond length of 74 pm. For this reaction the surface is not symmetric and so . Using the narrowed down area of search, along with trial and error and approximate position of the transition state was found such that rAB =180.27 pm (2 d.p) and rBC = 74.51 pm (2 d.p). The T.S position can be seen in the above Figure 5, marked as a black dot.
Well done, good explanation. Fdp18 (talk) 13:59, 16 May 2020 (BST)
Report the activation energy for both reactions.

| Potential Energy
(kJ/mol) | |
|---|---|
| Reactants | -434.69 |
| T.S. | -433.98 |
| Products | -560.23 |
Having found an approximation for the position of the transition state, MEP simulations were run for both the forwards and backwards reactions. From these, the potential energy of the reactants, T.S and products were able to be found. The trajectories of these minimum energy paths can been seen in Figure 6. To calculate the activation energy, the difference between the energy of the reactants and the T.S must be found. Therefore using the numbers seen above in Table 3, the activation energy of is -433.98-(-434.69) = 0.71 kJ/mol and the activation energy for the reverse reaction, is -433.98-(-560.23) = 126.25 kJ/mol.
In light of the fact that energy is conserved, discuss the mechanism of release of the reaction energy. Explain how this could be confirmed experimentally.
Energy is released by bond formation and released by bond breaking, the energy is converted from potential energy into heat energy and dissipated into the surroundings. This could be confirmed by doing a calorimetry experiment, measuring the temperature change over the course of a reaction in solution. The temperature change at constant pressure can be linked to the energy change using q=mcΔt, where q is heat transferred (J), m is mass of solution (Kg) and t is the temperature (K).
Is there a more specific way of looking at vibrations? Think of your synthetic organic chemistry labs... Fdp18 (talk) 14:02, 16 May 2020 (BST)
Discuss how the distribution of energy between different modes (translation and vibration) affect the efficiency of the reaction, and how this is influenced by the position of the transition state.
The Polanyi Rules state that vibrational energy is more efficient for a late-barrier reaction to be successful than translational energy[6]. Of the fluorine reaction studied above, the forwards reaction has an early-barrier and the reverse reaction has a late-barrier. Therefore using this reaction as an example we can study whether these rules hold up in practise. Starting with the forwards reaction, a series of simulations were run with an energy greater than the minimum activation energy, increasing the proportion of translational energy to vibrational energy (T : V). The first reaction with the highest amount of vibrational energy on the molecule was unsuccessful due to barrier recrossing. As the vibrational energy decreased, the reactions were reactive and became more efficient, following the valley floor on the potential surface diagram more closely. This shows that translational energy is then more effective than vibrational in overcoming an early barrier. For the reverse reaction, it was found that at very low vibrational excitation, the H atom did not have enough energy to overcome the potential of the Fluorine atom. As the amount of vibrational energy increased the reactions became successful.
I like your discussion, which is very thorough here. However, I'm missing contour plots for what you describe here. It would have been really nice to see the successful and unsuccessful reactions for different T/V ratios! Fdp18 (talk) 14:05, 16 May 2020 (BST)
- ↑ 1.0 1.1 [1] https://wiki.ch.ic.ac.uk/wiki/index.php?title=CP3MD
- ↑ Atkins, de Paula, Keeler: Physical Chemistry, 11th Edition.
- ↑ Tuckerman M. 28.8: Transition-State Theory Can Be Used to Estimate Reaction Rate Constants
- ↑ Common Bond Energies
- ↑ Common Bond Energies
- ↑ Zhang, Z. Zhou, Z. Zhang, D H. Czakó, G. Bownman, J M. Theoretical Study of the Validity of the Polanyi Rules for the LateBarrier Cl + CHD3 Reaction

