MRD:ambs1015
Molecular reaction dynamics
by Alastair Smith
Exercise 1: H + H2 system
Q1
What value does the total gradient of the potential energy surface have at a minimum and at a transition structure? Briefly explain how minima and transition structures can be distinguished using the curvature of the potential energy surface.
A1.
The transition structure is defined as a saddle point in the potential energy surface. Therefore, the gradient is zero at the potential energy surface minima and transition structure (maximum). Starting at a minima in the potential energy surface plot, a small change in geometry towards the reactants/products will lead to a small increase in potential energy towards the reactants or products respectively. This will be followed by a decrease in the potential energy back to the minima as the plot shows the curve as being a 'well'. For a transition state, which is an energy maxima, a small change in geometry towards the reactants/products will cause the trajectory to 'roll' towards the reactants/products respectively. In order to distinguish between the two, a second derivative must be taken which would give a value >0 for the minimum and a value <0 for the transition state minimum.[1]
Nf710 (talk) 12:39, 9 June 2017 (BST) This is only true in 1 coordinate. which is the reaction coordinate. This is the reaction coordinate. this is options by linearly combining r1 and r2
Q2
Trajectories from r1 = r2: locating the transition state. Report your best estimate of the transition state position (rts) and explain your reasoning illustrating it with a “Internuclear Distances vs Time” screenshot for a relevant trajectory.
A2
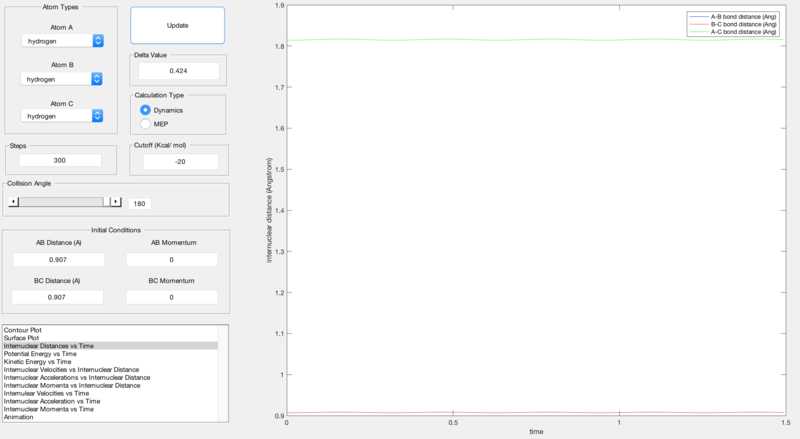
The points at which the potential energy vs. internuclear position maximum and minimum points intersected are shown below by the values of r1 and r2:
| r1/Å | r2/Å | r(ts)/Å |
|---|---|---|
| 1.40 | 1.40 | 0.907 |
| 2.25 | 2.25 | 0.907 |
At the transition state, r1 must equal r2 as this is a property of a transition state. Therefore, as shown by figure 1 below, analysis of the proposed 0.907 Å transition state shows very little oscillation about the internuclear distance and hence proves that this is the transition state.
Q3
Calculating the reaction path. Trajectories from r1 = rts+δ, r2 = rts. Comment on how the mep and the trajectory you just calculated differ.
A3
Setting the program to MEP means that the masses of the atoms in the system are not taken into account, as opposed to setting it to Dynamics where masses are taken into account. With MEP selected, the reaction path plot shows an oscillation as opposed to a smoother reaction path when Dynamics is selected. Furthermore, when MEP is selected, only the transition state appears in the surface plot whereas with dynamic selected, the reaction trajectory is longer.
Q4
Complete the table by adding a column reporting if the trajectory is reactive or unreactive. For each set of initial conditions, provide a screenshot of the trajectory and a small description for what happens along the trajectory.
A4
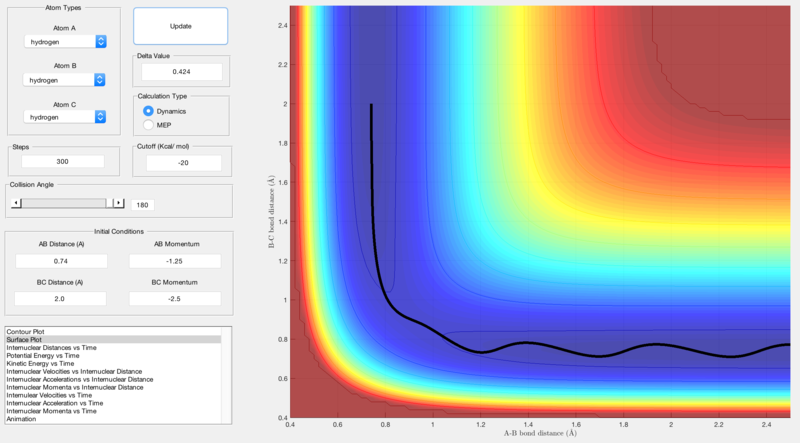
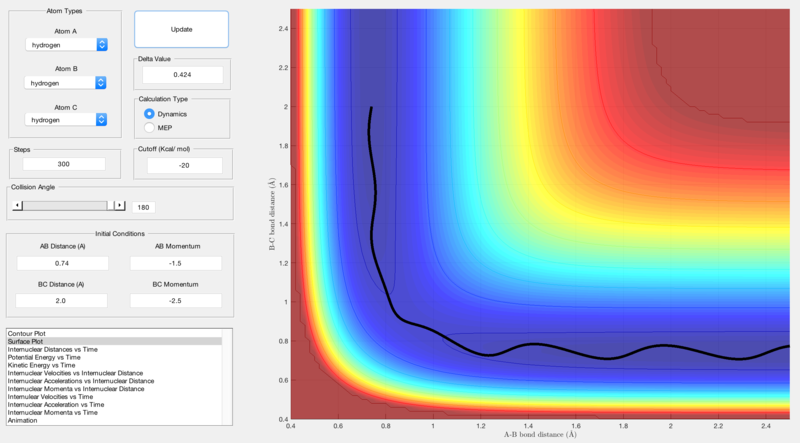
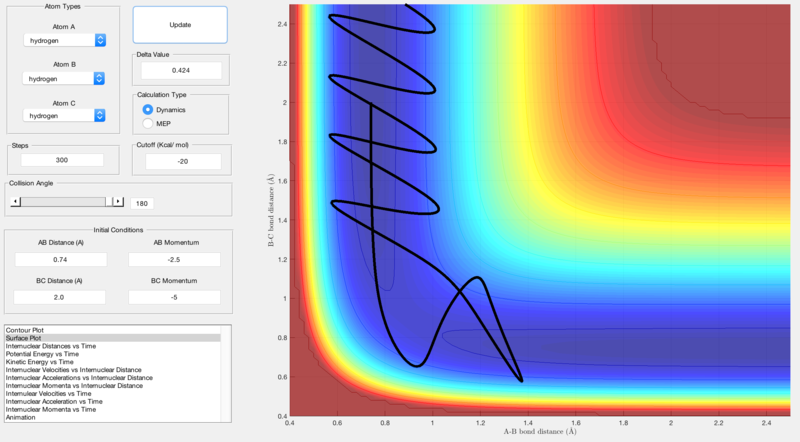
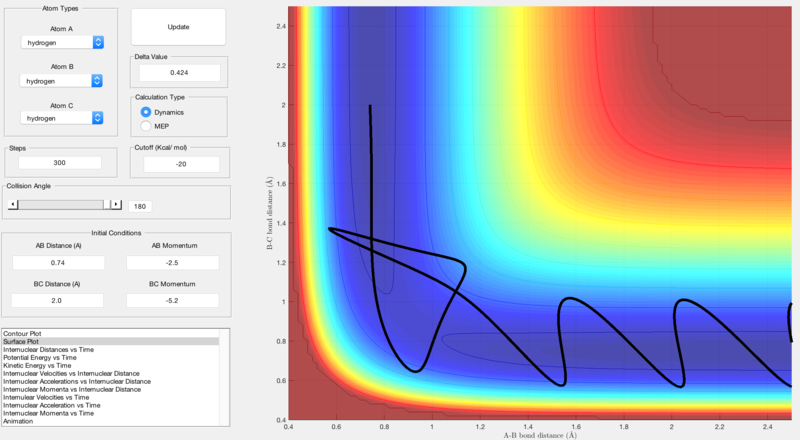
Reactive and unreactive trajectories were obtained using initial positions r1 = 0.74, r2 = 2.0 and by changing the momenta input:
| p1 | p2 | Result | Figure |
|---|---|---|---|
| -1.25 | -2.5 | Reactive | Figure 2 |
| -1.5 | -2.0 | Unreactive | Figure 3 |
| -1.5 | -2.5 | Reactive | Figure 4 |
| -2.5 | -5.0 | Unreactive | Figure 5 |
| -2.5 | -5.2 | Reactive | Figure 6 |

Q5
State what are the main assumptions of Transition State Theory. Given the results you have obtained, how will Transition State Theory predictions for reaction rate values compare with experimental values?
A5
Clasically, Transition State Theory states that an atom will react with a molecule upon approach, given there is enough energy to overcome the activation barrier. The classical Transition State Theory predictions will give low reaction rate values as it does not take into account quantum mechanical effects that can provide an alternative reaction pathway. This could be achieved through quantum tunneling whereby the atom and molecule may not have enough energy to classically react but they can 'tunnel' through the activation barrier to react. This is due to the particles having wave-like properties.
Quantum mechanics also allows for reactions to occur without sufficient energy as the classical 'saddle point' associated with the transition state on potential energy surface plots can be avoided and an alternative reaction path is followed. Figure 6 highlights this as the reactants reach the transition state but after this, the reaction trajectory falls back towards the reactants before proceeding to the products, showing that an alternative path has been followed around the transition state saddle point.
Another assumption of TST is that the activated complex present in the transition state is always in quasi-equilibrium with the reactants. This is due to very small molecular driving forces that would alter the system slightly, resulting in an internal equilibrium.[2]
Exercise 2: F - H - H system
Q6
Classify the F + H2 and H + HF reactions according to their energetics (endothermic or exothermic). How does this relate to the bond strength of the chemical species involved?
A6
Energy released on forming H-F bond: 565 kJ/mol [3]
Energy required to break H-H bond: 432 kJ/mol [3]
ΔE= E(bonds broken) - E(bonds made)
-Therefore the reaction between F + H2 is exothermic as more energy is released on forming the new H-F bond compared to breaking the H-H bond, giving a negative value of -133 kJ/mol.
-The reaction between H + HF is endothermic as more energy is required to break the H-F bond compared to the energy released on forming the new H-H bond, giving a value of 133 kJ/mol.
This shows that the H-F bond is much stronger than the H-H bond.
Q7
Locate the approximate position of the transition state.
A7
The approximate position of the transition state was found by locating the radii at which the total energy of the system is stationary due to the absence of a net force acting on the atoms. At this point, the internuclear distance against time plot will show constant internuclear separations as seen in Figure 7:
r(H-H) = 0.74 Å
r(H-F) = 1.815 Å

Q8
Report the activation energy for both reactions.
A8
To find a suitable reaction trajectory, chemical intuition (e.g fluorine is 9 times heavier than hydrogen) and trial and error were employed.
Reaction 1: F + H2 ---> H + HF
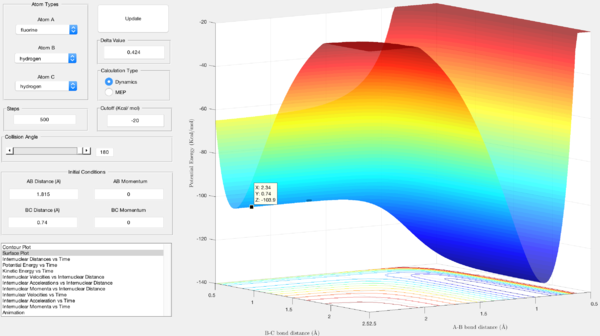
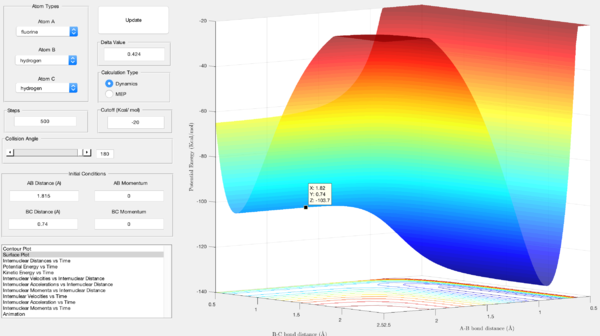
For the exothermic reaction, the activation energy was found to be the difference in energy between the reactants and the transition state. The energy of the reactants is shown by the z-axis value in figure 8, that of the reactants is the z-axis value in figure 9:
- Ea = -103.7 - (-103.9) = 0.2 Kcal/mol
Reaction 2: H + HF ---> F + H2
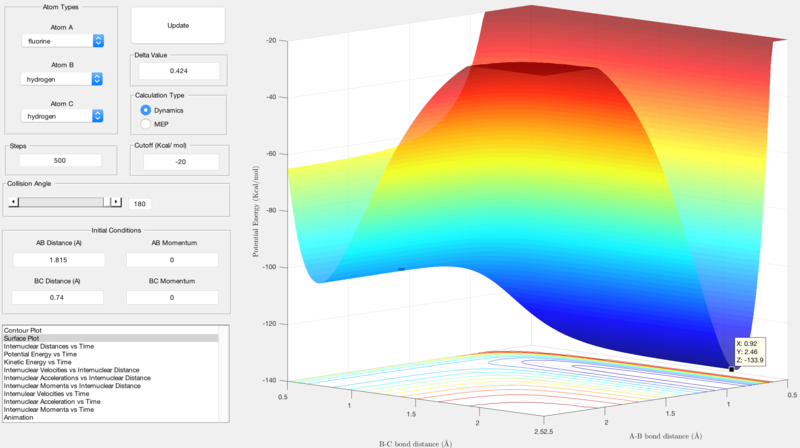
For the endothermic reaction, the activation energy is calculated by finding the difference in energy between the products and the transition state. The energy of the transition state is shown by the z-axis value in figure 9, the energy of the products is shown by the z-axis value in figure 10:
- Ea = -103.7 - (-133.9) = 30.2 Kcal/mol
Q9
Reaction Dynamics.
In light of the fact that energy is conserved, discuss the mechanism of release of the reaction energy. How could this be confirmed experimentally?
A9
The law of conservation of energy states that the total energy in a system must be conserved.[4] The total energy of this particular reaction system is given by the sum of the potential and kinetic energies of each entity involved in the reaction.
Nf710 (talk) 12:59, 9 June 2017 (BST) kenetic energy is only given when things are moving. The energuy of reaction is given by finding the difference in potential energies.
The products potential energy is lower than the reactants in the case of F + H2 which consequently means that the products must have higher kinetic energy than the reactants. This can be seen through a plot of kinetic energy against time which shows an increase in the kinetic energy of the products compared to the reactants in figure 12. These energies are based on the reaction pathway shown in figure 11.

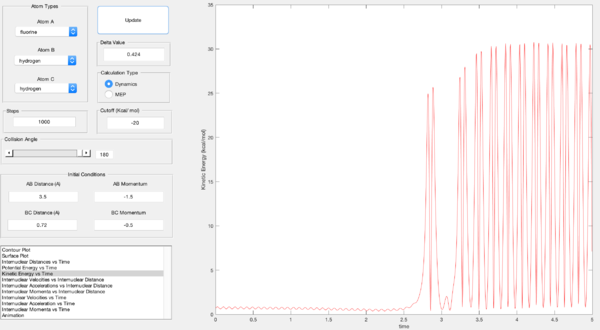
The products have a high kinetic energy which allows them to be detected by IR analysis due to oscillation of the bond and a release of vibrational energy. The product IR spectrum will show an H-F peak meanwhile the H-H vibrational peak in the reactant IR spectrum will disappear. Another experimental technique may be to use calorimetry at constant pressure. This would result in the change in heat energy between the reactants and products being equal to the change in enthalpy and hence the change in free energy of the system.
Q10
Discuss how the distribution of energy between different modes (translation and vibration) affect the efficiency of the reaction, and how this is influenced by the position of the transition state.
A10
Trial and error were used to calculate a successful reaction trajectory and the parameters used can be seen in the figures below.
Reaction 1: F + H2 ---> H + HF
For the exothermic reaction, increasing the BC momentum parameter lead to a higher translational motion for the reactants. According to Polanyi's rules, translational energy is more efficient than vibrational energy in the activation of early barrier reactions (early transition states).[5] An early transition state will resemble the reactants more closely according to Hammond's postulate. [6] Figure 13 and figure 14 illustrate this and the more favored early transition state due to the fact that when the set of reaction trajectories reach the transition state, they bounce back towards the reactants. These are examples of 'inefficient' reactions as the activation barrier is crossed several times before product formation occurs.


Due to the exothermic nature of the reaction, classic TST breaks down due to the higher temperatures involved. According to TST, the transition state occurs at the lowest energy saddle point. At higher temperatures, higher vibrational modes are populated which means that transition states are formed at different energies other than the saddle point. As a result of this, the reaction trajectory travels through different activated complexes at different energies, resulting in difficult analysis of the reaction model and making results hard to compare.
Reaction 2: H + HF ---> F + H2
Reaction 2 is the reverse of reaction 1 and hence is endothermic. This means that the energy of the products is higher than the reactants and according to Hammond's postulate, this results in a late transition state that resembles the products more closely.[6] Therefore, contrary to reaction 1 and in accordance with Polanyi's rules, an increase in vibrational energy will favour the late transition state. In this case, a more efficient reaction can be achieved through an increase in bond length and hence a decrease in vibrational energy; this would lead to the set of reaction trajectories passing through the activation barrier fewer times.
Nf710 (talk) 13:18, 9 June 2017 (BST) Longer bond length? Other than that good undestanding of Polyanyis rules otherwise, you didnt show the endo reaction either
References
<references> [1] [2] [3] [4] [5] [6]
- ↑ 1.0 1.1 Lewars, Errol G. Computational Chemistry: Introduction To The Theory And Applications Of Molecular And Quantum Mechanics. 1st ed. pp. 16-17. Springer Science & Business Media, 2010. [Accessed 11 May 2017]
- ↑ 2.0 2.1 Physicsoftheuniverse.com. (2017). Quantum Tunnelling and the Uncertainty Principle - Quantum Theory and the Uncertainty Principle - The Physics of the Universe. [online] Available at: http://www.physicsoftheuniverse.com/topics_quantum_uncertainty.html [Accessed 11 May 2017]
- ↑ 3.0 3.1 3.2 Wiredchemist.com. (2017). Common Bond Energies (D. [online] Available at: http://www.wiredchemist.com/chemistry/data/bond_energies_lengths.html [Accessed 11 May 2017]
- ↑ 4.0 4.1 Atkins, P. W, and Julio De Paula. Physical Chemistry. 9th ed. pp.44. 2010. [Accessed 11 May 2017]
- ↑ 5.0 5.1 Czako, G., and J. M. Bowman. "Dynamics Of The Reaction Of Methane With Chlorine Atom On An Accurate Potential Energy Surface". Science 334.6054 (2011): 343-346. Web. [Accessed 11 May 2017]
- ↑ 6.0 6.1 6.2 "Hammond’s Postulate In Organic Chemistry Reactions — Master Organic Chemistry". Masterorganicchemistry.com. 2017. Web. [Accessed 11 May 2017]
