MRD:am8616
H + H2 system
Q1: What value do the different components of the gradient of the potential energy surface have at a minimum and at a transition structure? Briefly explain how minima and transition structures can be distinguished using the curvature of the potential energy surface.
By examining the derivatives of the potential energy with respect to r1 (distance between atom A and molecule BC) and with respect to r2 (distance between the newly made molecule AB and atom C) on the Potential Energy Surface (PES), one can gain an insight into where key parts of a reaction lie on the plot. For example, in the potential energy plot, Figure 1, the reactant, transition intermediate and product can be found at the points where the derivatives are equal to 0.
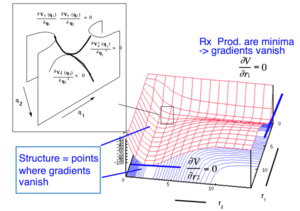
Distinguishing between the minima and the transition state can be achieved by taking the derivative of the potential energy surface. A minima will be present if the derivative is greater than 0 in both r1 and r2 directions. A transition state will be found at the locations where the derivative is negative in one direction and positive in the other. This is known as a saddle point.
Ng611 (talk) 19:35, 24 May 2018 (BST) What are the relevant directions in an energy diagram?
Q2: Finding the transition state position on a potential energy surface.
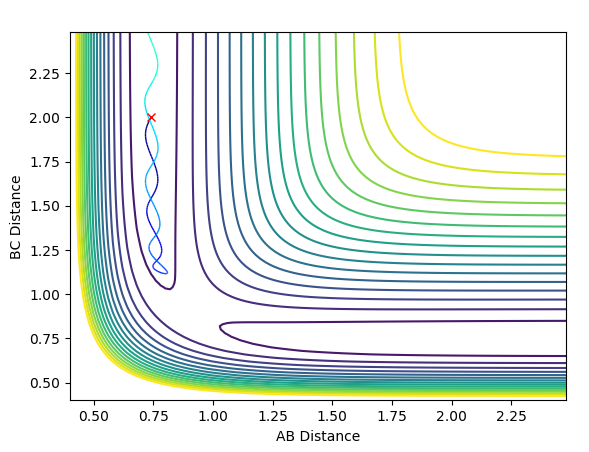
To find the transition state position, we need to find a point at which r1 = r2, the momenta p1 = p2 = 0 and the bond will be vibrating along the saddle point without falling down towards the minima of the surface. This is first approximated by plotting an Internuclear Distances vs Time plot with initial conditions. The point at which the lines cross each other represents the point at which the AB distance is equal to the BC distance which is our transition state position. See Figure 2 below.
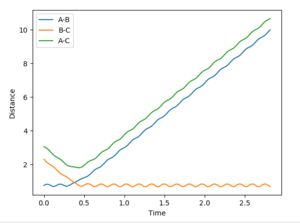
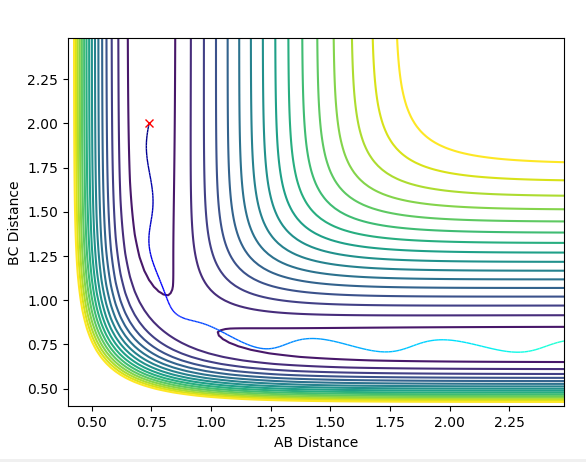
The initial estimate value of the transition state position was found to be 0.911Å. When setting r1=r2=0.911Å it was seen that after a few oscillations, the trajectory moved off the ridge and moved towards the reaction minima (see Figure 3).

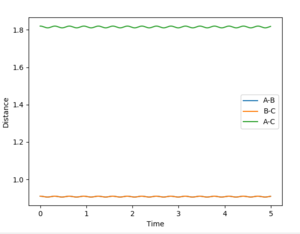
After optimising, the transition state position was found to be 0.9100635Å. Setting r1=r2=0.9100635Å and p1=p2=0, the following Internuclear Distances vs Time plot confirmed this as the transition state position as the trajectory only oscillated along the saddle point and did not fall off the ridge (see Figure 4).
Q3: Comment on how the mep and the trajectory you just calculated differ.
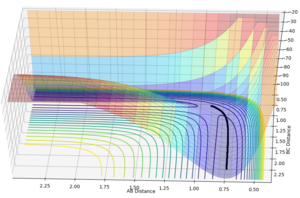
Examining the surface plot with the calculation type as mep and the calculation type as dynamics we can see that the trajectories are distinctly different. The mep calculation type finds the lowest energy route of reaction which can be seen on Figure 5 as following the minima at the valley floor. Comparing this to the dynamics reaction type, we can see that the route takes into account the vibrations of the bond seen by the oscillations in the reaction path.
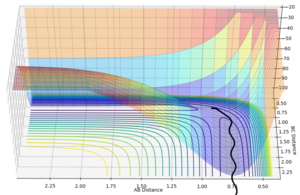
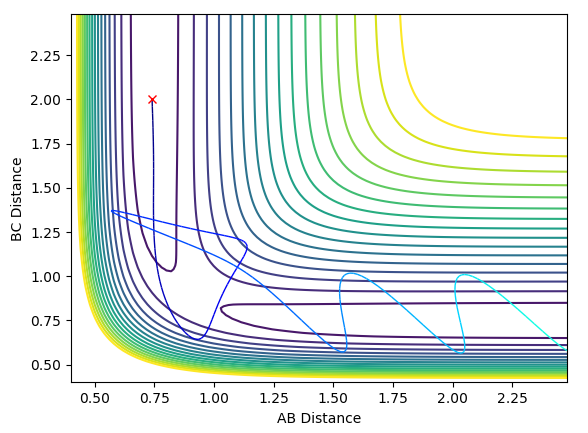
The internuclear distance vs time plot (Figure 7) shows that when the initial trajectory is perturbed by a small amount (+0.01Å), the reaction doesn't occur as the reaction path goes down to the reactant side. Therefore the AB distance increases as the atom A and the molecule BC get further apart.
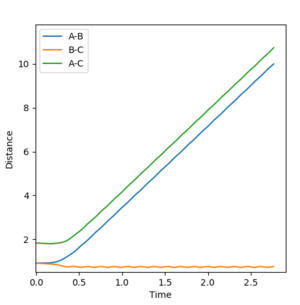
The final positions were determined to be, r1(t)=9.9529 Å and r2(t)=0.757991 Å
The internuclear momentum vs time plot (Figure 8) also shows that when the initial trajectory is perturbed by a small amount (+0.01 Å), the reaction doesn't occur as the reaction path goes down to the reactant side. Analysing the plot, we can see that as time elapses, the momentum of the hydrogen atom A increases to a larger value of momentum as it moves further away from the H2 molecule BC. Once A and BC are far enough apart from each other that they have no influence on eachother, the values of p1 and p2 begin to plateau. p2 oscillates as the momentum changes from the vibration of the molecule. As p1 is the momentum of a single atom, there is no oscillatory motion, therefore the momentum remains constant once it begins to plateau.

The final momenta were found to be; p1(t)=2.47962 p2(t)=1.28791.
If we were to set r1=ts and r2=ts + 0.01, the reaction proceeds as the reaction path heads to the products. The values of r1, r2, p1 and p2 will swap around but will be the same values as the case studied before.
Q4: Complete the table by adding a column with the total energy, and another column reporting if the trajectory is reactive or unreactive. For each set of initial conditions, provide a plot of the trajectory and a small description for what happens along the trajectory.
Q5: State what are the main assumptions of Transition State Theory. Given the results you have obtained, how will Transition State Theory predictions for reaction rate values compare with experimental values?
Transition State Theory [1]:
1) Once the transition state has been passed and the molecular system moves towards the products, the reactants can not be reformed.
2) In the Transition State, motion along the reaction coordinate may be separated from other motions and treated classically as a translation
3) Even in the absence of an equilibrium between reactant and product molecules, the transition states which are becoming products are distributed among their states according to the Maxwell-Boltzmann Laws.
Statement 1 of transition state theory does not agree with the contour plots above. Plot 4 passes the transition state but ends up reverting back to the reactants and plot 5 recrosses the transition state before crossing again back to the products. Using transition state theory, plot 4 would have been predicted to have crossed the transition state and not come back. Therefore in this case, the reaction rate values would be over estimated. Transition state theory also says that quantum tunneling does not occur in the reaction, whereas in reality this does apply. Therefore for this scenario, the reaction rate will be under determined as the reaction can occur from tunneling.
Ng611 (talk) 19:38, 24 May 2018 (BST) Whilst tunnelling does have an effect here, the dominant effect is due to transition state recrossing and thus TS theory overestimates the rate. Well done for mentioning both though.
EXERCISE 2: F - H - H system
Q6: Classify the F + H2 and H + HF reactions according to their energetics (endothermic or exothermic). How does this relate to the bond strength of the chemical species involved?
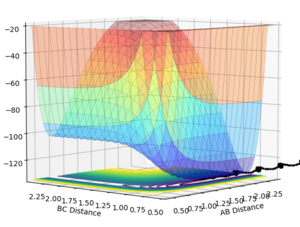
Using a surface plot, it is clear to see that the reaction is exothermic as the reactants are of higher energy than the products. As the products are lower in energy, the difference in energy has been put into bond making which means that the products have stronger bonds.
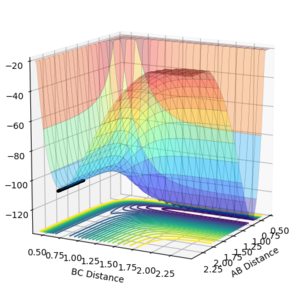
Using the same procedure, we can see that the reaction is endothermic as the products are higher energy than the reactants. As the reactants are lower in energy, the difference in energy has been released into the system as vibrational energy and heat. The products are higher in energy, therefore the bond strength of the product molecule will be weaker.
Q7: Locate the approximate position of the transition state.
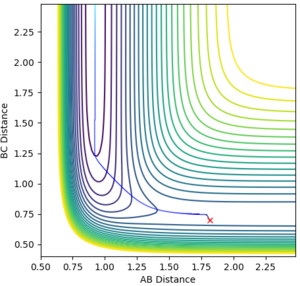
This reaction is exothermic, therefore using Hammond's postulate we know that the transition state is early, the transition state is near the reactants and the transition state structure will resemble the reactants structure. Using this postulate, the first approximation to find the transition state can be if we set r2 as the H2 bond length from Section 1 (0.74Å). As H-H-F isn't symmetric, we can't set r1=r2 as r1 will be larger. Setting r1 as 1.88Å, examining the contour plot (Figure 9), we can see that the molecule oscillates towards the reactants, so the transition state must lie to the left of this point. Doing the same process with r1 set as 1.78Å, the contour plot (Figure 10) shows that the transition state must lie to the right of this point. After trialing many different r1 values, the optimised coordinates for the transition state from the contour plot (Figure 11) were determined to be r1 = 1.81355Å and r2 = 0.74Å.


After trialing many different r1 values, the optimised coordinates for the transition state from the contour plot (Figure 11) were determined to be r1 = 1.81355Å and r2 = 0.74Å.
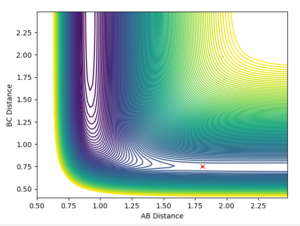
The same process was repeated for HF + H and because this reaction is the reverse of the one above, we can immediately say the transition state will also be in the same location but with r1 and r2 swapped around.

Q8: Report the activation energy for both reactions.
To find the activation energy of the reactions, the system needs to be perturbed from the transition state slightly. Using the mep calculation type, by slightly increasing the BC bond distance, we cause the system to fall back to the H2 + F side via the lowest energy route (Figure 15). By plotting an Energy vs Time plot (Figure 16), at t=0, the system is at the transition state and the system quickly collapses to the H2 + F side, therefore by measuring the difference in energy, you can obtain a value for the activation energy for the H2 + F. Following the same procedure but this time decreasing the BC bond distance, we find the system moves from the transition state to the H + HF side (Figure 17). Once again, plotting an energy vs time graph (Figure 18) and measuring the differences in energy, we find the activation energy for the H + HF reaction.
| Figure 15 | Figure 16 | Figure 17 | Figure 18 |
|---|---|---|---|
 |
 |
 |
 |
Measuring this difference in energy, the activation energy for H2 + F = 0.739 Kcal/mol (distances AB=1.81355 BC=0.8) and for HF + H = 30.091 Kcal/mol.
Q9: In light of the fact that energy is conserved, discuss the mechanism of release of the reaction energy. How could this be confirmed experimentally?
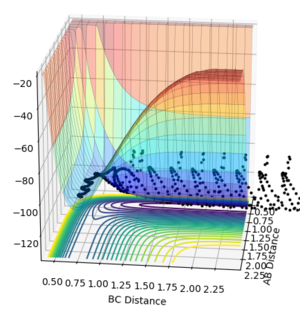
Using r1= 2.11 Å and r2 = 0.74 Å (H-H bond distance) and p1=-2.45 and p2=-2.1 for the reactive trajectory, we can see that as the reactants pass the transition state they gain kinetic energy. From the surface plot (Figure) we can see that the reaction path for the products oscillates high up the potential surface compared to the reactants which has light oscillations, indicating that the product molecule has a higher vibrational energy. Therefore we can say that the mechanism for energy release of the reaction comes from potential energy converting to kinetic energy.
Increased vibrational energy will result in a temperature rise, so experimental techniques such as calorimetory for this reaction to show that the temperature has risen.
Ng611 (talk) 19:40, 24 May 2018 (BST) True, but increases in temperature can also occur due to enhanced translational kinetic energy. Is there a method that would allow you to distinguish between translational and vibrational KE?
Q10: Discuss how the distribution of energy between different modes (translation and vibration) affect the efficiency of the reaction, and how this is influenced by the position of the transition state.
Polanyi's Rules state the vibrational energy is more efficient at promoting a late barriered reaction. The opposite is also true that translational energy is more efficient at promoting an early barriered reaction.
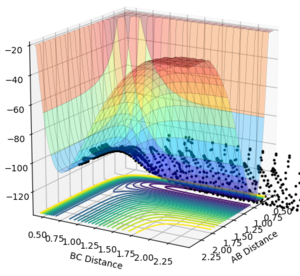
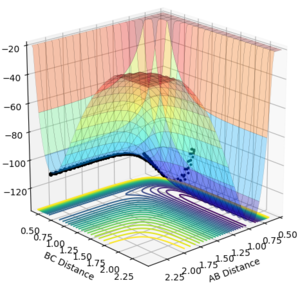
From the cases studied above, the reaction between H2 and F is an early transition state, as the reactants are similar in energy to the transition state. Using the programme, it can be experimentally shown that for a constant vibrational energy but elevated translational energy, that the reaction is more efficient. For a large translational motion (p(AB)=-3, p(BC)=-0.4) we can see from the graph we can see that a reaction occurs (Figure 20). If the translational momentum is lowered and the vibrational momentum is increased, no reaction is observed (Figure 21). Finally, for small translational and vibrational motion results in no reaction either (Figure 22).
| Large Translational | Small Translational + Large Vibrational | Small Translational + Small Vibrational |
|---|---|---|
 |
 |
 |
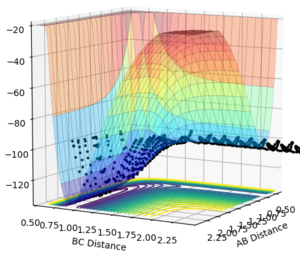
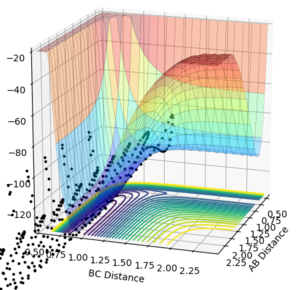
Conversely, the HF + H reaction is a late transition state therefore an increased vibrational momentum results in a higher reaction efficiency. For a large vibrational momentum (p(AB)=-0.5 p(BC)=-3), we can see that polanyi's rules are obeyed as the reaction occurs (Figure 23). Varying the momenta, if translational momentum is increased but vibrational momentum is kept low no reaction is seen (Figure 24). The same result is observed if the translational momentum and vibrational momentum is kept low (Figure 25).
| Large Vibrational | Large Translational + small Vibrational | Small Translational + Small Vibrational |
|---|---|---|
 |
 |
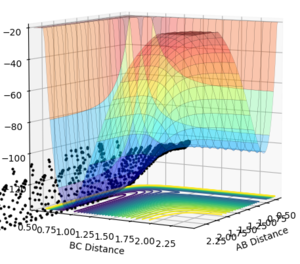 |
These results all confer with Polanyi's rules, showing that distributing the energy more towards the vibrational modes will favour a late transition stated reaction and that distributing the energy more towards the translational modes will favour an early transition stated reaction.
Ng611 (talk) 19:42, 24 May 2018 (BST) Good section and good report. Well done.
References
[1] Steinfeld, J.I., Francisco, J.S. and Hase, W.L., 1989. Chemical kinetics and dynamics (Vol. 3). Englewood Cliffs (New Jersey): Prentice Hall.
[2] 张兆军, 周勇 and 张东辉, 2012. Theoretical Study of the Validity of the Polanyi Rules for the Late-Barrier Cl+ CHD3 Reaction.


