MRD:alexferre
Alexandre Van Bronkhorst Ferreira's MRD Wiki Page
Distinguishing Minima from Transition Points
The gradient of all components of both minima and transition structures is 0. they can be distinguished from each other by considering the second partial derivatives of those points.
For a minimum point (and a maximum point),
For a saddle point (transition structure),
Locating the Transition Structure
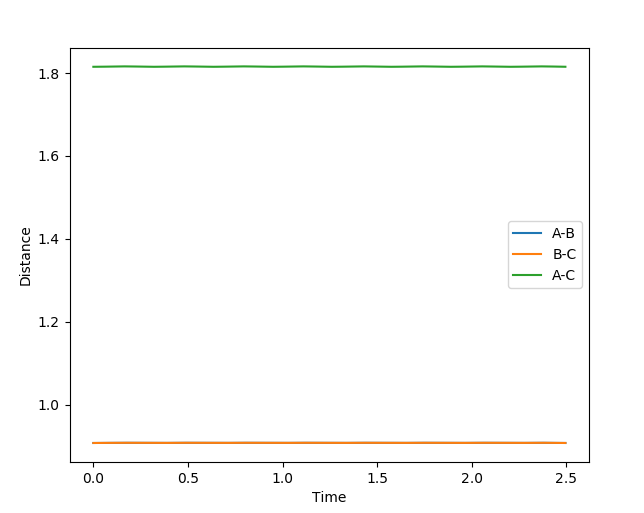
The value found is at r=0.9075. the internuclear distance vs. time plot is shown below:
The plot demonstrates that this is the correct transition state position because there is no change in the internuclear distance with time. the distance between atoms A and B, as well as B and C are constant and lie at 0.975, while the AC distance is also constant and sits at twice the AB and BC distance.
Difference Between MEP Calculation and Dynamics Calculation
The calculation carried out under MEP shows the trajectory proceeding with no oscillation to an increased BC distance, indicating the formation of molecule A-B and atom C. The same initial conditions calculated under Dynamics shows the same trajectory but, as the speed of the atoms is not reset to 0 after each step, this calculation shows the oscillation in the A-B bond as the molecule travels away from atom C.
Ng611 (talk) 19:55, 24 May 2018 (BST) Good! I would back this up with some contour plots though.
Analyzing Reactive and Unreactive Pathways
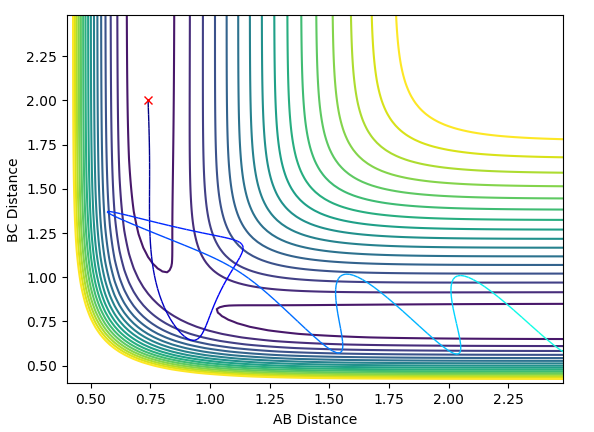
The A-B distance was set at 0.74 and the BC distance at 2.00. from these initial positions, 5 different sets of initial momenta were tested. the results of the tests are shown below.
| Case | p1 | p2 | Total Energy | Reactive |
|---|---|---|---|---|
| 1 | -1.25 | -2.5 | -99.0 | yes |
| 2 | -1.5 | -2.0 | -100.5 | no |
| 3 | -1.5 | -2.5 | -98.9 | yes |
| 4 | -2.5 | -5.0 | -84.9 | no |
| 5 | -2.5 | -5.2 | -83.4 | yes |
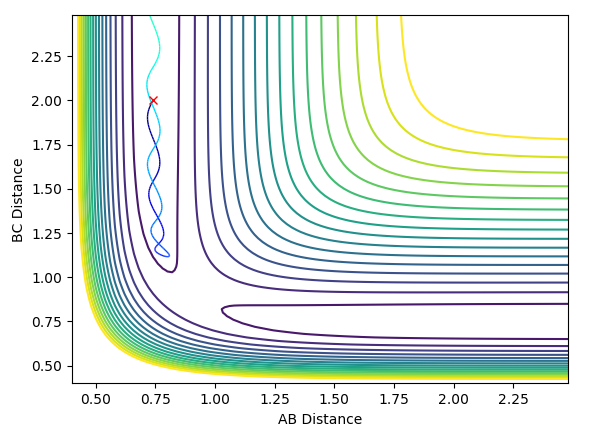
The contour plot for Case 1 is shown below:
In Case 1, the reaction has enough momentum to overcome the transition barrier, allowing the reaction to occur.
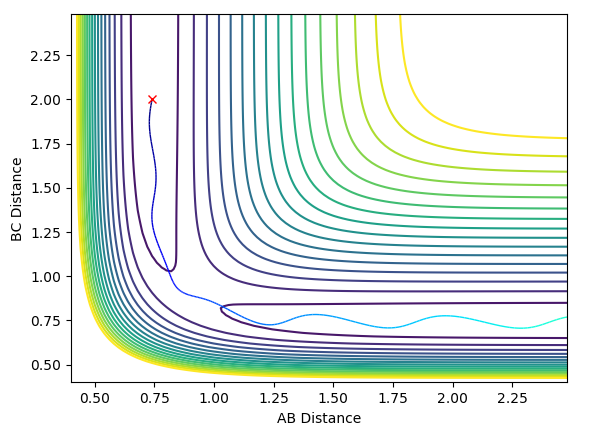
The contour plot of Case 2 is shown below:
In Case 2, there is not enough momentum to overcome the transition barrier, so the reaction does not occur. A and B remain bonded while moving away from atom C.
The contour plot of Case 3 is shown below:
In case 3, there is once again enough momentum to overcome the transition barrier, allowing the reaction to proceed.
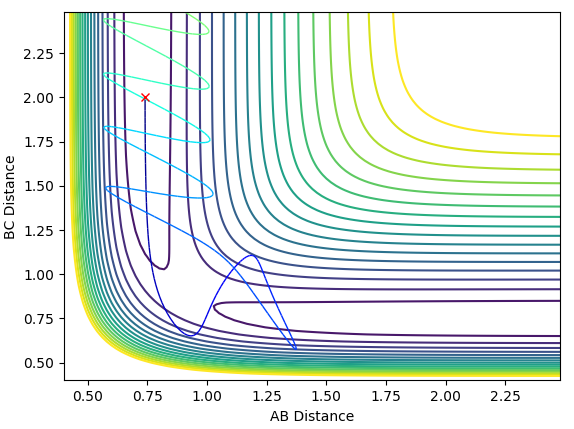
The contour plot of Case 4 is shown below:
In case 4, there is a barrier recrossing. There is enough momentum for the reaction to proceed, but on the products side, atoms B and C collide with enough momentum to send atom B back towards atom A, recrossing the potential barrier and undoing the reaction
The contour plot of Case 5 is shown below:
Very similar situation as with Case 4 but now with enough momentum for 2 barrier recrossings, leading to the reaction occurring.
Transition State Theory
The most significant approximation in Transition State Theory is the classical treatment of atoms, which ignores phenomena such as quantum tunneling and assumes that the only way the products can be reached is with molecules obtaining enough momentum to overcome the transition barrier. when according to quantum mechanics, there is a non-zero chance of tunneling through the barrier[1].
Transition State Theory also assumes that there exists clear reactant and product states on either side of the transition barrier, but as can be seen in Case 4 and Case 5 above, it is possible for the reaction to move the product state back into the reactant state if there is not enough time for the product to equilibrate, so the reaction does not occur entirely in one direction.
Classifying H2 + F ⇌ HF + H
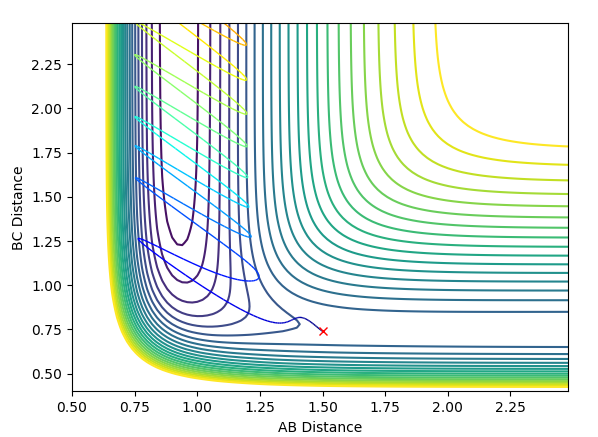
The reaction between a hydrogen molecule and a single fluorine atom is exothermic. making the reverse reaction endothermic. This can be seen on the potential surface below:
The potential surface above shows the much lower potential which occurs when the fluorine (atom A) is bonded to hydrogen (atom B). It also shows how much kinetic energy is released when the reaction proceeds in the forward direction, as the large oscillations in the F-H bond are clearly visible in reaction trajectory.
This result matches with experimental evidence, as the F-H bond (565 kJ mol-1) is stronger than the H-H bond (436 kJ mol-1).
Locating The Transition State
From Hammond's postulate, we know that the the transition state will be high energy, and therefore will resemble the F + H_2 side of the reaction.
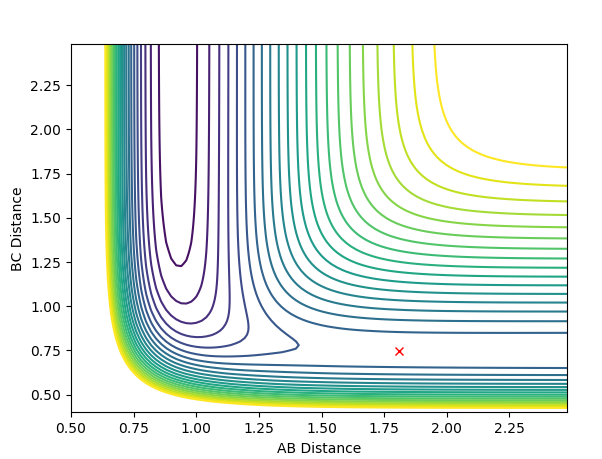
The transition state can be found at an AB (HF) distance of 1.8105 and a BC (HH) distance of 0.7460, as seen on the contour map below.
The energy of the reactants sits at -103.923 kJ mol-1
The energy of the products sits as -133.218 kJ mol-1
The energy of the transition state sits at -103.76 kJ mol-1
thus, the activation energy of the forward reaction is kJ mol-1
And the activation energy of the backwards reaction is 29.458 kJ mol-1
Reaction Dynamics
The image above shows a reactive pathway. note that before the intermediate state, there is little oscillation in the reactants, but after the transition state, there is significant oscillation in the products. this is indicative of a much higher vibrational energy in the product, indicating that the reaction energy goes into molecular vibration. one way to verify that this is indeed the case would be to monitor the reaction via IR spectroscopy.
Ng611 (talk) 19:56, 24 May 2018 (BST) Where is your discussion on Polanyi's rules?
Ng611 (talk) 19:58, 24 May 2018 (BST) What you've written is good, but you were expected to include a discussion on Polany's rules, complete with examples -- This was an improtant part of the lab.
- ↑ Bruce H. Mahan. Activated Complex Theory of Bimolecular Reactions . J. Chem. Educ. 1974, 51, 710.

