MRD:al7215
H + H2 system
Dynamics from the transition state region
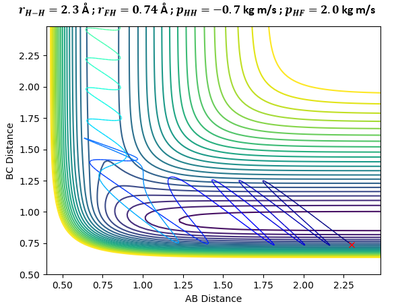
At the minimum and transition structures, both the gradient of the potential energy surface is zero perpendicular to the reaction path, i.e. ∂V/∂s=0 (where s is perpendicular to the reaction path). However, the minima and transition structures can be distinguished by looking at the second derivative of the reaction path. This is as the transition structure is maximum along the reaction path (∂V2/∂r2 < 0), whereas the minima is still a minima along the reaction path.
Ng611 (talk) 23:11, 7 June 2018 (BST) This is correct but it's a bit of a confused explanation. A diagram would help here/
Locating the Transition State
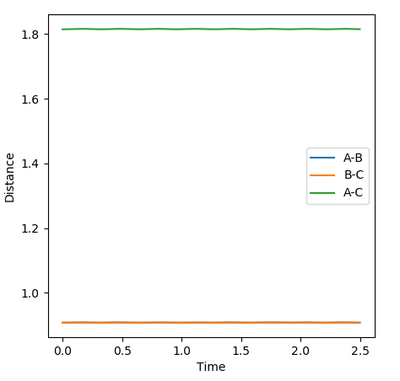
In theory, there will not be any oscillations at the transition state if the trajectory starts off with zero initial momentum since the ridge is flat. Moreover, since we are only estimating the transition state position, we would want to find a position where there are little/ no oscillations. Thus, the best estimate of the transition state position is found to be rts= 0.9074 as there exists almost no oscillations (evident from the above Internuclear Distances vs Time plot).
Calculation of Reaction Path using MEP and Dynamics
Ng611 (talk) 23:12, 7 June 2018 (BST) Good explanation!
Reactive and Unreactive Trajectories
Main Assumptions of Transition State Theory
The main assumptions of Transition State Theory (TST) are as such:[1]
1. Electronic and nuclear motions can be separated and treated independently, just like the Born-Oppenheimer approximation for wavefunctions in quantum mechanics;
2. Maxwell-Boltzmann distribution determines how the reactant molecules are distributed among the various states;
3. Molecular systems can cross the transition state once, and only in the direction from reactants to products;
4. In the transition state, the translational motion can be treated classically and separated from other motions along the reaction coordinate
Transition State Theory predictions for reaction rate values usually overestimate experimental values. This is as TST assumes that trajectories cannot recross the transition state, but if they do like in some cases, each of such crossing will be treated as an independent trajectory. So for instance, if there are 8 crossings of the saddle point (transition state) in the direction from reactant to products, the theory will count all of them as independent trajectories contributing to the reactive flux.[2] In reality, it might be that only two out of the eight trajectories reached the product side. Thus the rate constant predicted by TST would have been four times larger than the actual rate constant.
Ng611 (talk) 23:14, 7 June 2018 (BST) You've got the right overall picture, but really you have far too few data points to quantify the degree of overestimation.
That being said, assumption 3 is still quite a good approximation for molecular systems dealing with thermal reactants with a barrier that is much higher than the thermal energy.[3] This is as once the barrier has been crossed, it is unlikely that the motion downhill to the products will reverse upon itself.[4] Thus, TST works best at ordinary temperatures when, due to the Boltzmann factor, there is little excess energy available for barrier to be recrossed.[5]
F - H - H system
Potential Energy Surface (PES) Inspection
Energetics and Bond Strength
Evident from the table of values and the plot below, it can be noted that F + H2 is an exothermic reaction. The system moves from a higher energy reactant state to a lower energy product state, releasing about 30 kcal/mol of energy during this transition. This also shows that H-F has a greater bond strength than H-H bond as the energy gained from the formation of one H-F bond more than compensates for the energy lost in breaking one H-H bond. This postulation is supported by literature, with the bond dissociation energies of H-F and H-H bond being 5.869 eV and 4.478 eV respectively.[6]
Correspondingly, H + HF is an endothermic reaction.

Locating the Approximate Position of Transition State (TS) using Hammonds' Postulate
Hammond's Postulate states that the transition state will most closely resemble to the reactants or products that has the closest energy to it. For an exothermic reaction, the transition state will resemble the reactants, with the system having an early transition state. Additionally, unlike the H + H2 system previously considered, the PES of F + H2 system is highly asymmetric, so rH-F is not equal to rH-H at the transition state, but will be largely different. After testing out some initial conditions (in particular varying rH-F in the region of 1.7-2.3 as the reaction has an early TS), the approximate position of transition state is as follows: rH-H= 0.7448 and rH-F= 1.8108. These values can be validated by looking at the following Internuclear Distances vs Time Plot and observing that rH-F (blue line) and rH-H (orange line) are constant (i.e. there are no oscillations and the the three atoms are stationary)

Activation Energy of Forward and Backward reactions
| Activation Energy Calculations using MEP | ||
|---|---|---|

|

| |
The activation energy (Ea) of the forward (F + H2) and backward reaction (H + HF) can be calculated using MEP. Generally, this is done by slightly perturbing the system slightly to the left or right from the approximate transition state position so that the trajectory will follow the path of minimal energy and ultimately reach the valley floor of the reactant or product after a sufficient number of MEP steps. The energy at t=0 is the energy of the transition state while the energy at the very end is the energy of either the reactants or products state. Activation energy is thus the energy gap between energy at t=0 and t=N (where N is the time in which the last MEP step is completed). From the two plots, it can be noted that Ea= 0.255 kcal/mol for F + H2 reaction and Ea= 30.194 kcal/mol for H + HF reaction. MEP of the H + HF reaction was calculated using 100,000 steps, but in reality, much less steps is needed as the product floor is reached slightly after 100s. In contrast, the F + H2 reaction took about 500,000 MEP steps to reach the reactant valley floor, and even then, the valley floor obtained is not entirely flat. The reason for this is that the trajectory followed a very gentle gradient due to the closeness in energy between the transition state and reactant states.
Ng611 (talk) 23:15, 7 June 2018 (BST) Excellent!
Reaction Dynamics
Mechanism of release of Reaction energy

| Plots of a Reactive Trajectory | ||
|---|---|---|

|

| |
In the above plots, A is the Fluorine atom while BC is H2 molecule. The mechanism of release of reaction energy is as such: Fluorine, possessing translational kinetic energy, approaches a largely non-vibrating H2 molecule. Upon collision and after several barrier recrossings at the transition state, the new HF molecule emerges at a vibrationally excited state with some vibrational energy. This can be seen from the large sinusoidal oscillations of HF molecule in the Inter-Nuclear Momenta vs Time plot. Due to the conservation of energy, the gain in vibrational energy of HF molecule means a loss in translational energy of the departing H atom. Thus, H atom absorbs the remainder energy and moves away from HF molecule through a purely translational motion.
Infrared Chemiluminescence is one analytical method that can help to experimentally verify whether the resultant HF molecule is indeed in a vibrationally excited state. If the excitation of HF is primarily vibrational, its radiation will appear in the infrared region of the spectrum between 3 to 15 µm.[7] This technique has been widely used for hydrogen-halogen reactions, producing HX molecules in excited (v, J) states.[8]
Ng611 (talk) 23:16, 7 June 2018 (BST) Excellent suggestion!
Polanyi Empirical Rules
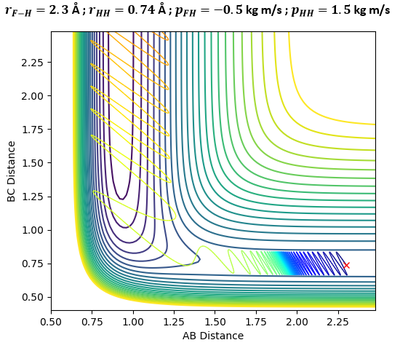
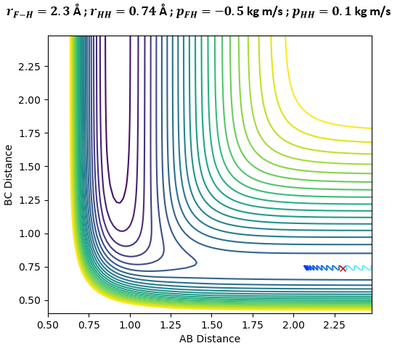
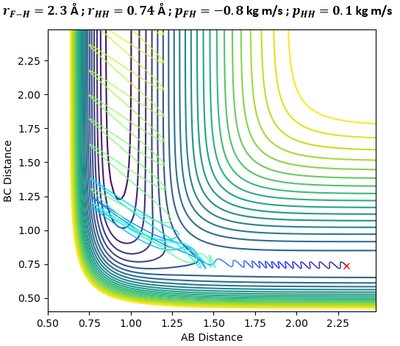
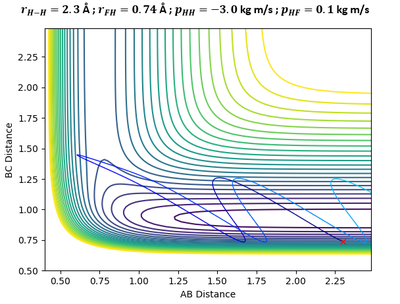
After carrying out an extensive series of calculations on potential surfaces, Polanyi identified the position of transition state as key to understanding the efficiency of the reaction as well as the energy distribution of its reaction products. Polanyi's celebrated set of rules can be summarised as follows:[9]
Efficiency of reaction
Translational energy is most effective for a reaction which has an "early" transition state near the entrance channel, whereas reactant vibrational energy that is far in excess of the barrier height may be ineffective for the reaction. Conversely, a "late" barrier is best surmounted by vibrational rather than translational energy in the reactants.
Energy distribution of products
An "early" transition state generally favours vibrational excitation of the product while a "late" transition state tends to lead to a low product vibrational excitation.
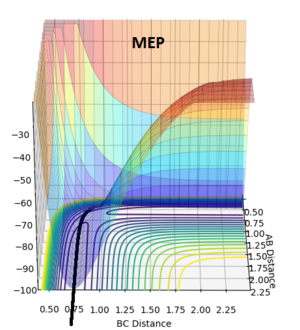
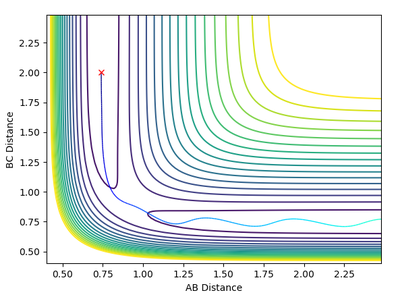
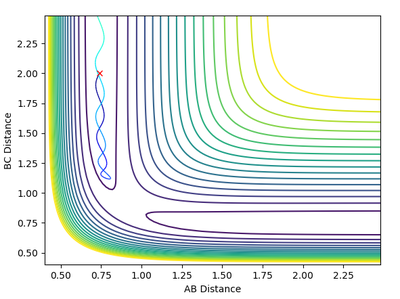
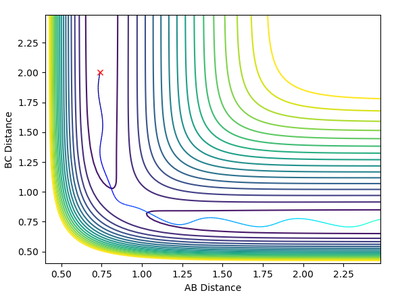
We will now explore how Polanyi's empirical rules can be applied to the following plots shown below:
Ng611 (talk) 23:18, 7 June 2018 (BST) This is an absolutely fantastic report, particularly the second section. You should be very proud of this piece of work!
- ↑ J. I. Steinfeld, J. S. Francisco, W. L. Hase, Chemical Kinetics and Dynamics, Prentice-Hall, New Jersey, 1989, p.311
- ↑ J. I. Steinfeld, J. S. Francisco, W. L. Hase, Chemical Kinetics and Dynamics, Prentice-Hall, New Jersey, 1989, p.333
- ↑ R. D. Levine, Molecular Reaction Dynamics, Cambridge University Press, New York, 2005
- ↑ R. D. Levine, Molecular Reaction Dynamics, Cambridge University Press, New York, 2005
- ↑ R. D. Levine, Molecular Reaction Dynamics, Cambridge University Press, New York, 2005
- ↑ J. I. Steinfeld, J. S. Francisco, W. L. Hase, Chemical Kinetics and Dynamics, Prentice-Hall, New Jersey, 1989, p.293
- ↑ J. I. Steinfeld, J. S. Francisco, W. L. Hase, Chemical Kinetics and Dynamics, Prentice-Hall, New Jersey, 1989, p.291
- ↑ J. I. Steinfeld, J. S. Francisco, W. L. Hase, Chemical Kinetics and Dynamics, Prentice-Hall, New Jersey, 1989, p.291
- ↑ J. I. Steinfeld, J. S. Francisco, W. L. Hase, Chemical Kinetics and Dynamics, Prentice-Hall, New Jersey, 1989, p.297-299

