MRD:aj3318
Introduction
Ng611 (talk) 21:21, 18 May 2020 (BST) 5/5 - A very rigorous and very well discussed piece of work. Some minor comments are given throughout but overall you demonstrate a strong grasp of the key principles of the experiment, well done!
In this Wiki page, the molecular reaction dynamics of two simple triatomic systems are investigated: H + H2 and F + H2. For simplicity, atoms are assumed to be at 180° with each other, reducing the system into 1D space. The key variables to be explored include intermolecular distances, momentum, and the potential energy. The three atoms are labelled A, B and C. The vectors r1 and r2 are the vectors BA and BC in pm respectively. The momenta are noted p1 and p2 in g mol-1 pm fs-1. The potential energy is the energy of the system relative to the state where the three atoms are infinitely separated from each other, estimated based on the London-Eyring-Polanyi-Sato (LEPS) function.

The potential surface, intermolecular distance/time, momentum/time, energy/time are simulated using two methods of calculation: minimum energy path (MEP) and dynamics. The details of these calculations are discussed.
The answers to questions are highlighted in blue.
Exercise 1: H + H2 System
Potential Energy Surfaces
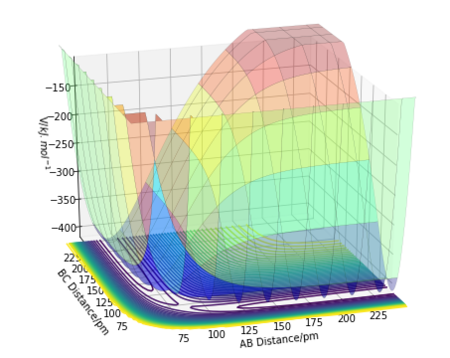
Potential energy surface is the plot of potential energy in respect to the geometric parameters. In a complicated system with a large number of degree of freedom, multi-dimensional analysis may be necessary. In this example, the three atoms are assumed to be restricted to 1D motion in free space, allowing the full system to be analysed in 3-dimensional coordinates. The potential energy surface of the H + H2 system is shown below.

The set of valleys on the potential energy diagram are often used to represent the "reaction coordinate" in chemical energy diagrams. The maximum of the lowest-energy path is the "transition state", which, on a 2D surface in 3-dimensional space, is represented as the saddle point. The saddle point is the point where the Hessian matrix has both negative and positive eigenvalues (i.e. fx=0, fy=0, fxxfyy-fxy2<0). This differs from the local minimum where the Hessian matrix is a definite negative (i.e. fx=0, fy=0, fxx>0, fxxfyy-fxy2>0). Intuitively, saddle point is a turning point that is a relative minimum in one direction but maximum in another direction, whereas the local minimum is a minimum in all directions.
Ng611 (talk) 21:05, 18 May 2020 (BST) A very good definition of a saddle point here. Well done. What do the X's and Y's in your equation represent though? Are the merely the A-B/B-C distances, or something else?

Locating Transition State
The most general method to locate the transition state is to solve the differential equations numerically. In this particular system, the transition state can easily be located by setting the atoms A and C equidistance from each other, and running the simulation under minimum energy path (MEP - further discussed later). The system will approach the transition state. This is possible because the transition state is perfectly symmetrical, as predicted by the Hammond's postulate.
Ng611 (talk) 21:08, 18 May 2020 (BST) A little more explanation about how you know the AB/BC distances are equal from Hammond's postulate would have improved this paragraph. Nevertheless, well done!

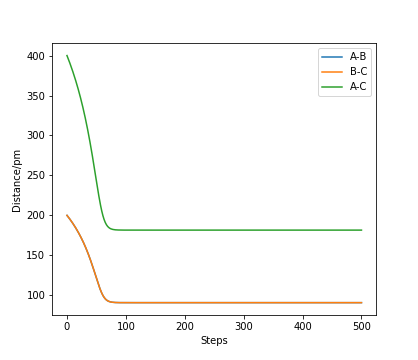
At a perfectly symmetrical system of H-H-H, the system cannot "roll down" to H2 + H or H + H2, but will equilibrate at the most stable state of H-H-H (i.e. transition state). This is illustrated below.

At the end of the simulation, the coordinate (r1, r2) approaches r1 = r2 = 90.77 pm. Hence, the transition state of H + H2 system is the state where both atoms are 90.77 pm away from the central atom.
Ng611 (talk) 21:08, 18 May 2020 (BST) A very creative way of estimating the transition state. Well done!
Calculating Reaction Path
The reaction path at the following parameters were analysed using MEP and dynamic calculations.
| Steps number | Size/fs | r1/pm | r2/pm | p1/gmol-1pmfs-1 | p2/gmol-1pmfs-1 |
|---|---|---|---|---|---|
| 500 | 0.1 | 91.8 | 90.8 | 0 | 0 |
The minimum energy path (MEP) is a trajectory where the change in potential is assumed to be lost as "heat", resulting in the overall loss of energy from the system (dV=dq). Hence, the kinetic energy is always at zero and therefore the momentum is also always zero. The dynamic simulation is the trajectory where the change in potential is converted to kinetic energy (dV=dK). In this simulation, none of the energy is lost to the surroundings and the total energy is conserved. The dynamic simulation is closer to the real intermolecular interactions in the free space. The MEP is useful to find the reaction coordinate (i.e. lowest-energy path).
Ng611 (talk) 21:11, 18 May 2020 (BST) Your "heat" comment, while not wrong, is slightly misleading as it would suggest the energy remains in the simulation, when this is not the case. A discussion in which you talk instead about dispersive forces would be somewhat better here.
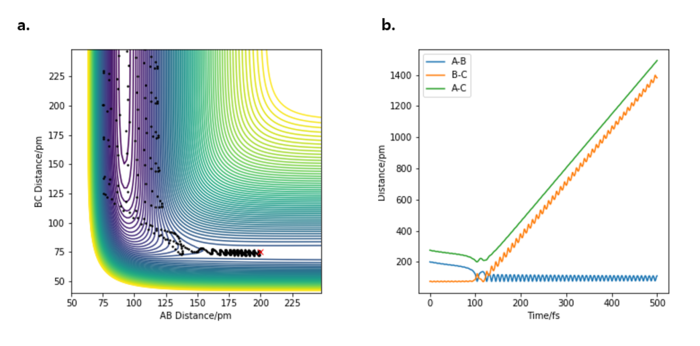
The trajectories from MEP and dynamic calculations are shown below.

The potential energy surface of dynamic simulation have the "oscillating" movements caused by the interplay of kinetic and potential energy of the system, whereas the MEP simulation only moves downhill due to the absence of excess kinetic energy (i.e. zero momentum). Mathematically, the motion at MEP is directed toward p = -grad(V)dt, whereas the dynamic motion must consider p = -ʃgrad(V)dt. The motion in distance vs time plot of both motions is also shown below.

Note that the gradient of Fig. 7b, representing velocity, generally increases over time as the kinetic energy is added to the system, whereas the gradient of Fig. 7a only depends on the slope of the potential surface.
The energy of the trajectories is shown below. As stated by the assumption, we find that the total energy is constant at dynamics, and the kinetic energy is zero at MEP.

Ng611 (talk) 21:11, 18 May 2020 (BST) A very nicely discussed section overall!
Reactive and Unreactive Trajectories
One primary aim of the molecular reaction dynamics is to predict the reactivity of a system of atoms. Using the potential surface plot, we can predict whether a reaction will occur at a specific condition by simulating whether the collision would result in the trajectory from one local minimum to another via the transition state. The illustration of this is demonstrated below. Series of simulation was carried out in the following conditions:
| Steps number | Size/fs | r1/pm | r2/pm | p1 | p2 | Etot |
|---|---|---|---|---|---|---|
| 1000 | 0.1 | 74 | 200 | shown below in gmol-1pmfs-1 | shown below in gmol-1pmfs-1 | shown below in kJ mol-1 |
From the table above, one can conclude that the reactivity of a collision may not be possible to predict just by looking at the total energy of the system. The reactivity of a collision depends on both energy and the angle of trajectories, and there are possibilities that a system with enough energy would cross the energy barrier twice or more and bounce back to the original structure.
Transition State Theory
Given the results you have obtained, how will Transition State Theory predictions for reaction rate values compare with experimental values?
The transition state theory (TST) predicts the rate of reaction in the macroscopic scale based on the statistical thermodynamics. The TST states that the rate of reaction, kTST, of a reaction A+B->P can be expressed as the following:
Where QA, QB and QTS are the partition functions of A, B and the transition state respectively. V is the volume of the mixtures, Rcl is the rate of crossing the energy barrier, Ea is the activation energy, kB is the Botzmann constant and T is the temperature.
There are 5 key assumptions in the TST:
- The nuclear and electronic motions are decoupled (BO approximation)
- The energy of the reactants follow the Boltzmann distribution
- Molecular systems that have crossed the transition state and formed products cannot return to the reactants
- In the transition state, the motion along the reaction coordinate can be treated classically
- The energy of the transition states that are becoming the product follow the Boltzmann distribution.
In experiments, all molecular systems in macroscopic scale are in equilibrium, meaning that both forward and backward reactions may occur. This violates the third assumption of TST, causing the TST to overestimate the rate of reaction. Another source of error could arise from the third assumption. Although minor, the tunnelling effect could make an observable difference to the experimental rate of reaction in a small molecular system.
Ng611 (talk) 21:14, 18 May 2020 (BST) A very good discussion!
Exercise 2: F + H2 System
Potential Energy Surface
The potential energy surface of the F-H-H system is as follows.

On the potential energy surface of F-H-H, it is clear that the F + H2 system has higher potential energy compared to the HF + H system. Consequently, F + H2 is an exothermic and HF + H is an endothermic reaction. This indicates that the bond strength of HF is stronger than that of H2. Intuitively, the fluorine atom is significantly more electronegative compared to the hydrogen atom, causing the H-F bond to be highly polarised. This leads to the increased ionic contribution in the H-F bond, resulting in a stronger H-F bond compared to H-H.
The approximate position of TS is at r1=181.1 and r2=74.5 pm, which represent the intermolecular distance between F-H and H-H respectively. The eigenvalues of the Hessian matrix were -0.002 and +0.332 for the eigenvectors (+1.000, -0.023), (-0.023, +1.000) respectively. The potential energy at the TS is -433.980 kJ mol-1.
The activation energy of the system was estimated by comparing the potential energy of the TS to the potential energy of the products when the system is slightly perturbed from TS. The following demonstrates how the calculation is performed.
| Calculation Type | Steps | Time/fs | rFH/pm | rHH/pm | pFH/gmol-1pmfs-1 | pHH/gmol-1pmfs-1 | Figure |
|---|---|---|---|---|---|---|---|
| MEP | 1000 | 0.5 | 181.1 | 74.5 | 0 | 0 | 15 |
| MEP | 1000 | 0.5 | 181.2 | 74.5 | 0 | 0 | 16 |


Ng611 (talk) 21:15, 18 May 2020 (BST) In one of your plots, you get a huge spike in energy. Why is this?
By iterating the calculations, the potential energy was estimated to the 6 significant figures. This involved finding the trajectory down the MEP from an initial condition, inserting the last geometry as the initial condition, and repeating until the potential energy stabilises.
| System | Ep/kJmol-1 |
|---|---|
| HF + H | -560.699 |
| F + H2 | -435.099 |
| F-H-H | -433.980 |
The activation energy of HF + H -> H + H2 is +126.719 kJ mol-1, and F + H2 -> HF + H is +1.119 kJ mol-1.
Ng611 (talk) 21:16, 18 May 2020 (BST) Very sensible estimates, well done!
Reaction Dynamics
The following reaction condition resulted in the reaction from H2 + F -> HF + H.
| Calculation Type | Steps | Time/fs | rFH/pm | rHH/pm | pFH/gmol-1pmfs-1 | pHH/gmol-1pmfs-1 |
|---|---|---|---|---|---|---|
| Dynamics | 1000 | 0.5 | 200 | 75 | -1.0 | 0.3 |

Following an exothermic reaction, the loss in potential energy becomes replaced by the increase in kinetic energy. The kinetic energy can be in translational, rotational or vibrational form. However, since we are working on a 1D system, the rotational motion can be neglected.
The overall gain in the kinetic energy, including both translational and vibrational energy, can be measured using a bomb calorimeter. The collision of products with high translational and vibrational energy collides to the wall of the calorimeter, transferring the energy as heat. The heat produced from the collision can subsequently be measured using a thermal sensor.
The vibrational energy can specifically be measured using an IR spectroscopy. At the room temperature, most bonds occupy the lowest-energy vibrational levels. However, during an exothermic reaction, higher-level vibrational modes can become occupied as the potential energy converts into the vibrational kinetic energy. In an IR spectroscopy, the higher-level vibrational modes appear as an overtone signal as 1->2 and 2->3 etc. transitions become detected. As the vibrational modes relax back to the ground state, the overtone signal disappears.
Ng611 (talk) 21:18, 18 May 2020 (BST) Good, but why not also mention IR chemiluminescene as well?
Polanyi's empirical rules
The Polanyi rules state for reactants given momentum along the direction of the reaction path, translational energy, as opposed to vibrational energy, is preferred to overcome the early transition state in an exothermic reaction. To investigate this, series of trajectories with a same initial kinetic energy but with different vibrational/translational components are simulated. This is done by projecting the triatomic system on the potential energy surface toward TS at an different angle as shown below.

In these series of trajectories, the horizontal components represent the vibrational momentum, and the vertical components represent the translational momentum.
From the previous section, H2 + F -> H + HF is an exothermic reaction, with the activation energy of +1.119 kJ/mol. The series of trajectories at ~1.5kJ/mol are summarised below. Starting point: (200, 75)
| pFH/gmol-1pmfs-1 | pHH/gmol-1pmfs-1 | Angle of Projection/deg | Kinetic Energy/kJ/mol | Reaction |
|---|---|---|---|---|
| -1.69 | 0.00 | 0.0 | 1.503 | Yes |
| -1.49 | 0.20 | 7.6 | 1.506 | Yes |
| -1.26 | 0.40 | 17.6 | 1.500 | Yes |
| -1.01 | 0.60 | 30.7 | 1.503 | Yes |
| -0.73 | 0.80 | 47.6 | 1.504 | Yes |
| -0.41 | 1.00 | 67.7 | 1.498 | No |
| -0.05 | 1.20 | 87.6 | 1.501 | No |
At a low angle of projection, the trajectory is directed straight at the TS along the MEP. The higher angle indicates the trajectory with lower velocity toward the TS, but with greater oscillations. Hence, the exothermic reaction favours the low angle of projection (i.e. a system with greater distribution of translational energy compared to vibrational energy) is preferred to overcome the TS.
Starting point: (92, 300)
| pFH/gmol-1pmfs-1 | pHH/gmol-1pmfs-1 | Angle of Projection/deg | Kinetic Energy/kJ/mol | Reaction |
|---|---|---|---|---|
| 0.0 | -13.1 | 0.0 | 171.161 | No |
| 3.0 | -11.5 | 14.6 | 171.487 | No |
| 6.0 | -9.7 | 31.7 | 171.237 | No |
| 9.0 | -7.7 | 49.5 | 171.122 | No |
| 12.0 | -5.4 | 65.8 | 169.749 | No |
| 15.0 | -2.9 | 79.1 | 170.331 | Yes |
| 18.0 | 0.0 | 90.0 | 170.526 | Yes |
On the other hand, the endothermic reaction favours the "horizontal" projection with a large vibrational kinetic energy and low translational energy for overcoming the barrier.
Ng611 (talk) 21:20, 18 May 2020 (BST) A very rigourous method for discussing Polanyi's Rules! Excellent!


