
MRD:ahp3018
Molecular Reaction Dynamics: Applications to Triatomic Systems
H + H2 System
General comment: please provide references. There are many points which are wrong, I recommend you to revise transition state theory, and especially watch the introduction video again. In some cases it might also be that you actually 'meant the right thing', but were unable to express yourself. Consider giving your reports to someone else to read - if they don't understand a part, then you will need to rephrase it. Fdp18 (talk) 14:50, 16 May 2020 (BST)
Dynamics from the transition state region
On a potential energy surface diagram, the transition state is mathematically defined as the point at which dV(ri)/dri=0 is true. This can be described as the maximum point on the minimum reactive trajectory (minimum energy path linking reactants and products).
The transition state appears as a saddle point in the potential energy surface (PES) - i.e. in one direction, the point is a maximum point in the graph and in the other direction, it is a minimum. See Figure 1.
I think you forgot to show figure 1 here. Fdp18 (talk) 14:09, 16 May 2020 (BST)
If a trajectory is started at the transition state, no change will occur if there is no initial momentum supplied. However, if the system has momentum in the direction of the products, it will roll towards the products (likewise in the opposite direction for the reactants). If a trajectory is started at a local minimum of the PES, it will not move from there even if it has momentum.
The last part is not correct: with enough momentum, you can move out of every (finite) well. Fdp18 (talk) 14:16, 16 May 2020 (BST)
Locating the transition state
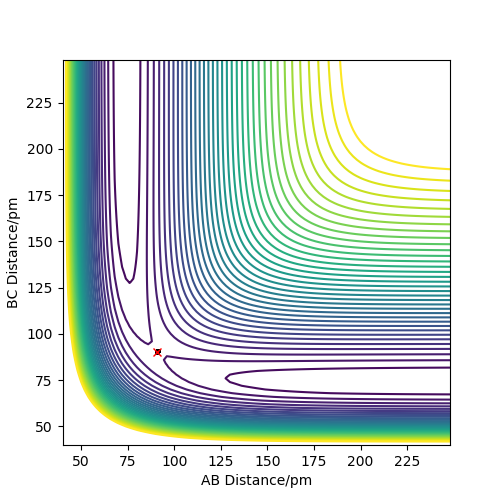
As the H + H2 surface is symmetrical, the bond lengths in the transition state must be equal (r1=r2=rts). The best estimate for rts from the software is rts=90.5 pm. See Figures 2 and 3.
How did you arrive at this estimate? Also, there is quite some vibration left. Fdp18 (talk) 14:18, 16 May 2020 (BST)
This is a good estimate for the bond length in the transition state as Figure 2 shows the system stably remaining in one place (the red cross is directly on top of the black dot). Figure 3 shows the internuclear distances remaining roughly constant and equal to each other.
Without having at hand the method you used to arrive at this estimate, I have to assume that you just took a quick look at the contour plot. If that is the case: Think about how you could iteratively improve your solution, also with Fig. 3 in mind. Fdp18 (talk) 14:18, 16 May 2020 (BST)

Trajectories and minimum energy path
The minimum energy path (or reaction path) is a trajectory that corresponds to infinitely slow motion. It can be calculated by putting r1=rts+d where d=1 pm, keeping r2=rts and p1=p2=0 g.mol-1pm.fs-1. This was calculated for both a gaseous system (MEP calculation) a more realistic system (Dynamics calculation).
the MEP has nothing to do with a gas phase calculation. Please think carefully what MEP means. It is not a physical trajectory at all (conservation of energy). In contrast, the dynamics calculation here can be regarded as good model for a gas phase collision - provided that the atoms engage when lined up. Fdp18 (talk) 14:22, 16 May 2020 (BST)


Figures 4 and 5 show the contour plot and surface plot for the gaseous system. Figures 6 and 7 show them for the more realistic system. These latter plots show the oscillations of the atoms, i.e. the internuclear distance oscillating, whereas the MEP plots do not.
The table below shows the internuclear distance-time plots and momenta-time plots for dynamics systems with varying r1 and r2.
| r1=rts+d , r2=rts | r2=rts+d , r1=rts |
|---|---|

|

|

|

|
Switching r1 (BC) and r2 (AB) in the parameters simply switches the A-B and B-C lines in all plots.
Reactive and unreactive trajectories
| p1/g.mol-1pm.fs-1 | p2/g.mol-1pm.fs-1 | Etot/kJ.mol-1 | Reactive? | Description of the dynamics | Illustration of the trajectory |
|---|---|---|---|---|---|
| -2.56 | -5.1 | -414.3 | yes | Reactants collide with enough energy to form the products - there is the right amount of energy in the system |  |
| -3.1 | -4.1 | -420.1 | no | The reactants do not have enough momentum to collide and therefore cannot form the products |  |
| -3.1 | -5.1 | -414.0 | yes | Reactants collide with enough energy to form the products - there is the right amount of energy in the system This statement is correct... Fdp18 (talk) 14:27, 16 May 2020 (BST) |  |
| -5.1 | -10.1 | -357.3 | no | Reactants collide but there is not enough energy for the reaction to take place ... which means this one is not. There is more energy than in the previous entry, i.e. there must also be enough energy. Why could it be that the reaction is still not successful. Fdp18 (talk) 14:27, 16 May 2020 (BST) |  |
| -5.1 | -10.6 | -349.5 | yes | The reactants collide and the products are formed |  |
Transition state theory
Transition state theory uses the properties of the reactants and the transition state to rationalise and calculate the rate of chemical reactions. However, some assumptions are made, reducing its accuracy:
- all collisions with the required kinetic energy (activation energy) will result in a reaction - this ignores the possibility of the energy being distributed incorrectly What do you mean by 'distributed incorrectly'? I would at least expect a reference to a particular entry of the table above. Fdp18 (talk) 14:30, 16 May 2020 (BST)
- once the collision occurs and the trajectory passes the reaction barrier, it cannot turn back into the reactants, i.e. the reaction is irreversible Is this assumption valid or not? Can you give an example of this report that shows that it is invalid? Fdp18 (talk) 14:30, 16 May 2020 (BST)
In conclusion, these assumptions lead to transition state theory over-estimating the reaction rates. The conclusion is correct with the assumptions given, but the link is missing. What you also missed is tunneling of light particles - how would this affect the estimate? Fdp18 (talk) 14:30, 16 May 2020 (BST)
F-H-H System
Transition states and enthalpy of the reaction

The two reactions in this system can be analysed using their PESs. Using Polanyi's rules and Hammond's postulate, we can use the transition state position to determine if the reaction is exo- or endothermic. Polanyi's rules state that an early barrier means that the transition state lies closer to the reactants while a late barrier corresponds to a transition state closer to the products. In the former scenario, translational energy is more efficient to complete the reaction whereas when the transition state is late, vibrational energy is more efficient. Hammond's postulate shows that an early transition state (resembling the reactants) gives an exothermic reaction and a late transition state (resembling the products) gives an endothermic reaction.
Please get in the habit of providing references - later in your career, missing references will be considered as plagiarism. Fdp18 (talk) 14:35, 16 May 2020 (BST)
Thus, using its PES (Figure 12), it can be seen that F + H2 has an early transition state and is therefore an exothermic reaction. Conversely, HF + F shows a late transition state, indicating an endothermic reaction.
More energy is needed to break the F-H bond (therfore causing the late transition state of the second reaction) than to break the H-H bond, showing the F-H bond is stronger than the H-H bond.
You kind of have it the wrong way round here, although not strictly incorrect. Usually you look at whether a reaction is exo- or endothermic, and then decide using Polanyi's principles whether you expect an early or late TS. Fdp18 (talk) 14:37, 16 May 2020 (BST)
Location of the transition states

The location of the transition state for one of these reactions would have the coordinates opposite and equal to the other reaction's transition state. For F + H2, its early transition state means the F-H length is longer than the H-H distance, which was found in the previous H + H2 system to be 74 pm. Therefore, the internuclear distances for this reaction were found to be F-H=181.5 pm and H-H=74 pm. you refer to a previous result here - where do you present that result? Fdp18 (talk) 14:38, 16 May 2020 (BST)
See Figure 13 to see its structure.
The transition state for HF = H reaction would have coordinates of H-F=181.5 pm and H-H=74 pm.
How did you arrive at this geometry? I would not be able to reproduce the steps taken based on your description above. Fdp18 (talk) 14:39, 16 May 2020 (BST)
Activation energies
A resonable estimate was found by performing an MEP calculation with 1500 steps and 0.1 step size from a structure neighbouring the transition state, i.e. r1=rts+d , r2=rts.
The activation energy for the F + H2 reaction was found by finding the difference between the energy of the transition state (-433.942 kJ.mol-1) and the energy of a system with maximum displacement between the reactants (F-H=750 pm, energy=-435.100 kJ.mol-1). This gives an activation energy of 1.158 kJ.mol-1.
The activation energy for the HF + H reaction was found by finding the difference between the energy of the transition state (-433.942 kJ.mol-1) and that of the reactant path (-551.535 kJ.mol-1), giving an activation of 117.593 kJ.mol-1. The HF+H-->H2+F activation barrier is a bit off - it would be helpful if you give the plots of energy vs time for the reactions or MEPs you used, so the reader can see for themselves whether you reached a stable energy value. Fdp18 (talk) 14:41, 16 May 2020 (BST)
Release of energy
There are two mechanisms for the release of energy in a reaction - the release of translational kinetic energy and the release of vibrational kinetic energy. One method of measuring energy release is through calorimetry. Vibrational energy can emit IR radiation, however it is possible for IR radiation to be reabsorbed by the walls of a bomb calorimeter therefore preventing the differentiation between the two energy release mechanisms by this method.
The considerations are correct, but one could construct a calorimeter with an IR transmissive window in it. Fdp18 (talk) 14:42, 16 May 2020 (BST)
Modes of energy distribution
When the system is relaxed, the ground state energy is populated the most. Once excited, electrons can be promoted from the ground state to the first energy level, and from the first energy level to the second. You are confusing different energy regimes here. While there might be some coupling between rotation and vibration, this is usually not the case with electronic exitations, which are in most cases very high in energy.Fdp18 (talk) 14:46, 16 May 2020 (BST)
In an early transition state reaction, translational energy is more efficient to complete the reaction, whereas when the transition state is late, vibrational energy is more efficient.
This section is much too brief. There are no references and no simulation results, so the last sentence is jsut a hypothesis / postulate. Please provide simulation results, e.g. trajectories of successful and unsuccessful reactions. Fdp18 (talk) 14:46, 16 May 2020 (BST)