MRD:afs17
MRD Lab:afs17
Ng611 (talk) 20:01, 30 May 2019 (BST) Well laid out, explained and presented. There were several instances however where your conceptual understanding of the material could be improved. I would reccomend reading (or re-reading) the reading list for this lab.
Exercise 1: H + H2 System
On a potential energy surface diagram, how is the transition state mathematically defined? How can the transition state be identified, and how can it be distinguished from a local minimum of the potential energy surface?
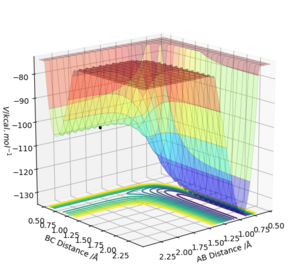
Figure 1 shows a potential energy surface diagram, the transition state is the maximum point on the minimum energy path linking reactants and products.
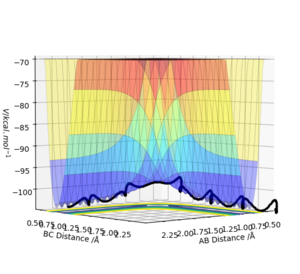
The transition state is a saddle point on the potential energy surface diagram, the transition state is the first partial derivative with respect to r1 and r2 [1] and must be equal to zero.
Any minima or maxima (critical point on the graph) will also have the same value of zero, to check if the critical point identified is the transition state (saddle point) the values of the partial second derivative with respect to r1 multiplied by the partial second derivative with respect to r2 minus the second partial. derivative with respect r2 and r1. If the value is less than zero then the point selected is the saddle point and is the transition state.
The value of this determinant of a local minima will be greater than zero and the partial second derivative with respect to r1 will be greater than zero. This is part of the Hessian matrix and is shown below for saddle points (transition state). This is how to distinguish between the transition state and other local minima.
For saddlepoints:
Ng611 (talk) 19:42, 30 May 2019 (BST) Good!
Report your best estimate of the transition state position (rts) and explain your reasoning illustrating it with a “Internuclear Distances vs Time” plot for a relevant trajectory.
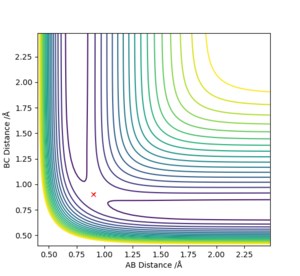
Using Figure 2 enabled the position of the transition state to be estimated at approximately r1=r2=0.9 Å which is where the cross lies on Figure 2. The transition state position was obtained by using various values of r1 and r2 from 0.9 Å until the graph of internuclear distances against time shown in Figure 3 appeared as a horizontal line. This indicated that the internuclear distance was constant and molecules just oscillated periodically as they were at the transition state in this simulation.
Therefore the position of the transition state was estimated to be r1=r2=0.908 Å with p1=p2=0.
r1 and r2 refer to the internuclear distance between Ha and Hb in this simulation.

Comment on how the mep (minimum energy pathway) and the trajectory differ.
Calculating Reaction Pathway
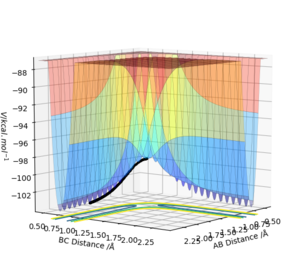
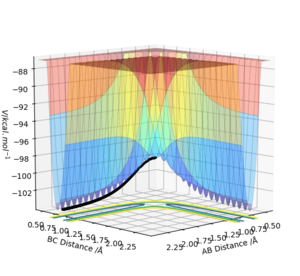
The initial conditions were changed such that r1 = rts +0.01 = 0.909 Å, r2=rts=0.908 Å with p1=p2=0. The calculation was changed from dynamic to MEP and the trajectory follows the valley floor in both Figure 4 and 5. Increasing the number of steps meant th
Ng611 (talk) 19:43, 30 May 2019 (BST) ???
Trajectories from r1= rts


Figure 4 and 5 show the calculation using MEP whilst Figure 6 and 7 show it using the dynamic calculation, with the dynamic calculation the molecules can oscillate which is shown in the line not being smooth instead periodically oscillating. The trajectories in both calculations follow the same pathway of increasing up to the transition state at the maxima, the MEP pathway is a theoretical pathway based on the molecules being perfect and not oscillating - with infinitely slow motion. In the MEP calculations momenta are always reset to zero in each time step which means that it doesn't consider the momentum input at the beginning, it only considered the input momentum in the first step. The dynamic pathway is more realistic as it considers motion of the atoms during a reaction, as well as considering mass and being in the gas phase and it doesn't reset momentum to zero at each time step.
The MEP calculation is very useful in research for unknown reactions as it suggests if a reaction will take place and how it will do so on a reaction dynamics level, here this reaction is very well documented so the use of the MEP is limited as the dynamic calculation is possible.
Ng611 (talk) 19:46, 30 May 2019 (BST) Actually, it's most used to find an equilibrium geometry which can then be used to calculate energies and potentially also run dynamics. The MEP mode here is roughly analagous to using the #opt keyword when performing a calculation in Gaussian (if you haven't yet done the lab, then keep this in the back of your mind when you begin).
Complete the table below by adding the total energy, whether the trajectory is reactive or unreactive, and provide a plot of the trajectory and a small description for what happens along the trajectory. What can you conclude from the table?
This reaction is AB + C -> A + BC
With A,B and C all being H.
For the initial positions rHA-HB = 0.74 Å and rHB-HC = 2.0 Å
| p1 | p2 | Etot | Reactive? | Description of the dynamics | Illustration of the trajectory |
|---|---|---|---|---|---|
| -1.25 | -2.5 | - 99.119 | Yes | This is a productive reaction in which the H2 molecule AB comes towards the H C atom and the transition state is reached (has enough energy to pass activation energy barrier). Vibrates after the reaction but not before suggesting the initial diatomic H2 AB molecule was stable. The vibrational energy in the products BC was transferred from the translational energy from the collision from the reactants, which is why the products oscillate on the graph. | 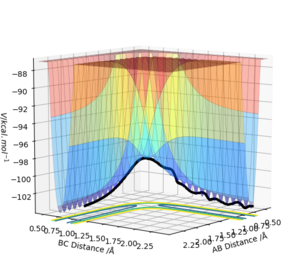 |
| -1.5 | -2.0 | -100.456 | No | The H2 AB molecule is vibrating and has vibrational energy but doesn't react. It doesn't reach the transition state, falls back down as not enough energy to overcome the activation energy barrier, this is likely due to the vibrational energy in the reactants not being high enough for the reaction (Polanyi's Rule). As the reactants vibrate but not as much as the previous example. |  |
| -1.5 | -2.5 | -98.956 | Yes | Reactive as product H2 (BC) is produced and successfully reaches transition state, both AB and BC have vibrational energy and so the whole trajectory (black line) on the graph oscillates. This system has a higher total energy than the last simulation and hence overcomes the activation energy barrier and reaches the transition state. It also has higher energy than the first reaction which is why it oscillates to a higher degree. | 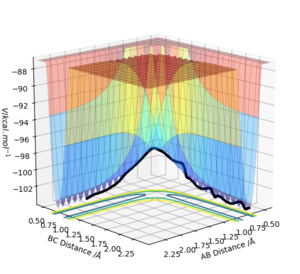 |
| -2.5 | -5.0 | - 84.956 | No | This reaction was unproductive, no product formed at the end of it. H2 AB dissociates and forms BC temporarily before returning to AB and C. Reactants must have contained enough energy to exceed and pass the transition state and activation barrier but there could have been too much vibrational energy from the collision (the oscillations) which could have caused the bond dissociation in the product - the collision is where the energy is transferred and with such a large collision the product broke as too much energy was input. Watching the animation of the simulation at a certain point the 3 H atoms are separate with A moving towards B to reform the reactant. This reaction has the most energy out of all of the previous simulations which could explain why the bond was able to break and reform the reactants. This is barrier recrossing. | 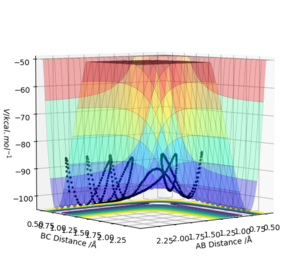 |
| -2.5 | -5.2 | -83.416 | Yes | This is a successful reaction, but the reactants AB have no vibrational energy as the black trajectory line on the graph doesn't oscillate until the products are formed but it still reaches the transition state to form the products (exceeds activation energy barrier). The product BC then dissociates to reform reactant AB which has a lot of vibrational energy (large oscillations) and which is likely to be transformed to kinetic energy in the reactants AB - as seen in the animation when AB moved faster and was ejected further from the collision site than C was. The reformed reactant AB breaks apart again reforming product BC which is an example of barrier recrossing [2] however to confirm that this is occurring the time period of these crossings about the transition state must be less than 0.2 ps which isn't clear here due to it being a simulation. |  |
State the main assumptions of Transition State Theory. Given the results you have obtained, how will Transition State Theory predictions for reaction rate values compare with experimental values?
In Transition State Theory (TST) the reactants are separated from products to find an expression for the thermal rate constant given a potential energy surface graph for the reaction, similar to previous figures. [3] In TST the Born-Oppenheimer approximation is applied to separate nuclear and electronic motion - as nuclei are much heavier than electrons (about 1836 x heavier) so nuclei are considered as stationary relative to fast instantaneous electron motion. The distribution of the transition states obey a Maxwell-Boltzmann distribution and this occurs when there is no equilibrium between products and reactants. Furthermore, systems such as the last two examples are forbidden as systems that have crossed the transition state (and activation energy barrier) to the products cannot reform reactants - barrier recrossing is not allowed.
TST ignores that vibrations are quantised or that tunnelling can occur through quantum mechanics [4]. It also assumes that in order for a reaction to occur the species must collide with enough energy to be successful (cross transition state) despite the possibility that tunnelling can occur or that different amounts of vibrational and translational energy can affect reaction success (Polanyi Rules). Another issue with TST is that at higher temperatures the expected trajectory of the reaction doesn't always pass through the lowest energy saddle point (transition state is on the minimum energy pathway between reactants and products) in the potential energy surface graph as higher energy vibrational modes are populated at higher temperatures, there may be other saddle points on higher energy pathways which would show up instead of the TS - making finding the TS more difficult. TST also doesn't hold up for systems far away from equilibrium as the Maxwell-Boltzmann distribution breaks down, transition states are no longer perfectly distributed.
For the first three systems in the table above, the predicted rates with TST are likely to match experimental theory as reactants simply pass through transition state barrier to form products or don't have enough energy to react and pass the activation energy barrier. For the last two systems the rates are will differ from predicted values as these systems show barrier-recrossing where products form and un-form by recrossing the transition state barrier - forbidden in TST. The predicted TST rate for the last two examples would be faster as TST expects the reaction to go to completion without barrier recrossing which reduces the rate of reaction and in some cases means the reaction doesn't go to completion.
Ng611 (talk) 19:50, 30 May 2019 (BST) Your answer is unclear here. The reaction rate is can roughly be thought of as a 'weighted average' of all possible individual trajectories (5 of which you've provided here). If some of the trajectories predicted to be reactive according to TST are in fact unreactive, how will this affect the overall rate
Exercise 2: F-H-H system
PES Inspection
By inspecting the potential energy surfaces, classify the F + H2 and H + HF reactions according to their energetics (endothermic or exothermic). How does this relate to the bond strength of the chemical species involved?
F + HA-HB -> F-HA + HB

rHH = 0.74 Å, rHF = 2.0 Å and p1 = p2 = 0
The reaction above is exothermic as the reactants are at a higher energy level than the products. This relates to the bond strength of H-F as F is much more electronegative than H resulting in a polarised HF bond, negative enthalpy of bond formation is greater than positive enthalpy of H-H bond breaking. [5]
HA + HB-F → HA-HB + F
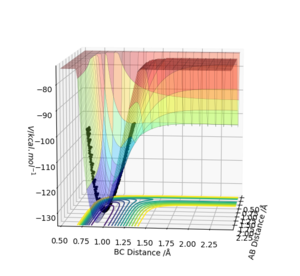
Figure 10 shows how the reverse reaction is endothermic, the products are at a higher energy level than the reactants. This is due to the H-F bond being stronger than H-H bond due to polarity as a result of F being much more electronegative than H. More energy is released when H-F forms H2 and F than vice versa.
Locate the approximate position of the transition state.
F + HA-HB -> F-HA + HB
To find the transition state, momentum for all molecules in the system was set to zero, with H-H distance at 0.74 Å which is the length of a hydrogen bond and H-F at 2 Å. When molecules are at the transition state no reaction path will be plotted as molecules with zero initial momentum remain at the transition state forever and internuclear distances would be constant (straight lines)- the transition state is also the highest energy point of the minimum energy reaction pathway. [6].
To carry on from the initial guess of rH-H =0.74 Å and rH-F = 2 Å, the transition state position was found by looking for a stationary point on the surface plot suggesting no reaction pathway as the reaction was at the transition state. Furthermore, the TS was a point of the reaction where internuclear distance against time was constant horizontal lines with no vibrations and the PES graph had a single dot on it showing the TS as the saddle point as molecules were stationary with no oscillations. This was repeated many times until a region of values was narrowed down and eventually for the first reaction, rH =0.745 Å and rHF = 1.811 Å, with momentum set to zero.
At the transition state kinetic energy is also zero as there are no forces acting on the molecules in the transition state they are stationary, Figure 12 shows the zero kinetic energy of the atoms and molecules at the transition state.

Report the activation energy for both reactions.
Hammond's Postulate says that the transition state of a reaction will look more like reactants or products depending on which is closer in energy[7].
In the forward exothermic reaction it means that the transition state structure will be closer to the reactants H2 + F as the TS energy is closer to the products than the reactants. To find the activation energy the structure of the transition state was changed by decreasing H-F bond length by 0.01 to. 1.801 Å, meaning it was no longer at the transition state and it was closer to the structure of products HF and H. The activation energy was found by determining the change in Etot after the reaction (Figure 11).
The activation energy was found to be 0.268 kJ mol-1 for F + HA-HB -> F-HA + HB.

For the reverse reaction F- HB + HA -> F +HA-HB, activation energy was determined as 30.163 kJ mol-1 using the same method and Figure 12.
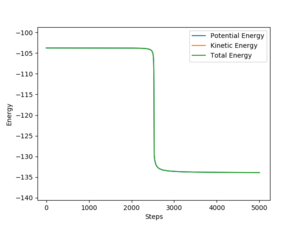
Figure 11 and 12 show the difference between total energy and potential energy showing the activation energy value as the difference here due to the structure of the system not being at the transition state.
Ng611 (talk) 19:51, 30 May 2019 (BST) Good!
Reaction Dynamics
Identify a set of initial conditions that results in a reactive trajectory for the F + H2, and look at the “Animation” and “Momenta vs Time”. In light of the fact that energy is conserved, discuss the mechanism of release of the reaction energy. Explain how this could be confirmed experimentally.
A set of initial conditions that result in a reactive trajectory for F + H2 is rHH = 0.74 Å, rHF = 1.79 Å and pHH = pHF = 0.
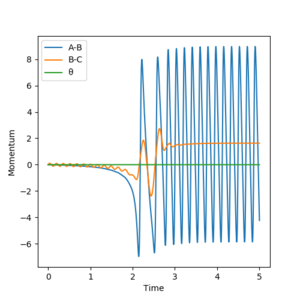
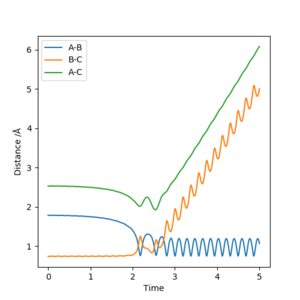
As shown in Figure 13, 14 and 15 below, the product HF is in a vibrationally excited state and continues to oscillate after the reaction as shown the changes in the black line showing the reaction pathway on the graphs. This reaction is exothermic, the initial H2 molecule doesn't vibrate as seen by the flat straight line on the momenta time graph which starts to oscillate when the product forms.
From the energy vs time graph, energy conservation is seen as kinetic energy is a minimum when potential energy is a maximum (Figure 15), the total energy is constant. The vibrationally excited HF product would pass its excess energy to the surroundings as heat (exothermic reaction) and collide with other gas molecules in a real reaction (no other gas molecules in this simulation). Could test this by measuring the energy stored in the HF vibrations using Femtochemical IR [8] which would show relaxation from the excited to ground state of the HF molecule. However, there are difficulties in measuring the transition state as it occurs on very small time periods.
Ng611 (talk) 19:54, 30 May 2019 (BST) Be more specific. What is femtochemical IR spectroscopy? How would it be useful? What would you expect to see? Also, it should go without saying that Wikipedia is a terrible source to cite-- If necessary, use wikipedia's sources.

Discuss how the distribution of energy between different modes (translation and vibration) affect the efficiency of the reaction, and how this is influenced by the position of the transition state.
Polanyi's Empirical Rules
Polanyi's Empirical rules state that vibrational energy is more efficient at activating a late transition state than translational energy (endothermic reaction - Hammonds Postulate) and that translational energy is more efficient in activating an early transition state in an exothermic reaction than vibrational energy is. [9] Therefore for a successful exothermic reaction according to this rule the molecules need an excess of translational energy compared to vibrational energy - suggesting reactants with more kinetic energy and less oscillations will be more likely to be successful.
In a chemical reaction there is an energetic barrier to reach the product which is the transition state (saddle point - highest value of potential energy) in the potential energy surface. F + H2 reaction is exothermic so the transition state is early according to Hammonds Postulate, the reverse reaction (FH +H) is endothermic and the transition state is late and resembles the products more (Hammonds Postulate).
Forward Reaction
F + H2 reaction with rHH = 0.74 Å, pFH = -0.5, rFH = 1.8 Å, explored values of pHH from -3 to 3.


Figure 16 and 17 show the forward reaction with a large amount of energy input as high value of momentum, the translational energy is pFH (energy between the two separate atoms) and the vibrational energy is pHH (energy in the bond). The H2 molecule collides with the F atom, the H-H bond didn't break despite there being surplus energy in the system as most of the energy transferred to H2 was vibrational and the H2 molecule oscillates more as shown by the graphs after the reaction with an increase in oscillations on the black line. This is another case of barrier recrossing as shown in Figure 17, due to the excess vibrational energy in HH causing the system to revert back to the reactants H2 and F from the products. This is exothermic so according to the Polanyi rules translational energy is more effective in activating the early transition state but in this case the energy in the system is mainly vibrational energy and hence is not as effective in taking the reaction to completion. With higher values of momentum given to FH and lower for HH the reaction was more likely to be successful in simulations run and this followed the Polanyi rules.
With higher amounts of energy in a chemical system the reactions are expected to go faster as there is more energy however as shown by Polanyi's principle this is only if the right type of energy is present in products and reactants.
F + H2 reaction with rHH = 0.74 Å, pFH = -0.8, rFH = 1.8 Å and pHH=0.1
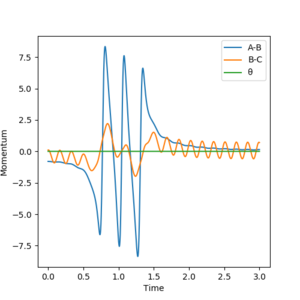
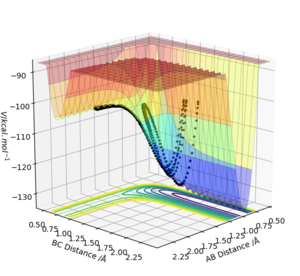

With the above conditions the system has much lower energy, there is less vibrational energy (oscillations are smaller on the graph). The reaction goes to completion as translation energy has increased and this reaction follows the Polanyi principle and makes the exothermic reaction more efficient than before. The product is more vibrationally active as seen by the increase in the oscillations on the momenta graph in Figure 18 and the increased degree of oscillations in the products in Figure 19.
Reverse reaction
HA + HB-F → HA-HB + F with rHH = 2 Å, pFH = 7.1, rFH = 0.9 Å, pHH= -0.5
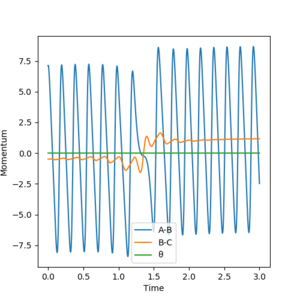

The translational energy is pHH and the vibrational energy is pFH in the reverse reaction.
This reaction is endothermic so the transition state is late (Hammonds Postulate) and therefore according to Polanyi's Rules vibrational energy is more effective in activating the late transition state. This was seen above in Figure 21 and 22, with lower values of pFH no reaction occurred but once it was increased and more vibrational energy (more oscillations of F-H bond) was added to the system the reaction was more efficient and went completion. The oscillations of the reverse reaction products are less than in the forward as a result of the reaction being endothermic and taking in energy from the surroundings. This is also an example of Polanyi's rules as increased vibrational energy in the FH bond caused the reaction to go to completion rather than when there was large translational energy input in the system.
Therefore, Polanyi's principle is a good indicator of if a reaction will go to completion if the reaction dynamics are known such as if it is endothermic or exothermic, initial momentum and internuclear distances, however in situations such as earlier on when barrier recrossing took place this rule was not applicable. This shows the limitations of a rule that doesn't allow quantum mechanically allowed situations such as tunnelling and barrier recrossing.
Ng611 (talk) 19:59, 30 May 2019 (BST) It's good to remember polanyi's rules are more like 'guidelines' than actual rules. Also important to note is that: (a) barrier recrossing is not a quantum mechanical effect (although tunneling is and it does indeed affect the accuracy of TS theory) (b) quantum mechanical or not, TS recrossing does not affect the validity of polanyi's rules as the rules simply address whether a reaction goes to completion or not (regardless of how many times it recrosses the barrier)
References
Template loop detected: Template:Reflist
- ↑ ChemLibre Texts [Accessed May 2019] https://chem.libretexts.org/Bookshelves/Physical_and_Theoretical_Chemistry_Textbook_Maps/Supplemental_Modules_(Physical_and_Theoretical_Chemistry)/Quantum_Mechanics/11%3A_Molecules/Potential_Energy_Surface
- ↑ J. Phys. Chem. A, 2005, 109 (7), pp 1400–1404, DOI: 10.1021/jp045262s
- ↑ J. I. Steinfield, J. S. Francisco, W. L. Hase, Chemical Kinetics and Dynamics, Pearson, 1998
- ↑ D. C. Elton, Transition State Theory for Physicists, 2013.
- ↑ Wikipedia - Endothermic Processes https://en.wikipedia.org/wiki/Endothermic_process [Accessed May 2019]
- ↑ Wikipedia - Transition States https://en.wikipedia.org/wiki/Transition_state [Accessed May 2019]
- ↑ Wikipedia - Hammond's Postulate, https://en.wikipedia.org/wiki/Hammond%27s_postulate [Accessed May 2019]
- ↑ Wikipedia - Observing Transition States, https://en.wikipedia.org/wiki/Transition_state [Accessed May 2019]
- ↑ Z. Zhang, Y. Zhou, D. H. Zhang, J. Phys. Chem. Lett., 2012, 3, 3416-3419.
