MRD:aec 18
4/5 - A nearly perfect report, well done-- the only major issue is a lack of examples for the endothermic reaction in the final section. Otherwise, everything here is excellent, well done.
Introduction
Transition State
On a potential energy surface diagram, how is the transition state mathematically defined? How can the transition state be identified, and how can it be distinguished from a local minimum of the potential energy surface?
On a potential energy surface, the transition state is mathematically defined by; ∂V(ri)/∂ri=0 whereby the gradient of the curve is zero. The transition state is a local maximum between two minima which the lowest energy reaction path passes through. The potential energy of a given reaction rises an amount equal to the activation energy and here the transition state point is located. After this activated state is formed the energy will decrease to the products energy. The relative energies of reactants in terms of the relative product energies determine the endothermic or exothermic nature of the reaction.1
The transition state is found at the 'saddle point' 2 where the derivatives of the slopes in orthogonal directions are zero. The a maximum point can be distinguished from a minimum by by looking at a second differential and finding if its less than or more than zero. For a positive second differential, the point will be a minimum and for negative a maximum.
Good answer! Think also about the directions you need to take the second derivatives along. Where will these directions lie on your PES?

A potential energy profile for both exothermic and endothermic reactions are shown below: the activation energy is indicated on the diagram. The general course of the reaction in this experiment is B and C are initially joined by a chemical bond which A distorts when the in contact at the right conditions (distance, r values and momentum, p values), causing an exchange in atoms as new bond forms and existing bonds break. In this report r1 = BC bond distance and r2 = AB. The reaction co-ordinate on the x axis represents the progress of the reaction and thus the changes in atomic distortion as described above. In figure 2 the gradient at the TS shown is zero and can be confirmed to be a maximum with the second differential giving a negative value.
At the transition state two reactant molecules have come into such close proximity that a small change will send them in the direction of the products (or back to reactants).
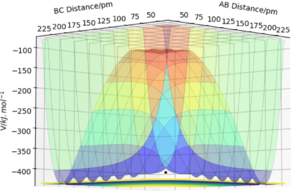
For a symmetrical system such as H-H-H described in section 2, the transition state lies at the point shown in figure 1. The reactant and product energies are equal and the TS therefore lies along the y=x line (r1=r2 at the TS).
Transition state theory is used with statistical thermodynamics to provide a more detailed calculation of rate constants by identifying the contributing factors in the reaction model. 3
Locating the transition state for the H-H-H system
Report your best estimate of the transition state position (rts) and explain your reasoning illustrating it with a “Internuclear Distances vs Time” plot for a relevant trajectory
The transition state shown in fig.1 can be estimated by finding distances AB=r1 and BC=r2 whereby the force /kJ.mol-1.pm-1 is equal to zero. As the H + H2 surface is symmetric, r1 and r2 are equal at this point (TS lies on y=x line). The momentum is set to zero at the transition state point.
It was found that a distance of r1=r2=90.775 pm (90.8 pm to 1.d.p) gave forces of 0.00 kJ.mol-1.pm-1 along AB and BC; this is where the transition state position can be estimated to. It can also be noted that at this point one eigenvalue (ω2) is positive and the other is negative, in accordance to Hessian matrix, more on this in section 4.
Correct answer, well done!
At the transition state point
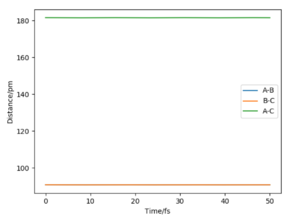
As the point reaches the transition state for this reaction, the bond distance lines on the internuclear distance against time plot becomes horizontal. At this point the distances are not fluctuating as the bonds do not oscillate and so appear as constant over time on the graph.
Nice!
Trajectory investigation
Trajectories from r1 = rts+δ, r2 = rts
Comment on how the mep and the dynamic trajectory differ
The minimum energy reaction path is a path in which the velocities are re-set to zero after every time step.
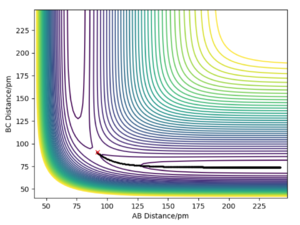
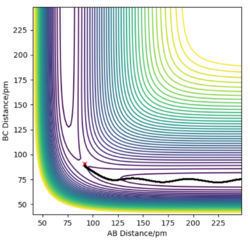
We can set the conditions of the reaction to where it is 'nugged' lol slightly from the trastition state point, still at zero momenta. The conditions below were used:
r1 = rts + 1 and r2 = rts pm : r1 = 91.8 and r2 = 90.8
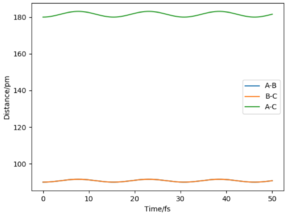
On the left we can see the MEP trajectory shows the path of the reacting molecules does not oscillate; and on the right the dynamic trajectory which shows the molecule is oscillating. This is expected for a mep as the particle has infintely slow motion as its velocity is reset to zero in every step. This trajectory shows the reaction conditions to be unreactive as the reactants are reformed at the end (energy does not reach activation energy and TS is not passed).
Absolutely correct, well done!
| MEP | Dynamic |
|---|---|
 |
|
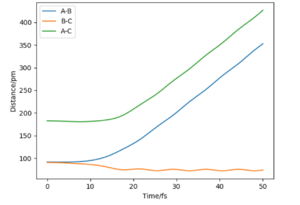
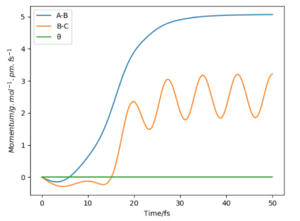
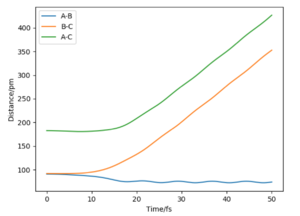
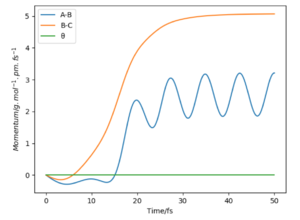
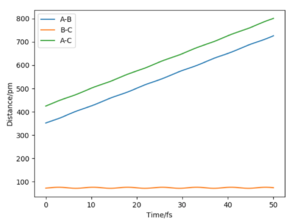
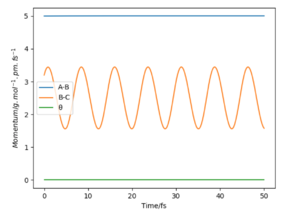
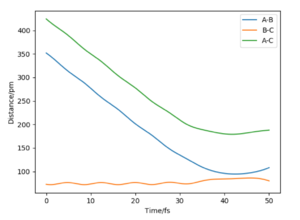
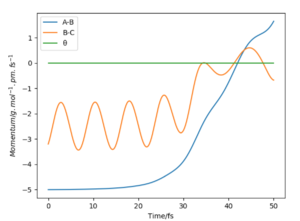
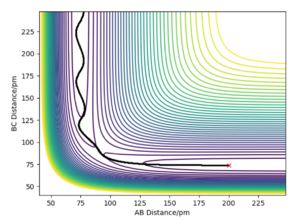
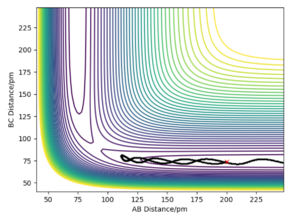
If we were to change the initial conditions r1 = rts and r2 = rts+1 pm : r1 = 90.8 and r2 = 91.8, we can observe the effect this will have on the “Internuclear Distances vs Time” plot and the “Momenta vs Time” plot. For these examples (fig.3) the reaction does occur as the internuclear distance plot shows BC distance decreasing and AB (reactant) increasing. The momenta plots show that the BC bond is distorted back and forth (oscillates) whilst the AB bond gradually breaks. This is reversed in fig.4 when the transition state in 'nugged' in the opposite direction.
The final distance and momentum values can be found from these plots (using the 'get last geometry' tool) and a calculation can be set up where the initial positions correspond to the final positions of the trajectory above. And when momenta values signs are reversed. By reversing the momenta the reaction now occurs as the molecules collide with enough energy to reach activation. When both signs are positive (first row) no reaction occurs as the molecules move in opposite directions.
Did you round your momenta here? You should see the reaction happen in reverse, starting at the products and ending at the TS, where it stays. You seem to have overshot a bit as your momenta dont converge to 0.
Reactive and unreactive trajectories
Complete the table above by adding the total energy, whether the trajectory is reactive or unreactive, and provide a plot of the trajectory and a small description for what happens along the trajectory. What can you conclude from the table?
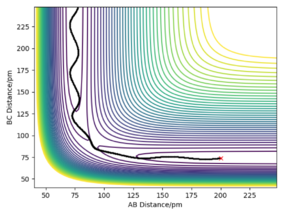
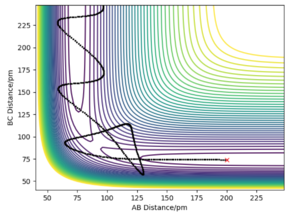
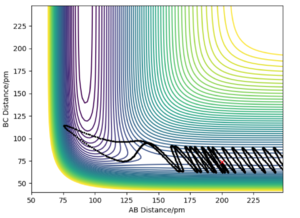
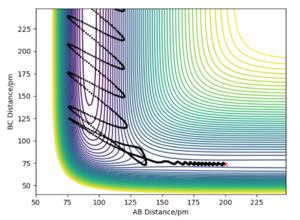
In the following table the values r1 and r2 were set to 74 pm and 200 pm respectively.
From the table there seems to be no correlation between the total energy of each system and wether the reaction proceeds or not. However there does seem to be increased correlation between the increase in energy (less negative) and the ability for the trajectory course to pass over the transition state multiple times. There is also no correlation between increased total momenta and reactivity.
Transition State Theory
Given the results you have obtained, how will Transition State Theory predictions for reaction rate values compare with experimental values?
There are three main assumptions transition theory makes when predicting values3:
1. Molecular systems which pass the transition state will continue to products and do not turn back and form reactant molecules again. For example there can be fluctuations between reactants and transition state but once transition state is reached all is converted to product R <=> TS -> P. Once the energy barrier between reactants and transition state is overcome (activation energy) the reaction will proceed to form products.
2. The energy distribution among the reactant molecules is in accordance with the Maxwell-Boltzmann distribution. It is assumed the concentration of TS can be calculated using quasi-equilibrium theory, as the system only deviates from equilibrium by an infinitesimal amount.
3. Quantum effects can be ignored and a reaction can be fully assumed as classical motion. Effects such as quantum tunnelling are ignored, leading to an underestimate of rate.
Example four in the table does not obey assumption 1 above as it displays a trajectory that passes over the transition state and then passes back over to reform reactants. Example 5 also crosses the transition state and then back to reactants (and then crosses for a third time), not obeying this assumption. The rate determining step is the TS-> P and so, as a result the TS theory would overestimate the actual observed rate constant for these trajectories. This mean that overall the TS theory overestimates our experimental values, despite the fact effects such as quantum tunnelling are ignored which would lead to an underestimate (smaller contribution compared to the explained above).
This is absolutely the case, well done!
F - H - H System
PES inspection
By inspecting the potential energy surfaces, classify the F + H2 and H + HF reactions according to their energetics (endothermic or exothermic). How does this relate to the bond strength of the chemical species involved?
The F + H2 system was analysed using the following conditions:
A = F : B = H : C = H
r1=BC=74 pm : r2=AB=230pm
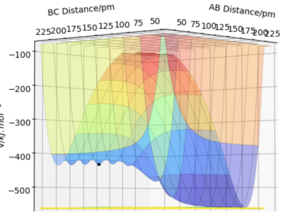
For an unsymmetrical system, the potential energy surface shown in fig.5 can be analysed to determine the exothermic or endothermic nature of the reaction. From this plot we can see that the energy of the reactants is larger than the energy of the products (AB product is a smaller energy value than BC, the reactant) and so by using this in conjunction with fig.2 we can see that the overall process would be exothermic, as energy is released between the BC bond break and AB bond formation.

This knowledge can be related to the strength of the chemical species involved, as the reactant bond strength H-H is less than the product bond strength H-F and so more energy is given out when bonds form compared to the energy required to break bonds.
In the second experiment, the H H-F system, the following conditions were used:
A = H : B = H : C = F
r1=BC=74 pm : r2=AB=230pm
Here, in fig.6 we can see the surface plot for this reaction, which shows it to be endothermic. This can be seen from the fact the products are higher in energy than the reactants (AB larger value than BC) and so the energy required to form bonds is larger than the energy released when bonds are broken. This evidence supports the theory that the H-F bond is stronger than the H-H bond, of which the exact bond strength values can be calculated as seen in the following section. Good!
Locate the approximate position of the transition state
The transition state of both reactions can be approximated by trial and error method. We know from part one that the transition state can be found by using a calculation that results in the forces along AB and BC to be zero. We also know that the Hessian matrix can be used to identify that one eigenvalue is positive and one negative at the transition state. Furthermore, Hammond's postulate can be used to indicate the location of the TS. Hammond's postulate states that the transition state will resemble either the reactants or the products, depending on which it is closest in energy to. The TS for an exothermic reaction (fig.2 and fig.5) will be closer in energy to the reactants, whereas for an endothermic reaction it will be closer to the products.
Using this above information 'trials' were conducted to locate the transition state. This was found to be at the position indicated in the table below.
| BC r1 bond distance /pm | AB r2 bond distance /pm | p1=p2 momentum /g.mol-1.pm.fs-1 | Etot /kJ.mol-1 | Forces along BC /kJ.mol-1.pm-1 | Forces along AB /kJ.mol-1.pm-1 | ω2 /kJ.mol-1pm-2 |
|---|---|---|---|---|---|---|
| 74.5 | 181.5 | 0 | -433.981 | -0.007 | +0.000 | -0.002 and +0.332 |
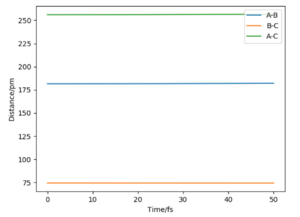
At this point the internuclear distance vs time plot shows two horizontal straight lines as the product and reactant bonds are not changing (in oscillation).
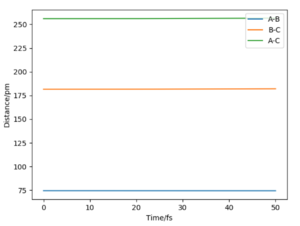
The transition state for the H H-F system is the same as in the previous example but with the values reversed, where A=H B=H C=F;
| BC r1 bond distance /pm | AB r2 bond distance /pm | p1=p2 momentum /g.mol-1.pm.fs-1 | Etot /kJ.mol-1 | Forces along BC /kJ.mol-1.pm-1 | Forces along AB /kJ.mol-1.pm-2 | ω2 /kJ.mol-1pm-2 |
|---|---|---|---|---|---|---|
| 181.5 | 74.5 | 0 | -433.981 | +0.000 | -0.007 | +0.332 and-0.002 |
Report the activation energy for both reactions.
The activation energy can be found by calculating the initial energies of the reactants and finding the difference between this and the total energy. There are two way of doing this which have been explored.
The first is to set the bond distance of the F atom to so far away from the H2 that it can be assumed to be not interacting with the H2. From this we can work out the energy of the H-H bond alone, and use this value in the activation energy. For the F + H2 example, the total energy plateaus at approximately AB=700pm where total energy = -435.057.
| BC r1 bond distance /pm | AB r2 bond distance /pm | p1=p2 momentum /g.mol-1.pm.fs-1 | Etot /kJ.mol-1 |
|---|---|---|---|
| 74.5 | 700 | 0 | -435.057 |
The total energy of the system at the transition state is taken as -433.981 kJ.mol-1. Therefore these values give us an overall activation energy of:
Activation energy: -433.981--435.057 = 1.076 kJ.mol-1
The other method is to perform a series of mep plots and find the value the 'jump' in energy tends to; this is the activation energy, fig.9.
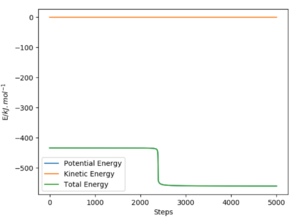
For the H HF system the H-F bond distance r1 is set to 91 pm and again r2 is increased until no interactions occur.
| BC r1 bond distance /pm | AB r2 bond distance /pm | p1=p2 momentum /g.mol-1.pm.fs-1 | Etot /kJ.mol-1 |
|---|---|---|---|
| 91 | 700 | 0 | -560.404 |
Activation energy: -433.981--560.404 = 126.432 kJ.mol-1
Good assumptions for Ea in both directions, well done!
Reactions dynamics
In light of the fact that energy is conserved, discuss the mechanism of release of the reaction energy. Explain how this could be confirmed experimentally.
The table below results in a reactive trajectory for the F + H2 system:
| BC r1 bond distance /pm | AB r2 bond distance /pm | p1(pHH) momentum /g.mol-1.pm.fs-1 | p2(pHF) momentum /g.mol-1.pm.fs-1 | Etot /kJ.mol-1 |
|---|---|---|---|---|
| 74.5 | 150 | -9 | -1 | -363.066 |
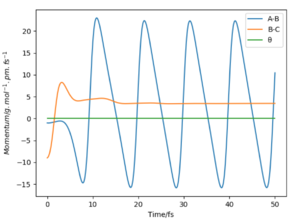
In this reaction, potential energy is converted to kinetic energy. From the momenta time plot above, we can see the potential energy in B-C as the bond is broken converts to kinetic from the oscillating motion of the A-B bond (increase and decrease in momentum on graph). The two possibilities for the release in bond energy from the reactants to the products is through translational or vibrational kinetic energy (rotational and electronic energy are ignored).
Whether the reaction releases energy via translational or rotational energy can be found by IR spectroscopy.
In both reactions the H-H and H-F will initially be at the ground state. As the energy of the systems increases the electrons can be promoted to the first energy level. From this excited state one of two things may occur: the electron might decay back to the ground state or gain enough energy to be further promoted to the second excited state. In IR spectroscopy the number of peaks can determine which of these two processes occurred. If the electron was promoted to the first state only then one peak will be shown on the absorption spectra. This is the fundamental peak and will be the largest as most transitions occurring will be this one. If some electrons are promoted from 1st to 2nd state then two peaks will be shown on the spectra. The second peak will be at a lower wavenumber as the energy difference between the 1st and 2nd state is smaller than the energy difference between the 1st and ground state (anharmonic oscillator).
If the process was via vibrational energy then the two peaks will show on the spectrum as described above. If it was by by translational then only the fundamental peak will be present as there is no promotion to higher energy levels.
Good discussion!
Discuss how the distribution of energy between different modes (translation and vibration) affect the efficiency of the reaction, and how this is influenced by the position of the transition state.
Polanyi's rules4 state that vibrational energy is more efficient than translational energy in activating a late-barrier reaction, with the reverse true for an early barrier reaction. Going by this theory, the exothermic F + H2 reaction should be activated by mainly translational energy; and the endothermic H + HF reaction mainly vibrational energy.
Vibrational energy is better for overcoming the endothermic energy barrier as the direction of vibrational motion can align with the direction that goes to the products. If translational energy was solely used the trajectory would not curve around in the correct direction to form products.
Exothermic reactions have a much smaller energy barrier and so do not require the energy to be in the correct direction as with endothermic reactions. They work better with higher translational energy.
Excellent, although I'd have liked to have seen some examples for endothermic reactions as well.
References
1. Atkins, P. and De Paula, J., 2013. Atkins' Physical Chemistry. 11th ed. Oxford: Oxford University Press, pp.792-794.
2. Saddle points. 2020. [video] Directed by K. Academy. Available at: <https://www.khanacademy.org/math/multivariable-calculus/applications-of-multivariable-derivatives/optimizing-multivariable-functions-videos/v/saddle-points> [Accessed 22 May 2020].
3. Steinfeld, J.and Francisco, J. and Hase, W. Chemical kinetics and dynamics. 2nd ed. Upper Saddle River: Prentice-Hall, pp.287-321.
4. Chemistryviews.org. 2020. New Rules For Reaction Dynamics :: News :: Chemistryviews. [online] Available at: <https://www.chemistryviews.org/details/news/1378289/New_Rules_for_Reaction_Dynamics.html> [Accessed 22 May 2020].
Bibliography
1. Atkins, P. and De Paula, J., 2013. Atkins' Physical Chemistry. 11th ed. Oxford: Oxford University Press.
3. Steinfeld, J.and Francisco, J. and Hase, W. Chemical kinetics and dynamics. 2nd ed. Upper Saddle River: Prentice-Hall.


