MRD:ach2718project
H2 + H system
Setting up of the system
The initial conditions of the system were set as follows:
| Distance r1 /pm (BC) | Distance r2 /pm (AB) | Momentum p1 / g mol-1 pm fs-1 (BC) | Momentum p2 / g mol-1 pm fs-1 (AB) |
|---|---|---|---|
| 74 | 230 | 0.0 | -5.2 |
Figure 1: Initial Conditions
The value of r1 is initially fixed at 74pm as BC are a H2 molecule with fixed bond length. Hydrogen atom A approaches the molecule , thereby decreasing the value of r2, until the system reaches the transition state, at which the values of r1 and r2 are the same. This is a value we will look for. Finally, AB form the H2 molecule and C is now a H atom. The value of r2 is now fixed, and the atom can move away with negative momenta. The dynamic calculative system calculates the position and momenta between the particles at each point t. The initial conditions determinate the rest of the momenta and distances of this trajectory. Many aspects of this collision can be observed, such as the internuclear distance, the momentum, the energy and the velocity as a function of time. Using this information a trajectory can be plotted along a potential energy surface, to help observe the distribution of vibrational and translational energy in the products.
Observing the Trajectory
Traditionally, the energy diagrams previously studied have looked like this:
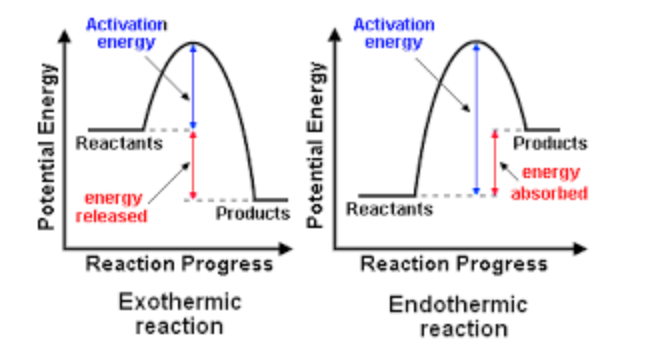 Figure 2: An endothermic and exothermic energy diagram1
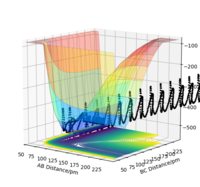
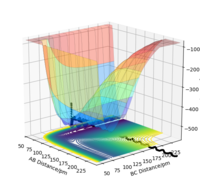
These diagrams are useful in looking at the minimum energy pathway of a reaction. The top of both diagrams corresponds to the transition state, the point of highest energy. At this point, the gradient is equal to zero. The derivative of potential energy over reaction coordinate is known as Force, therefore at the transition energy, the Force is also zero. In a 3D setting like seen below, the transition energy is trickier to find.
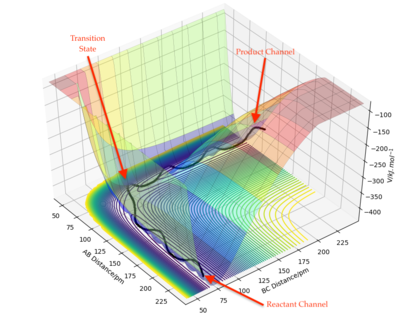
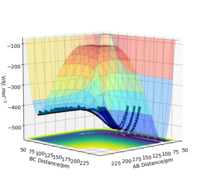
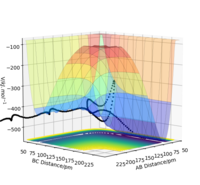
Figure 3: A potential energy surface showing the trajectory of this system
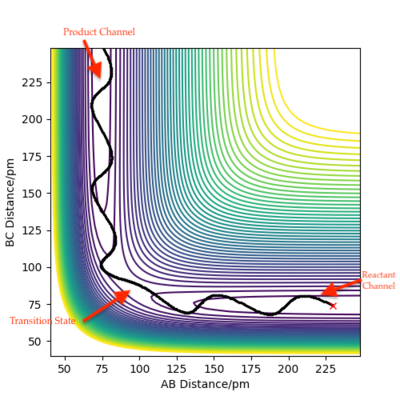
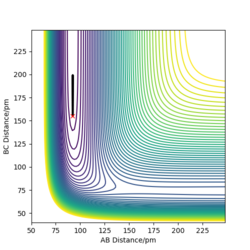
Figure 4: A contour plot of the trajectory using the initial conditions set above
From this figure we can see the potential energy surface diagram for the setup above. The transition state, as stated above, is the maxima point on a minimum energy diagram of a reaction. On either side of it can be found the points of reactants and products, which are of lower energy. The transition point can also be found on a potential energy surface diagram, as the saddle point.2 This can be explained by the fact that this point is a maximum for the minimum energy diagram, but the minimum when looking in an orthogonal direction. The coloured "surface" shows clearly that this point is a minimum, where as the counters show it is a maximum. The saddle point is importantly distinguished from the minima/maxima by having this particular feature. For the H2 + H system, any maxima, minima or saddle point can be defined as the point where both partial derivatives of potential energy are equal to zero. These can then be mathematically distinguished with a formula using the second partial derivatives of the potential energy, but here we will find them by pinpointing the position where the trajectory does not move when positioned exactly on it and with zero momentum. Yes. Good use of these diagrams and references to emphasise your point. Can you also write down the properties of the saddle point mathematically? Mak214 (talk) 09:50, 22 May 2020 (BST)
Locating the Transition state
As said before, the transition state is identified as a saddle point. This means the gradient at this point is equal to zero, and therefore the Force = 0 N. In this system, due to the symmetry, it is not exothermic or endothermic, and therefore the distances AB and BC should be identical for the transition state. Using the calculated Force kJmol-1 .pm-1, by varying the value of r1=r2, we can find the value of the transition state r ts.
| Distance r1 /pm (BC) | Distance r2 /pm (AB) | FAB / kJ mol -1 pm -1 | FBC / kJ mol -1 pm -1 |
|---|---|---|---|
| 230 | 230 | -0.483 | -0.483 |
| 150 | 150 | -1.759 | -1.579 |
| 100 | 100 | -1.166 | -1.166 |
| 90 | 90 | +0.132 | +0.132 |
We can see a change of sign, suggesting the value of rts lies between 90 and 100pm. We can look in this region to find a more precise value.
| Distance r1 /pm (BC) | Distance r2 /pm (AB) | FAB / kJ mol -1 pm -1 | FBC / kJ mol -1 pm -1 |
|---|---|---|---|
| 95 | 95 | -0.621 | -0.621 |
| 91 | 91 | -0.037 | -0.037 |
| 90.775 | 90.775 | 0.000 | 0.000 |
Figure 5: Table showing the value of the transition state
Therefore this is the point where r1 = r2 = rts = 90.775 pm
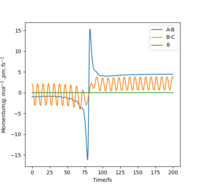
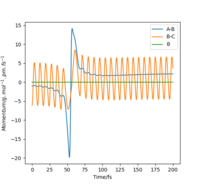
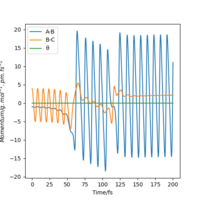
This can be confirmed by locating the point of transition state on an Internuclear distance against time graph. The point at which the vibrational energy of reactants and products cross corresponds to the Transition state, and this point we can see is around 90 pm, as expected. This internuclear distance against time graph shows that initially the Hydrogen molecule was vibrating slightly, and the other hydrogen atom is approaching it, as the distance between them is decreasing. However, at the point the lines cross, this is the transition state, and the distance B-C increases a lot as the C Hydrogen is now an atom, where as the B hydrogen has formed a hydrogen molecule with the previously incoming A hydrogen atom. The AB Hydrogen molecule then vibrates, we can see this via the periodic oscillations shown in the figure below.
Figure 6: Internuclear distance against time graph
MEP and Dynamic Trajectories
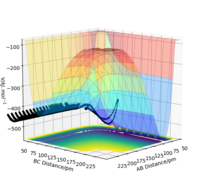
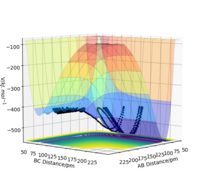
The reaction path, or minimum energy path calculates trajectory by setting the momenta and velocity of both particles to zero at each step, known as infinitely slow motion. Once it reaches a local minima, it cannot roll back up as there is no potential gain, and no momentum. It will stay here. By displacing the transition state by 1pm, we can observe the significance in the difference between MEP and dynamic calculation methods.
We can see from the MEP diagram that there are no oscillations under these conditions and the particle follows the valley floor for H1 + H2-H3. However in the dynamic calculation, the trajectory is oscillating as the momenta varies from each step. This is a more realistic calculation type as there is always vibrational energy experienced by the particles, which is deliberately ignored in the MEP calculation type. Good. Mak214 (talk) 09:51, 22 May 2020 (BST)
Figure 7: MEP and Dynamic Calculations using the conditions set above
Trajectories around the transition state
| r1 = rts+1 pm and r2 = rts | r1= r2 = rts | r1 = rts and r2 = rts+1 pm | |
|---|---|---|---|
| Internuclear Distance against Time | 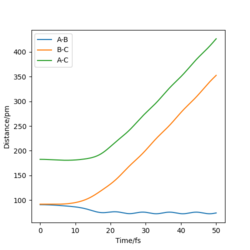 |
 |
|
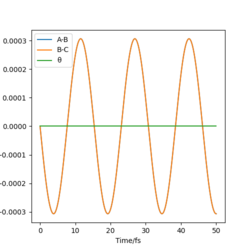
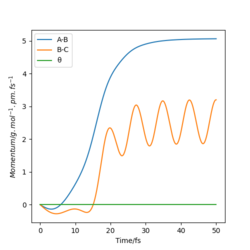
| Momenta against Time | 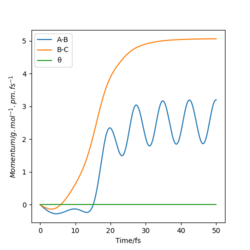 |
 |
|
Figure 8: Table showing small direction changes about the transition state
We can see for the slight change in r1, the AB molecule is vibrating periodically, corresponding to the seen oscillating momentum AB, and C is moving steadily away from the AB molecule, increasing the internuclear distance BC.
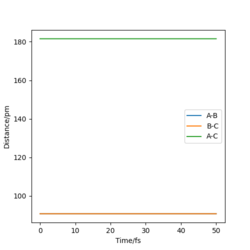
When the distances are both equal to the transition state internuclear distance, A and C very weakly oscillate about B, hence the oscillation can be seen in the momenta diagram. These are so small, no change in intermolecular distance can be seen.
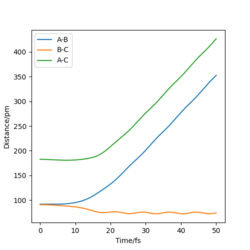
Finally, for the slight change in r2, now the B-C distance is only weakly oscillating and the A-C distance is increasing as the A atom moves from the molecule.
These diagrams show that by changing the conditions slightly away from the transition state values, the reaction pathway completely changes, towards the products or reactants. We have successfully found the transition state coordinates. The reason there is so much change about this point is due to it being on a maxima. Therefore if it is slightly displaced in either direction, it will show very different behaviour.
Reactive and unreactive trajectories
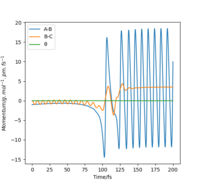
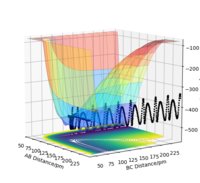
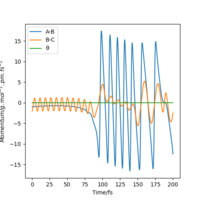
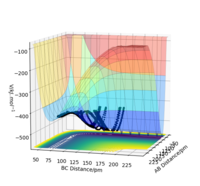
| p1/ g.mol-1.pm.fs-1 | p2/ g.mol-1.pm.fs-1 | Etot /kJ mol-1 | Reactive? | Description of the dynamics | Illustration of the trajectory |
|---|---|---|---|---|---|
| -2.56 | -5.1 | -414.280 | Yes | The reaction takes place, the products vibrate to a greater degree than the reactants, their oscillations are more visible on the trajectory. | 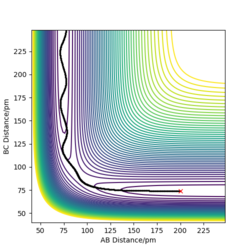
|
| -3.1 | -4.1 | -420.077 | No | The reaction does not take place, the particle had insufficient energy to overcome the activation energy barrier and therefore remains as product. | 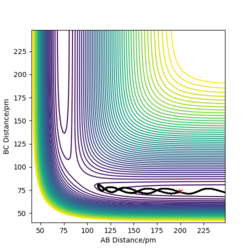
|
| -3.1 | -5.1 | -413.977 | Yes | The reactions takes place, similar to system 1. | 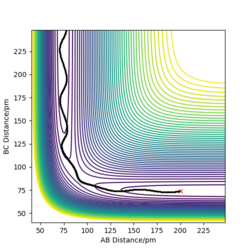
|
| -5.1 | -10.1 | -357.277 | No | Quantum tunneling takes place here, Look at my note below. Mak214 (talk) 09:44, 22 May 2020 (BST)
the particle can tunnel through the energy barrier. Despite passing through the transition state, this reaction does not take place and the reactants are reformed. ||
| |
| -5.1 | -10.6 | -349.477 | Yes | The trajectory crosses the transition state several times but the product is formed. The reaction takes place. | 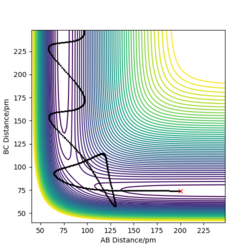
|
Figure 9: Table showing some tested initial conditions
The transition state theory is an important classical theory that incorporates the following assumptions:
- All systems with sufficient kinetic energy in the direction of the reaction coordinate greater than activation energy will be reactive.
- Molecular systems that have crossed the transition state in the direction of the products, can not then reform the reactants.
- Kinetic energy along the reaction coordinate follows a Boltzmann distribution.
Systems 1, 3 and 5 go to completion and therefore form the products. System 2 does not have sufficient energy to cross the activation energy barrier and therefore remains as products. What we can see is that energy isn't the only factor for a reaction to go to completion, other factors include orientation and the initial conditions we have put in. This shows the first flaw in the transition state theory, as the transition state theory suggests a reaction goes to completion in accordance to the amount of energy it has, and if it reaches the transition state, it will form the products. In reality, the system can reach the transition state but will often not form the products. This will affect the rate of the system, the transition theory will very much overestimate the rate This is good. Mak214 (talk) 09:44, 22 May 2020 (BST) . In system 4 we can see quantum tunnelling take place. But here you are not correct. Mak214 (talk) 09:44, 22 May 2020 (BST) Transition state theory is a classical theory, and therefore does not take into account any quantum tunnelling, a phenomena we can see in system four. Quantum tunnelling is when while a particle does not have sufficient potential energy to overcome the energy barrier, and can instead tunnel through the energy barrier. The heavier the atom, the less the probability of tunnelling, thus the probability of this happening is very small and although this would increase the rate, it is such a small affect that in total we can conclude the transition theory overestimates the rate. You are right overall, but please take a minute to think about system 4 again. Yes quantum tunnelling is overlooked by TST, but that is not what we observe for system 4. You say that quantum tunnelling would increase the rate which is true but what we see for system 4 is in fact an overall unreactive trajectory that has crossed the TS. The system 4 result therefore disproves the second assumption of TST. And suggests that the rate would overall be overestimated by TST. Mak214 (talk) 09:44, 22 May 2020 (BST)
F + H2 system
Introduction
Hammond's postulate will be an important topic in the following system. This system is not symmetric, and therefore the transition state will no longer be exactly between the reactants and products. Simply put, Hammond's postulate states that the position of the transition state in terms of energy will give an idea on the structure of the system at the transition state. A system with an early transition state will have a transition state that will resemble the structure of the reactants as they are similar in energy. Similarly, a reaction with a late transition state will resemble the product in structure.
The system studied is the forward and backward reaction of H2 and F. This forms HF + H.
For the forward reaction, F + H2, we can observe the potential energy surface diagram and see that the products are lower energy than the reactant. This suggests an exothermic reaction. The transition state is close in energy to the reactants.
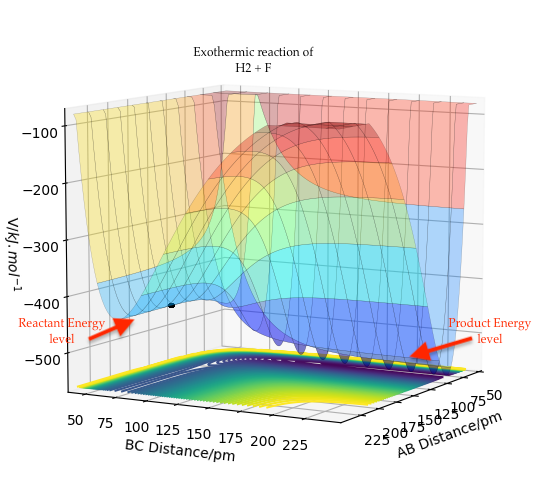 Figure 10: Exothermic reaction of F + H2
For the reaction H + HF, the products are higher in energy than the reactants, and the reaction is therefore endothermic. The transition state is close in energy to the products, as expected.
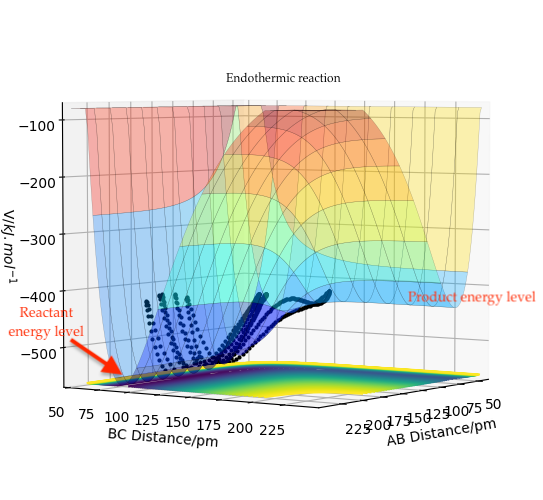 Figure 11: Endothermic reaction of H + HF
Great. Mak214 (talk) 13:35, 24 May 2020 (BST)
Locating the transition state
Exothermic and endothermic reactions tie in with Hammonds postulate. An exothermic reaction has an early transition state, and therefore the transition state should resemble the reactants, H2 and F. Similarly for the backward reaction, the transition state is a late one and resembles the products, H2 and F. We can therefore use the data previously found for H2, and say rHH for the transition state is 74 pm.
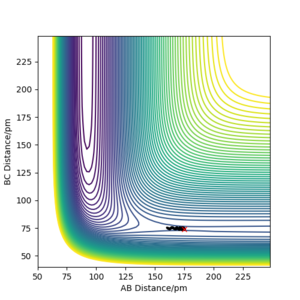
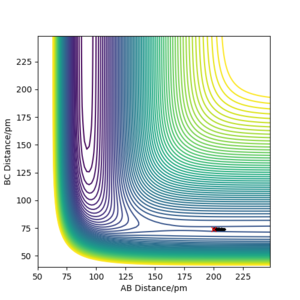
By looking at the contour plot, the reaction can be observed as exothermic. This can be seen as the transition state is found close to the reactant side. We can then try values 175 pm and 200 pm for length AB.
Figure 12: Plots showing the variation of rHF
Clearly the transition state maxima is found between these lengths. When at AB=175 pm, the trajectory goes to the product side of the energy barrier, whereas when at 200 pm the reactants are reformed. It is similar to an analogy of a ball on a hill. Dependent on the placement of the ball, it will roll down opposite sides of the hill. We want to place the ball exactly at the top, so it does not roll.
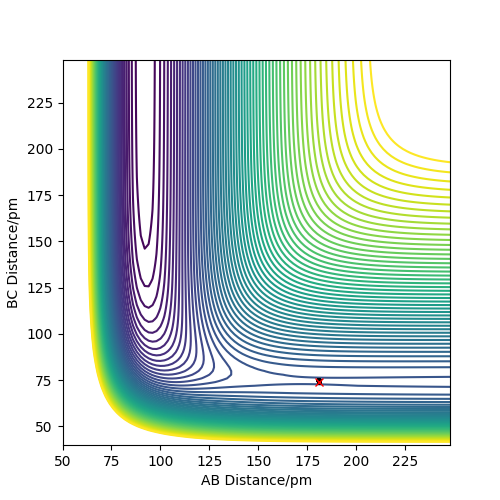
We can conclude the transition state value must lie between these two distances for AB. A good estimate found was rFH= 181.3 pm and rHH = 74 pm. This can be confirmed by the contour plot below. Well done. Mak214 (talk) 13:36, 24 May 2020 (BST)
Figure 13: Transition state for the system
Finding activation energy
Forward reaction, H2 + F
For the forward direction of the reaction, where H2 and fluorine form HF and F. The activation energy can be found by finding the energy value at the transition state and the minima corresponding to the reactants. Several values were found until the value of energy for the minima stopped changing.
| Distance rFH /pm | Energy / kJ mol -1 |
|---|---|
| 181 | -433.940 |
| 185 | -433.963 |
| 195 | -434.072 |
| 220 | -434.730 |
| 300 | -434.976 |
The activation energy here is:
Ea = -433.940 - -434.976 = 1.036 kJ mol-1 Well done! Mak214 (talk) 13:34, 24 May 2020 (BST)
Back reaction, HF + H
To find the activation energy here, the minima required is on product channel side. On an endothermic energy path diagram, the activation energy is usually much greater for an endothermic reaction, and therefore we would expect a much larger value here. To find this, the value of rHH was increased in order to find a value for the minima. A value of rHF was set to 92pm, using the contour graph in figure ??? to find a distance for the products.
Figure 14: Shows the position of the product channel and the values of rHH and rFH that should be investigated
| Distance rHH /pm | Energy / kJ mol -1 |
|---|---|
| 150 | -554.251 |
| 200 | -559.348 |
| 300 | -560.578 |
| 400 | -560.685 |
The activation energy here is:
Ea = -433.940 - -560.685 = 126.7 kJ mol-1. Good work Mak214 (talk) 13:34, 24 May 2020 (BST)
Reaction Dynamics
Testing different conditions for the H2 + F system
Where rHH = BC and rFH = AB
Figure 15: Table testing initial conditions on the H2 + F system
Finding a reactive trajectory
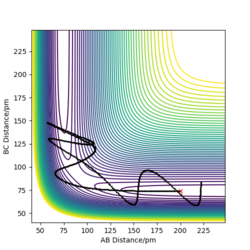
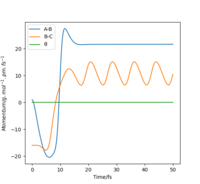
In order to see a reactive trajectory, the transition state must be crossed and products formed. To find the reactive trajectory for the H2 + F system, data from the reaction dynamics section was used. The HF + H system was found by finding the position of the product channel in the contour plot, and varying the momenta, increasing the kinetic energy of the incoming Hydrogen atom.
Figure 16: A reactive trajectory for both systems
Looking at the exothermic reaction, the energy released can be either via vibrational or translational energy. Average kinetic energy is directly dependent on temperature, therefore the kinetic energy released by translational energy is heat. Vibrational energy on the other hand is released as photons, as when the particle jumps down an energy mode it releases a photon that has the energy of the energy difference between energy levels. It can be useful to determine the energy released by these reactions, and particularly try to identify which type you see more of. A possible method is calorimetry, to detect change in temperature. However, the walls of the calorimeter also absorb the vibrational photons released, and therefore you can not distinguish which energy mechanism has been taken.
Another method is Infrared Radiation Spectroscopy. When a molecule is excited, it will vibrate, and may jump to higher energy levels. The harmonic oscillator approximation shows the quantisation of vibrational energy level according to the vibrational quantum number v. An energy jump from the ground state (Eo) to the first state (E1) is common as most particles are found on the ground state and have sufficient energy to move, however further jumps from the ground state to second energy levels or further are often not seen. These are known as overtones on a spectrum, and appear as much smaller in intensity and lower in wavenumber than the main peak. Another peak seen are hot bands, movements from energy levels other than ground state up to other energy levels.3 To see these peaks, a low temperature Fourier transform IR method would be useful, as overtones are often difficult to see at room temperature. The intensity of the overtone can give an indication of the mechanism of energy release. If a release is largely vibrational, you would expect to see a large overtone and a small change in temperature. If a release is largely translational, for a large temperature change you would see very small overtones.
Looking back at figure 16, a number of observations can be made. For the exothermic reaction, the reactants are predominantly showing translational energy behaviour, but the products are clearly oscillating in the trajectory and therefore there is more vibrational energy. In order to make exothermic reactions work, Polanyi's rules 4 suggest that by investing in more translational energy, the reaction will be more likely to go to completion. Translational energy is most affective when passing through an early energy barrier. This is because for an early energy barrier it is much more useful to have energy in the direction of the reaction coordinate, not wasting energy on vibrations, as you may then not have enough to overcome the barrier. 5 Similarly, for the endothermic reaction, the reactants can be seen vibrating much more, whilst the products have mainly translational energy. To make this reaction work, the energy invested should be vibrational energy, because you need more variation of internuclear distance to get close to the transition state structure. Vibrational energy is much more useful in a late energy barrier reaction.
Good work. All questions have been answered including some good discussion with references to relevant literature. Just check my comments at the end of section one! Thank you. Mak214 (talk) 13:33, 24 May 2020 (BST)
References
1. http://emmynam.weebly.com/hand-warmers.html , Date accessed: 15th May 2020
2. Atkins, P. W. Atkins' Physical Chemistry (2018), p806
3. https://chem.libretexts.org/Courses/Pacific_Union_College/Quantum_Chemistry/05%3A_The_Harmonic_Oscillator_and_the_Rigid_Rotor/5.03%3A_The_Harmonic_Oscillator_Approximates_Vibrations , Date accessed: 14th May 2020
4. Steinfeld, Jeffrey I., Francisco, Joseph S, and Hase, William L. Chemical Kinetics and Dynamics. 2nd ed. Upper Saddle River: Prentice-Hall, (1989), p272
5. Brouard M., Vallence C., Tutorials in Molecular Reaction Dynamics, (2015)

