MRD:ab6114
Molecular Reaction Dynamics
Exercise 1: H + H2 system
Question(1)
What value does the total gradient of the potential energy surface have at a minimum and at a transition structure? Briefly explain how minima and transition structures can be distinguished using the curvature of the potential energy surface.
Answer:
Analysis of the PES curvature shows a maxima between two minimum points, all being stationary points with a gradient of zero. The first derivative of the curve, where the rate of change is zero, is found to confirm this. As Transition structure's inherently exist at the maximum point, it can be inferred that the transition structure lies exists at this point. In order to differentiate between the transition state and the minima, second derivative calculations can be performed, producing a negative value for a maxima and a positive value for a minima.[1]
Question(2)
Report your best estimate of the transition state position (rts) and explain your reasoning illustrating it with a “Internuclear Distances vs Time” screenshot for a relevant trajectory.
Answer:
The approximate transition state position (r(ts)) was determined through analysis of the surface plot. This was confirmed by examining the internuclear distance vs time plot, to identify the point of intersection between the maxima and the minima - r(ts) is shown in the table below:
| r1 | r2 | r(ts) |
|---|---|---|
| 1.20 | 1.20 | 0.9075 |
| 0.91 | 0.91 | 0.9075 |
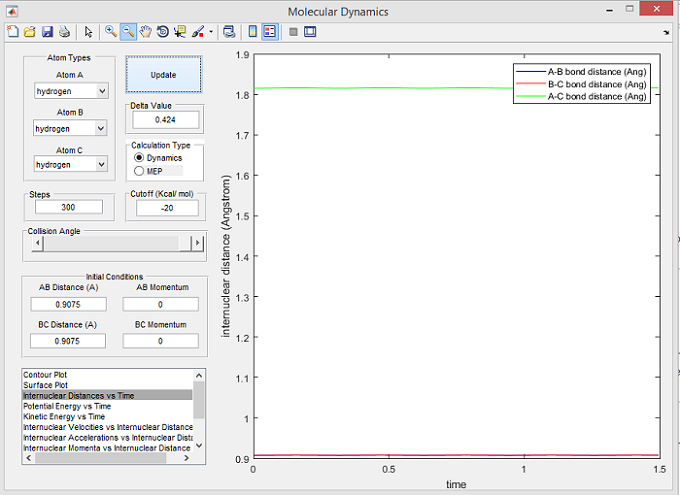
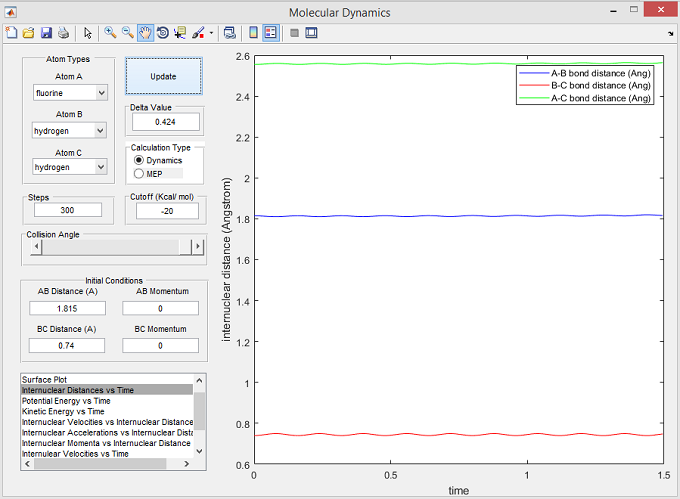
A transition state is a point where the internuclear distance between all bonds remain constant and thus do not oscillate. Figure 1 shows that the internuclear distance does not oscillate at 0.9075 Å - hence this is the transition state position.
Question(3)
Comment on how the mep and the trajectory you just calculated differ.
Answer:
Dynamic calculations and mep are distinct for two main reasons. Calculations of mep span only the distance engaged by the transition state, while the dynamic calculation incorporates more of the reaction pathway - the dynamic calculation also takes mass into account, thus resulting in an oscillating reaction pathway line. No mass is included in the mep calculation, so no oscillation is observed.
Question(4)
Complete the table by adding a column reporting if the trajectory is reactive or unreactive. For each set of initial conditions, provide a screenshot of the trajectory and a small description for what happens along the trajectory.
Answer:
The effect of momentum variation on whether a trajectory is reactive or unreactive (for the initial positions r1 = 0.74 and r2 = 2.0):
| p1 | p2 | Trajectory | Figure No. |
|---|---|---|---|
| -1.25 | -2.5 | Reactive | 2 |
| -1.5 | -2.0 | Unreactive | 3 |
| -1.5 | -2.5 | Reactive | 4 |
| -2.5 | -5.0 | Unreactive | 5 |
| -2.5 | -5.2 | Reactive | 6 |
Figure 2
The surface plot below shows the reactive trajectory corresponding with the set parameters for figure 2. The trajectory line shows that the r(A-B) bond distance decreases as atom Ha approaches molecule Hb-Hc while at the same time the B-C bond distance remains relatively constant. This line continues through the transition state (r(A-B)=r(B-C)) and r(A-B) reaches a minimum and oscillates thus indicating that the Ha-Hb bond has formed. Simultaneously r(B-C) increases, confirming that the Hb-Hc bond has broken and Hc now exists as a separate hydrogen atom.
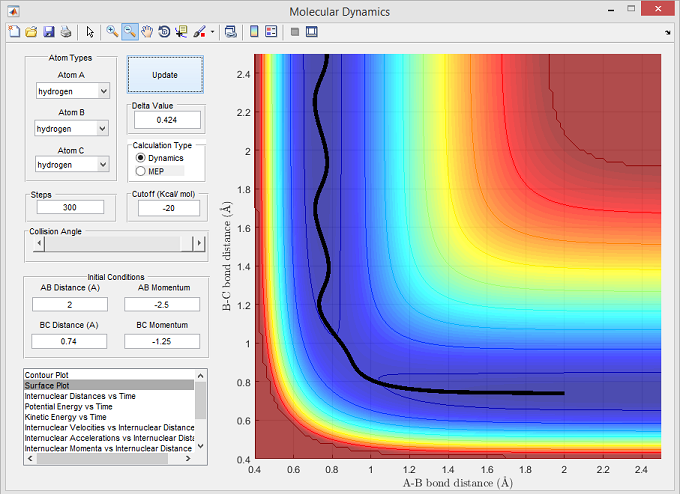
Figure 3
The surface plot below shows the unreactive trajectory corresponding with the set parameters for figure 3. The trajectory line shows that the r(A-B) bond distance decreases as atom Ha approaches molecule Hb-Hc. Since Ha has a momentum insufficient to overcome the activation energy barrier, the trajectory fails to reach the transition state - this is shown by the plot through r(A-B) returning to a larger distance without reaching transition state, and r(B-C) only oscillating due to vibrational fluctuations within the molecule.
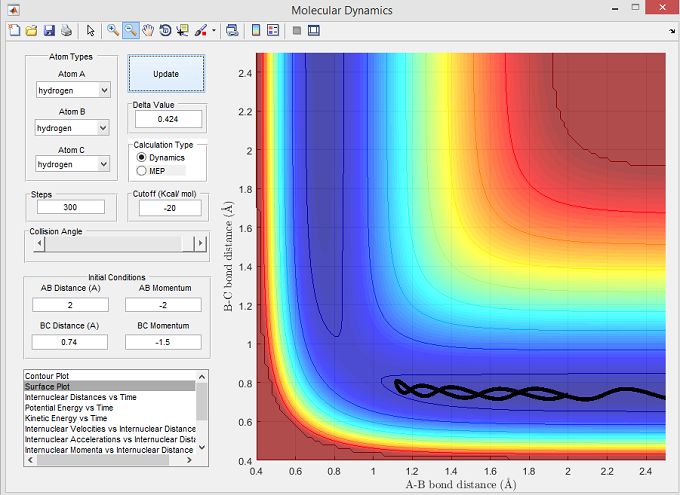
Figure 4
The surface plot below shows the reactive trajectory corresponding with the set parameters for figure 4. The trajectory line illustrates a reaction where Ha had a momentum sufficient to overcome the activation energy barrier required to successfully interact with Hb-Hc, pass through the transition state, and form the molecule Ha-Hb.
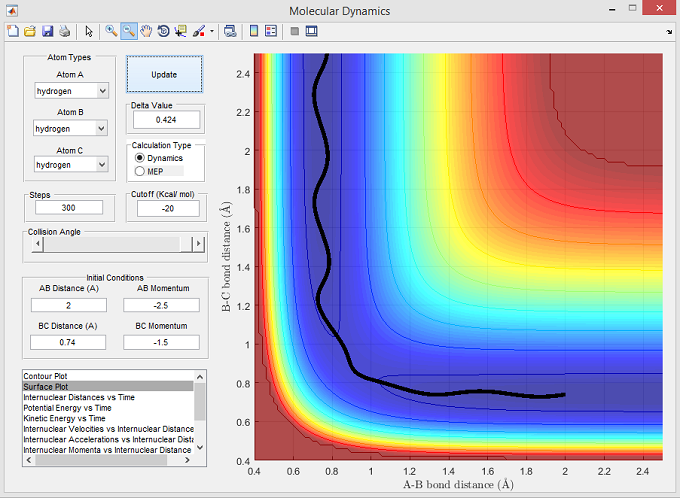
Figure 5
The surface plot below shows the unreactive trajectory corresponding with the set parameters for figure 5. The trajectory line for these set parameters, initially show Ha to approach Hb-Hc with sufficient momentum to overcome the activation energy barrier and reach the transition state. However, instead of forming the product Ha-Hb, the trajectory line reverses and returns back to the reactants, with Hb-Hc exhibiting large vibrational energy fluctuations.
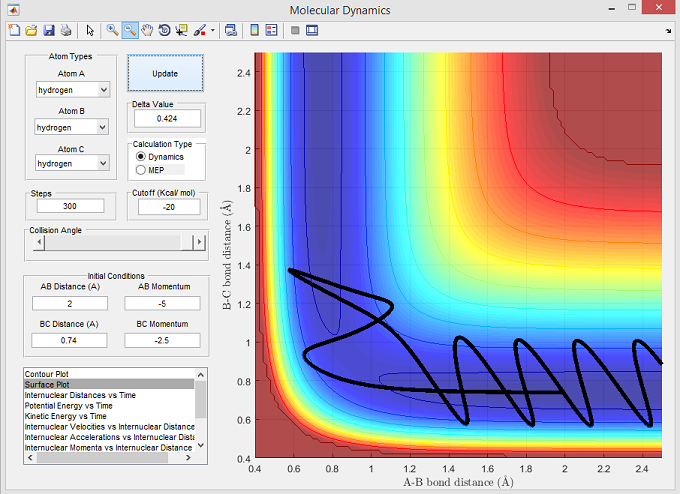
Figure 6
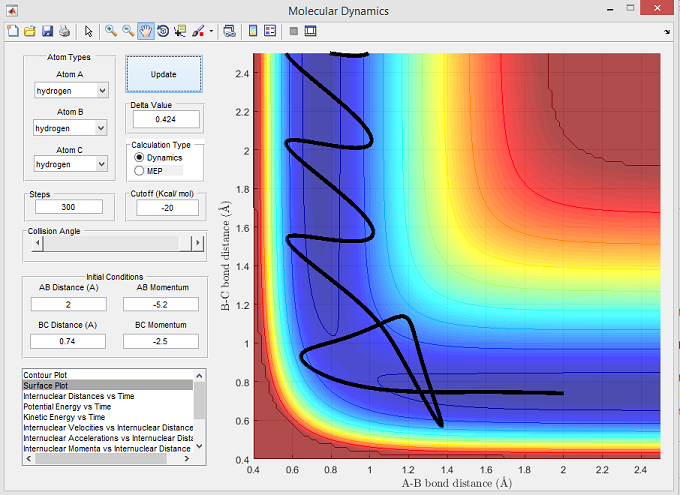
The surface plot below shows the reactive trajectory corresponding with the set parameters for figure 6. The trajectory line illustrates that Ha has sufficient momentum to overcome the activation energy barrier. However after reaching the transition state, the trajectory line goes back towards the reactants which is shown by r(B-C) decreasing and r(A-B) increasing in figure 6. The r(A-B) rose to a maxima before decreasing and oscillating, thus illustrating the formation of Ha-Hb. This reaction trajectory suggests that potentially an alternative reaction pathway was taken, one which does not involve a 'saddle point' on the PE plot corresponding with the transition states that normally produce the desired Ha and Hb-Hc.
Question(5)
State what are the main assumptions of Transition State Theory. Given the results you have obtained, how will Transition State Theory predictions for reaction rate values compare with experimental values?
Answer:
The Transition State Theory's main assumption is that the reactants and activated transition states are at quasi-equilibrium. A quasi-equilibrium utilises thermodynamic molecular driving forces that modify the systems state being very small and slow, allowing for the existence of an internal equilibrium that undergoes only small deviations from this system. Classical Transition State Theory explains that an atom with a momentum satisfying the activation energy barrier requirements, will react upon collision with a given molecule and synthesize products. As this theory however ignores potential quantum mechanical interactions, reaction rates calculated will be slower than what is found in experimental data. Quantum mechanical contributing calculations allow for the tunneling behaviour of particles to be factored into an alternative reaction pathway. When an atom and a molecule lack the sufficient activation energy to overcome this barrier, the atom is able to 'tunnel' through this barrier, due to the particle-wave duality observed in quantum-scale objects.[2]
Exercise 2: F - H - H system
Question(6)
Classify the F + H2 and H + HF reactions according to their energetics (endothermic or exothermic). How does this relate to the bond strength of the chemical species involved?
Answer:
Analysis:
- H-F Bond Energy = 565 KJ/mol[3]
- H-H Bond Energy = 432 KJ/mol[3]
- H-F is a stronger bond than H-H
- ΔE = E(bonds cleaved)-E(bonds formed)
F + H2 --> ΔE = 432 - 565 = -133 KJ/mol THUS EXOTHERMIC
H + H-F --> ΔE = 565 - 432 = 133 KJ/mol THUS ENDOTHERMIC
Question(7)
Locate the approximate position of the transition state.
Answer:
In order to locate the position of the transition state, the radii corresponding to a stationary total system energy (gradient=0) were identified. The positions of the radii have a zero net force acting upon them, so plotting the internuclear distance vs time results in a non-oscillating constant internuclear separation - see the internuclear separations below and the corresponding plot vs time in figure 7:
- r(H-F) = 1.815Å
- r(H-H) = 0.74Å
Question(8)
Report the activation energy for both reactions.
Answer:
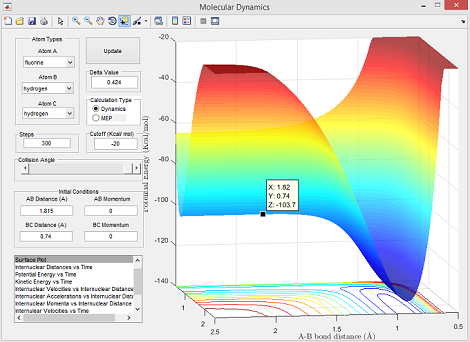
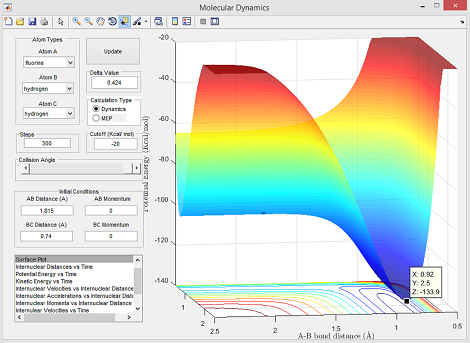
Determining the activation energy for both reactions, required chemical intuition and trial and error in order to identify an adequate reaction trajectory. The activation energy is equal to the energy difference between the reactants and the transition state - activation energy values calculated in absence of mathematical analysis, thus all energy values involved would actually have +/- values.
Reaction 1: F + H2 --> HF + H
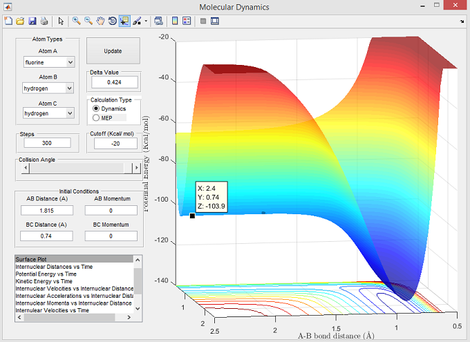
- Ea = -103.7 - (-103.9) = 0.2 kcal/mol
Energy values used for this calculation were obtained from Figure 8 (reactants) and Figure 9 (transition state) below:
Reaction 2: H + HF --> F + H2
- Ea = -103.7 - (-133.9) = 30.2 kcal/mol
Energy values used for this calculation were obtained from Figure 10 (reactants) and Figure 9 (transition state) below:

Question(9)
In light of the fact that energy is conserved, discuss the mechanism of release of the reaction energy. How could this be confirmed experimentally?
Answer:
The Conservation of Energy Law [4] dictates that the total energy of an isolated system must be conserved, as energy cannot be created or destroyed, and is thus just converted from one form to another. For this reaction, the total energy is the sum of the kinetic and potential energies of each reactant involved in the reaction. For the exothermic reaction F + H2, the potential energy of the products is less than the reactants thus meaning that the kinetic energy of the products must be higher - this is illustrated by identifying a successful reaction trajectory and plotting a kinetic energy vs time graph as shown below in figure 11:

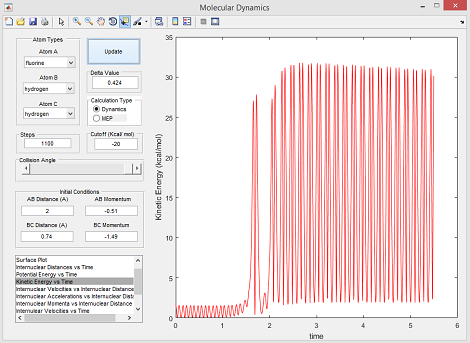
As the kinetic energy increases, products from the reaction can be analysed using infrared spectroscopy - oscillations of the H-F bond exhibit vibrational energy that is illustrated by a peak on an IR spectrum, while the H-H reactant peak will be missing. Calorimetry could also be used for confirmation. As its an exothermic reaction, the heat released can be measured (at constant pressure), the enthalpy change equates to the net energy change, thus the reactions net free energy change can be found.
References
- ↑ 1.0 1.1 P. Jonathan P. K. Doye, David J. Wales, Journal of mathematical physics, 1996, 48, 843 - 846.
- ↑ 2.0 2.1 Chem Libre texts - Wave-particle duality (2015) [online] Available at: https://chem.libretexts.org/Core/Physical_and_Theoretical_Chemistry/Quantum_Mechanics/09._The_Hydrogen_Atom/Atomic_Theory/Electrons_in_Atoms/Wave-Particle_Duality [Assessed 28 Sep 2015].
- ↑ 3.0 3.1 3.2 The Department of Chemistry Illinois (2017). Average Bond Energies [online] Available at: http://butane.chem.uiuc.edu/cyerkes/Chem104ACSpring2009/Genchemref/bondenergies.html [Accessed 9 Feb 2017].
- ↑ 4.0 4.1 Hiebert, E.N. (1981). Historical Roots of the Principle of Conservation of Energy. Madison, Wis.: Ayer Co Pub.
