MRD:ZTSH0520
Molecular Reaction Dynamics
Script Introduction
Exercise 1: H + H2 System
How the transition state be defined mathematically in potential energy diagram?
δV(ri)/δri=0
Great, well defined and explained. The second derivative is also a mathematical part of the definition. Good break up of the sections of this work. Well done. Rs6817 (talk) 15:12, 19 May 2020 (BST)
How can transition state be identified?
The transition state is defined as the maximum on the minimum energy path linking reactants and the products. It is the point of maximum potential energy in the "Energy vs time" graph One way of locating the transition state is to start trajectories near the transition state and see whether they "roll" towards the reactants or products.
Great, well defined. Rs6817 (talk) 15:12, 19 May 2020 (BST)
How can it be distinguished from local minimum of the potential energy surface?
Transition state is when the potential energy reaches its maximum (first derivation of potential energy refer to position equal to 0, second derivation of potential energy refer to position is negative) and the kinetic energy reaches its minimum (first derivation of kinetic energy refer to position equal to 0, second derivation of kinetic energy refer to position is positive).
Perhaps reference to a figure may have helped here. Rs6817 (talk) 15:12, 19 May 2020 (BST)
Locate the best estimation of transition state position under conditions that r1 = r2, and p1 = p2 = 0.0 g.mol-1.pm.fs-1 and explain your reasoning illustrating it with a “Internuclear Distances vs Time” plot for a relevant trajectory.
Background Theory: Since the H + H2 surface is symmetric, the transition state must have r1 = r2. If we start a trajectory on the ridge r1 = r2 there is no gradient in the direction at right angles to the ridge, thus the trajectory will oscillate on the ridge and never fall off. This fact can be used to locate the TS geometry.
The best estimate of the transition state position I found is: rts = 90.8 pm
Correct estimate. Rs6817 (talk) 15:12, 19 May 2020 (BST)
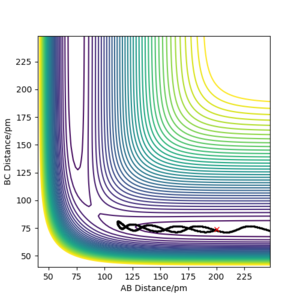
Strat trying value smaller than 230 pm and larger than 74 pm. 230 pm is the starting distance AB, during the reaction AB must decrease so that Atom A can bond with Atom B, 74 pm is the starting distance BC which is also the bond length of molecule BC, during the reaction this bond will break, therefore BC of the transition state must be longer than the bond length.
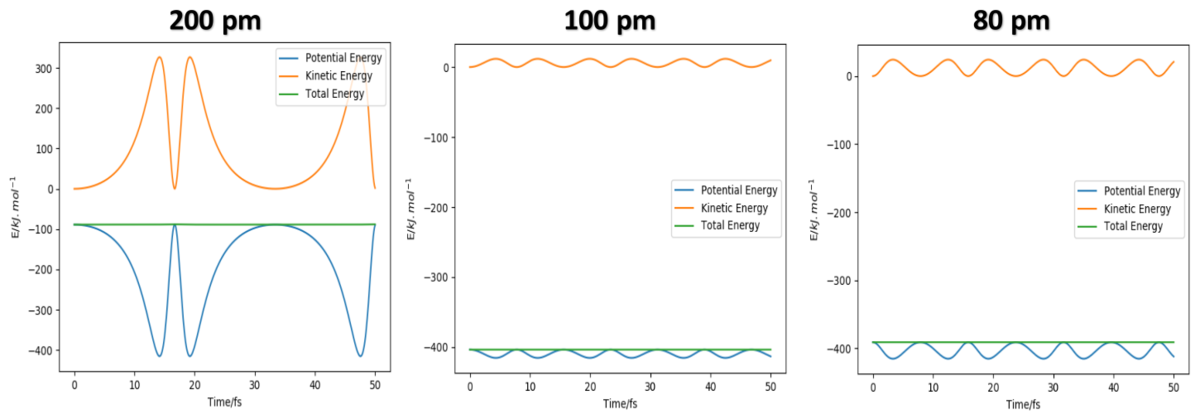
By decrease 10 pm each time, the second minimum occurs at 190 pm, the third minimum point occurs at 130 pm and the fourth minimum point occurs at 90 pm. Along that process, the vibration amplitude keep decreasing and it become very obvious at 90 pm, the amplitude is nearly 0, if keep decreasing the value the amplitude would raise again.(see diagram below)

All these plots have oscillatory behaviour which is due to the vibrational energy of the molecule, and this behaviour is nearly disappear when AB = BC = 90.8 pm so that I choose this value as rts. Because there is no actual bond exsist at transition state which also means that there should be no vibrational energy at that state. The diagram below is showing the Internuclear Distance vs Time Graph and the Energy vs Time Graph at 90.8 pm.

The energy diagram further proves that 90.8 pm is the best estimation, as Kinetic energy is closest to 0 all the time compare to all other values. (More energy diagram are list below for comparation)
Great, well defined and good use of figures to illustrate your point. You could have looked at the Hessian and the Forces along AB and BC part of the programme to get an even closer estimate but otherwise well done. Rs6817 (talk) 15:12, 19 May 2020 (BST)
How the mep and the trajectory differ.
All graph of mep (plot by mep calculation type) are smooth line while all graph of trajectory (plot by dynamic calculation type) have osillatory behaviour.(As shown below the left side are graph of mep and the right are graph of trajectory)
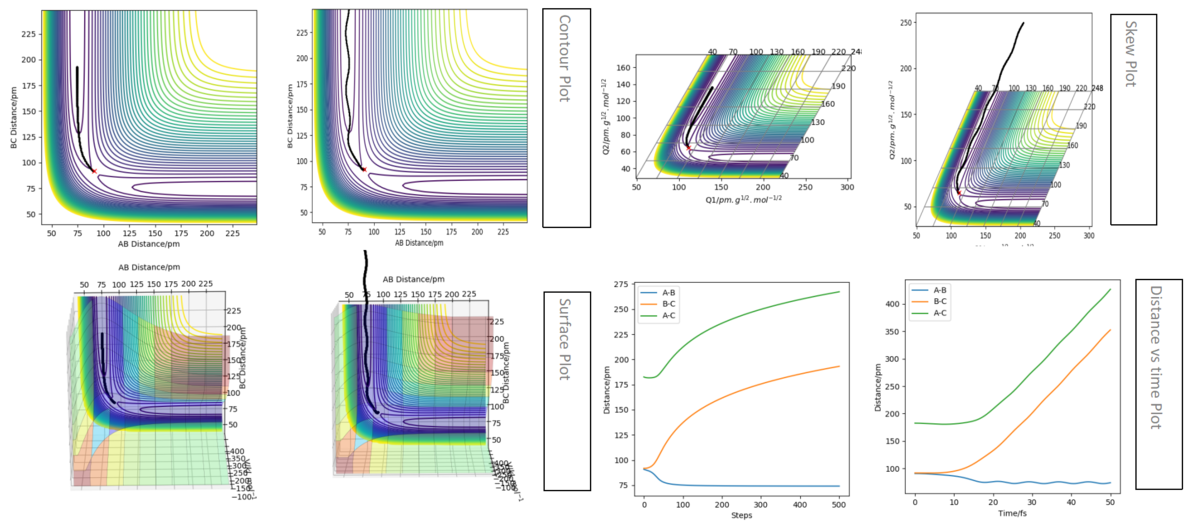
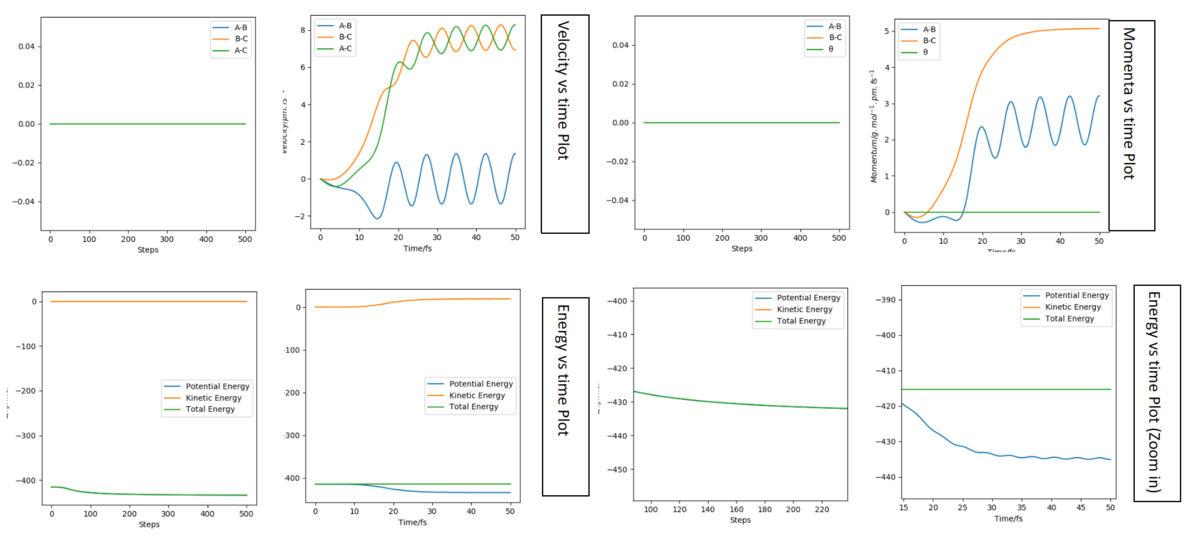
The graphs listed below are for comparation before and after chnage the r1, r2 condition. The top four graph is when AB(r2) = 90.8 pm, BC(r1) = 91.8 pm and the bottom four graph is when AB(r2) = 91.8 pm, BC(r1) = 90.8 pm. Same as before the left hand side are graph of mep calculation and those at right are graphs of dynamic calculation. For the same graphs, they have same shape before and after changing the condition, the only different is the change of color of the lines. All blue lines become orange after changing the condition and the orange lines become blue. This means that the reaction is the same as before but now B is bonded with C instead of A. AB is the molecule form before change the condition and after that BC is formed.
Yes, so the trajectory 'rolls down' either side of the TS. You could have labelled the figures with MEP / dynamics trajectory, you havnt really explained the fundamental differences between them here. Rs6817 (talk) 15:12, 19 May 2020 (BST)
Set up a calculation where the initial positions correspond to the final positions of the trajectory, the same final momenta values but with their signs reversed. What do you observe?
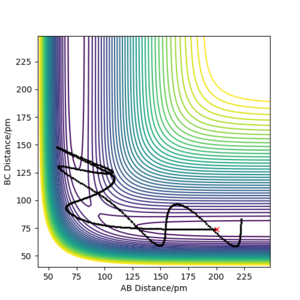
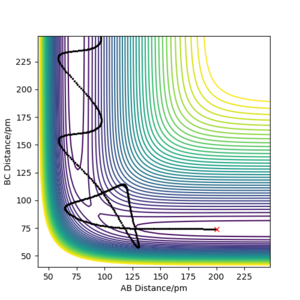
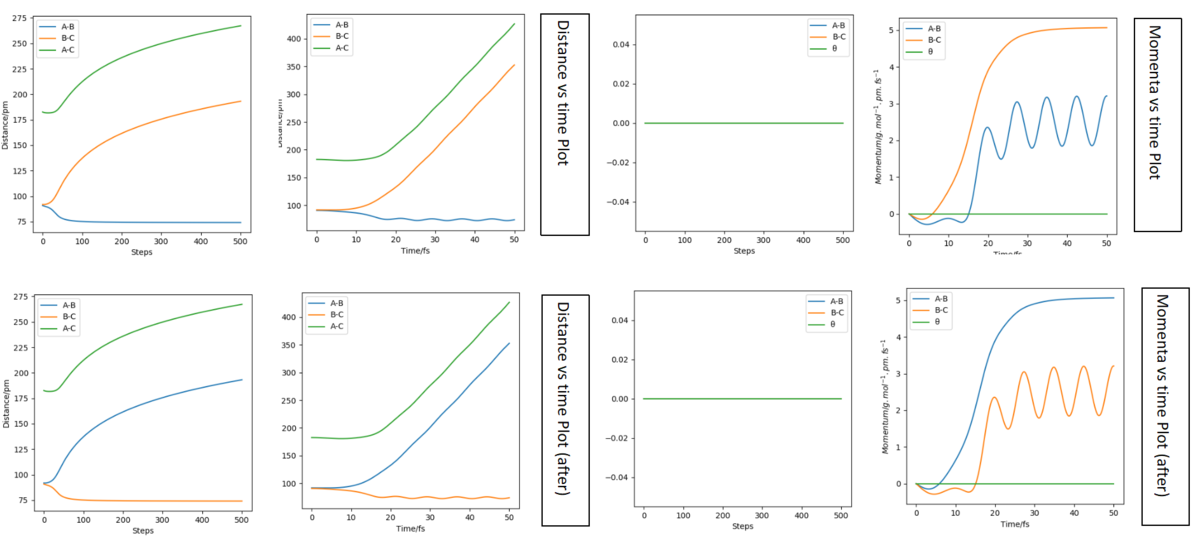
The time I took for calculation is 40 fs. At that moment, AB(r2) = 277 pm, BC(r1) = 72.6 pm and PAB(p2) = 5.04 g.mol-1.pm.fs-1, PBC(r1) = 2.21 g.mol-1.pm.fs-1. Follow the script, use these as the initial condition with the revesed sign of momenta, the graphs are plotted and listed below.
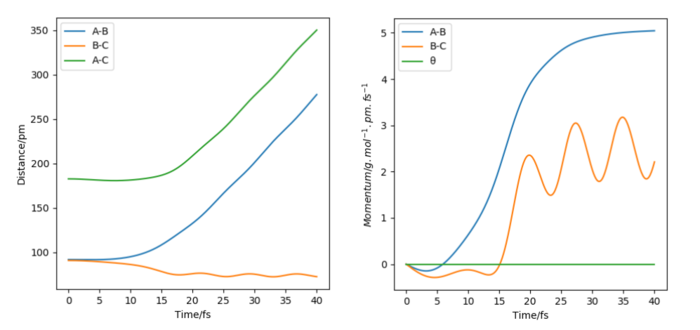

For the distance diagrams on the left, they are bilateral symmetry in shape (if we fold them follow a vertical line they can well overlap). For the momenta diagram, they are central symmetry (this time for overlap we need to fold it follow a vertical line and then fold again follow a horizontal line). For two cases's animations, it is easy to see that they are just the reverse of each other in time scale (play in reverse), the original one condition is BC react and move away from A while the final case is that BC move toward A and AB bond together.
Reactive and unreactive trajectories
Great, table well described. Rs6817 (talk) 15:12, 19 May 2020 (BST)
Conclusion: The hypothesis is not accurate. What hypothesis is this? Just ensure this is clear. Rs6817 (talk) 15:12, 19 May 2020 (BST)
The first three cases prove that when p1 is between -3.1 g.mol-1.pm.fs-1 and -1.6 g.mol-1.pm.fs-1, if p2 is equal to -5.1 g.mol-1.pm.fs-1, it is reactive. And when p2 is smaller e.g. -4.1 g.mol-1.pm.fs-1, it will become unreactive.
However, once we change the momenta of p1 out of that range(In the last two cases, p1 is -5.1 g.mol-1.pm.fs-1 which is not in the range that between -3.1 and -1.6), a relative high momenta will lead to a re-crosses reaction where the reactants passed the trainsition state and formed products, but reform the reactants again. This is not reactive even though the momenta is -10.1 g.mol-1.pm.fs-1(a lot higher than -5.1). For the last case, both p1 and p2 are high, the reaction is reactive again evne though it has reformed the reactants, products is formed at the end.
This isnt a conclusion but rather a resdescirption of the table. What does the data tell you about the importance of incoming energy modes? Rs6817 (talk) 15:12, 19 May 2020 (BST)
How will Transition State Theory predictions for reaction rate values compare with experimental values?
The theory calculate the rate without counting those products which re-cross in the transition state region, the re-cross means that these products reform reactants therefore the rate of forming these products cannot take account to the final rate as they did not form product at the end(rate = 0). Overall, the calculation will overestimate the actual rate of reaction.
I am unsure on your answer here, the calculation will underestimate as compared to TST. A reference may have helped you provide more detail here. Wahat about quantum tunnelling and quasi-equilibria? Rs6817 (talk) 15:12, 19 May 2020 (BST)
Exercise 2: F-H-H System
By inspecting the potential energy surfaces, classify the F + H2 and H + HF reactions according to their energetics (endothermic or exothermic). How does this relate to the bond strength of the chemical species involved?
F + H2 is exothermic reaction. H + HF is endothermic. For the F + H2 reaction, FH is formed which means that AB distance should decrease so follow that direction(reactant on the right and product on the left) the energy decrease during the reaction, so it is an exothermic reaction. For the H + HF reaction(the diagram on the right side), HF's bond broken which means that BC should increase, so we should look follow the direction where BC increase, the reactants(the left hand side) is lower than the products(the right hand side) which means that the reaction is endothermic. Relate to their bond strength,if the bond broken is stronger(more strength) than the bond formed, the reaction will be exothermic, vise versa.
Ok good. Rs6817 (talk) 15:12, 19 May 2020 (BST)
Locate the approximate position of the transition state
Transition state position of F + H2 system: AB: 181.1 (181.104) pm, BC: 74.5 (74.488) pm. Transition state position of H + HF system: AB: 74.5 (74.488) pm, BC: 181.1 (181.104) pm.

Great, well defined and explained perhaps you could have explained more how you determined this? Rs6817 (talk) 15:12, 19 May 2020 (BST)
Activation energy for both reactions
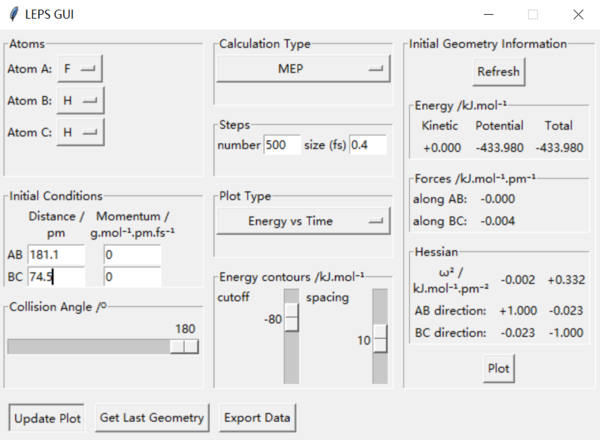
The way to estimate this is finding the difference between the maximum energy in the reaction(which should be the energy of the saddle point) and the energy of the reactants. The first step is find the exact value of saddle point and read the energy at that point(it should be the point that have 0 force in both direction) from the setting table(figure 1). Secondly, by increasing the distance between the reactants(the atom and molecule distance) and decrease the intermolecular distance, we can get a trajectory and then the lowest energy of the reactants can be read from the energy vs time diagram. Overall, the highest energy is -433.981 kJ.mol-1. And for FHH reaaction all diagram is in figure 2, the lowest/ reactant energy is -434.3 kJ.mol-1. For HHF reaction, diagrams are in figure 3, and the lowest/ reactant energy is -556.1 kJ.mol-1. Finnaly, the estimated energy of FHH is 0.3 kJ.mol-1, and HHF's is 128.8 kJ.mol-1(dynamic). This works the same by mep calculation(decrease the inter-molecular distance of reactant moleclue and increase the intra-molecular distance between atom and molecule, then read the lowest energy from energy vs time graph. The step size had been changed to 0.4 for mep calculation), datas are shown on figure 4(saddle point), 5(FHH) & 6(HHF). However, the energy calculated is slightly different, this time saddle point energy is -433.980 kJ.mol-1, FHH reactant's energy is -434.0 kJ.mol-1 and HHF's is -561.2 kJ.mol-1. This give estimation activation energy of 0.02 kJ.mol-1(FHH) and 127.2 kJ.mol-1(HHF)(mep).
Great, well done, although you may have been able to get slightly more accurate Rs6817 (talk) 15:12, 19 May 2020 (BST)




Reaction dynamics
Look at the “Animation” and “Momenta vs Time” in a reactive trajectory for the F + H2.Discuss the mechanism of release of the reaction energy. Explain how this could be confirmed experimentally.
The initial condition of the reactive trajectory has slightly different distance between FHH compared with the saddle point and both momenta are setted as 0. From this setting we can state that there is only potential/ vibrational energy and 0 kinetic energy. From animation, H2 is vibrating and move toward F slowly, when they are close enough F attract the H atom next to it and bond together. The new HF molecule starts vibration and the H atom left moves away from the new HF molecule. The vibration energy of H2 allow it move toward F atom(vibrational/ potential energy -> kinetic energy), when the bond break and new molecule form the H atom formed will gain kinetic energy to move away and some vibrational energy is contained in the new HF molecule. As energy is conserved, there is no initial kinetic energy in the system but after the reaction there are some kinetic energy this means that some vibrational energy is transferred to kinetic energy during the reaction. This energy change can also obsevered from the momenta vs time diagram (see below), there is a suddenly increase in the AB momenta at 90 fs, and its amplitude is much more than the origin BC momenta (there is an increase of kinetic energy after the reaction as momenta increase and this energy can only come from the reactants' vibrational energy as there is no external energy of force apply to the system). The vibrational energy can be confirmed by IR spectrum or Raman Spectrum.
Great, good description. I think you could have focused on your technique a bit more here. What about bomb calorimetry? Rs6817 (talk) 15:12, 19 May 2020 (BST)
Observation when changing the initial momenta
The known initial condition are only distance of HH(74 pm), pFH(-1.0 g.mol-1.pm.fs-1) and pHH is between -6.1~ 6.1 g.mol-1.pm.fs-1. So FH distance is choosen from a reactive trajectory's condition where HH is 74 pm and both momenta is 0(see below).
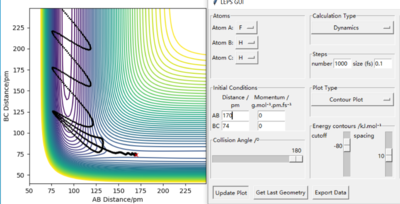
After that, varies value of pHH within the stated range was used to plot contour plot and results are shown below. As conclusion before, higher momenta will not lead to reactive trajectory. They do not have any trend (some momenta give a reactive trajectory and some are not, it is random) and the only general point is that nearly all of them have more frequency curves compare with the plot when both momenta are 0. (The trajectories bounce back and forward more frequently on the diagram is shown as all the adjacent turning points are closer/ more crowded together).The width (vibration in vetical direction) of the vibration on the reactants side is varies with the absolute value of the pHH, wider means that the amplitude of vibration is larger, kinetic energy is also larger. Comparations is below the results.
G There is too much information here and a refernece to Polanyis rules may have helped. Rs6817 (talk) 15:12, 19 May 2020 (BST)


After chang the condition to pFH = -1.6 g.mol-1.pm.fs-1 and pHH = 0.2 g.mol-1.pm.fs-1, the trajectory is reactive.

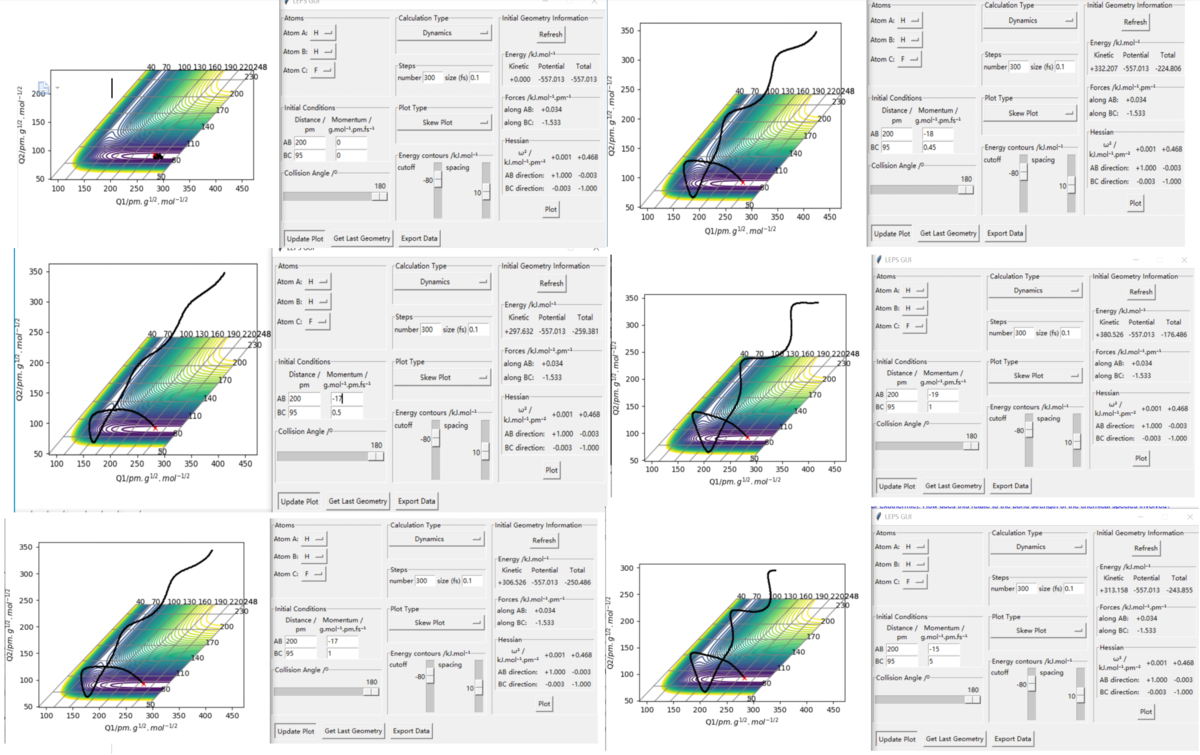
HHF
Initial position was set as HH = 200 pm and HF = 95 pm, which shown on the top left diagram below, all the rest are reactive trajectory I found. During the process, if we want to keep the trajectory being reactive while AB(HH) momenta is less negative, the BC(HF) momenta should be increased to keep the trajector reactive. Also, a large change made on HH momenta will only required a smaller change on HF's momenta to make the trajectory reactive. This means that translation is more effective to the efficiency of the reaction. Early transition state has more similar structure to the reactants which then means that vibration mode will have slightly stronger effect to the reaction.
