MRD:Yiming Xu
Exercise 1: H + H2 system

Dynamics from the Transition State Region
Question: What value does the total gradient of the potential energy surface have at a minimum and at a transition structure? Briefly explain how minima and transition structures can be distinguished using the curvature of the potential energy surface.
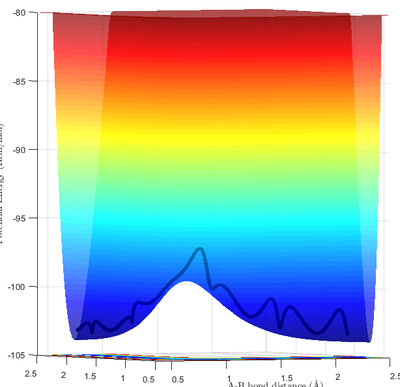
Minima and transition structures can be identified visually from the potential energy surface. As can be seen in Fig 1a, minima appear as a "valley" of low potential energy between two "hills" of higher potential energy. This means that minima show an local upward curvature along parts of the potential energy surface with the lowest energy. The transition state is positioned along the minimum energy path (mep). However, as can be seen from Fig 1b, it appears as a "bump" along the mep "valley". This results in it being a saddle point - with it being the local minimum along one axis and the local maximum along another axis (mep).
Mathematically, both minima and transition structures are at stationary points of the potential energy surface. At stationary points, the following relationship must hold:
where ∇ is the gradient and U is the potential energy. In order to determine whether the point found was a local minimum, maximum or a saddle (transition state), the local curvature need to be calculated using the second partial derivative test. For the potential energy surface of two variables U(rA, rB), the Hessian matrix can be defined as:
The determinant of H(rA, rB), D(rA, rB), determines the nature of the stationary point (a, b):
- if D(a, b) > 0 and UrArA(a, b) > 0, then the point (a, b) is a local minimum;
- if D(a, b) > 0 and UrArA(a, b) < 0, then the point (a, b) is a local maximum;
- if D(a, b) < 0 then the point (a, b) is a saddle point; and
- if D(a, b) = 0 then another test need to be performed.
From the second partial derivative test, the minima and transition structures can be identified.
Excellent! Good job on using math, and defining your symbols, showing understanding of it! Je714 (talk) 17:10, 31 May 2017 (BST)
Trajectories from rA = rB: Locating the Transition State
Question: Report your best estimate of the transition state position (rts) and explain your reasoning illustrating it with a “Internuclear Distances vs Time” screenshot for a relevant trajectory.
Due to the symmetry of the system, with all three atoms being identical, we expect that rts will be located at a point such that rA and rB are identical. In other words, HB should be located between HA and HC. From the previous section, as the transition state is a stationary point, if the reaction coordinate was located on the transition state exactly with no momentum, it would be stationary and would not proceed any further. In other words, we can find a suitable rts at a particular rA = rB and pA = pB = 0
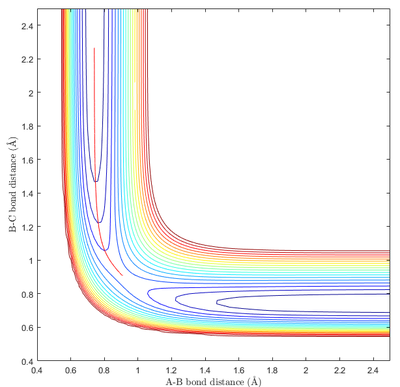
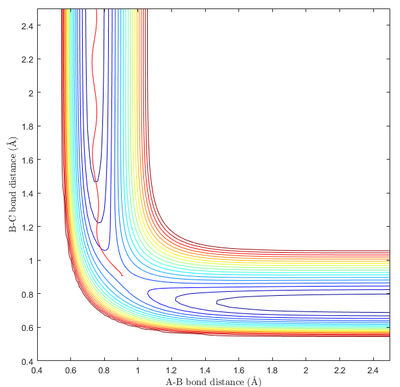
Fig 2a. shows a graph of the inter nuclear distances against time. As expected from being located on the stationary point, the distances stay approximately constant over time, with rA = rB (rA is not shown as it was completely overlapped by rB). The small amount of oscillation was due to symmetric stretching of the molecule, and is along a direction perpendicular to the mep. The nature of the stationary point can be more aptly visualised by Fig 2b. as the trajectory remain essentially unchanged after 1000 time step.
While rts used to generate the graphical plot was 0.9085406012, the precision obtained was much higher than what was meaningful due to the limited accuracy of the simulation. Comparing to a literature value of 0.93 , the best obtainable estimate of rts from this simulation would be 0.9 , an error of 3.3%.[1]
Trajectories from rA = rts+δ, rB = rts
Once the transition state has been located, the reaction can be followed from transition state to the products or towards the reagents (due to time symmetry) in order to provide more information on the nature of reaction if only a minimum amount of energy was available.
Question: Comment on how the mep and the trajectory you just calculated differ.
Both the mep and the molecular dynamics trajectory start at the exact same location at the same energy. However, they follow a different path "down" the transition state. The molecular dynamics trajectory is the physical trajectory taken by the molecule during the reaction. Compared to the mep, it shows oscillatory motion due to bond vibration. In addition, as the loss of potential energy was converted to kinetic energy and vibrational energy according to the equipartition theorem, with a higher translational kinetic energy, the molecule had moved further along the reaction (away from the transition state) during the same time (10000 steps).
On the other hand, the mep is not really a trajectory taken by the particle. It is an unphysical trajectory that characterises the path of steepest descent for the given potential energy surface. In this simulation, as it was calculated by setting the velocity to be 0 at every time step, it travelled to a lesser extent than that of the molecular dynamics trajectory.
In an actual reaction, the reaction trajectory will follow one provided by molecular dynamics, and may or may not pass through the transition state.
Very good explanation! Je714 (talk) 17:10, 31 May 2017 (BST)
Reactive and Unreactive Trajectories
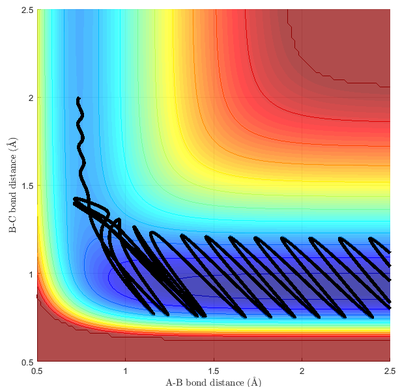
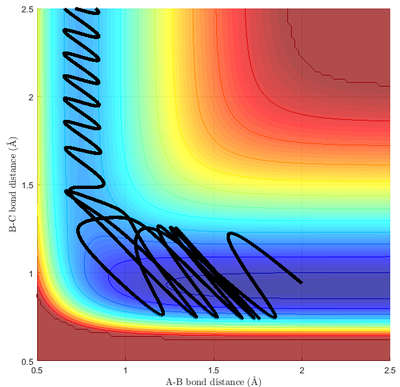
Whether a trajectory results in an reaction can be identified by the bond between the atoms before and before interaction. As bonds are not identified explicitly, they can be inferred from the internuclear distances - a bond would have a relatively constant distance over time, with oscillatory motions due to vibration. With initial positions of rA = 0.74 and rB= 2.0, which means that HA is bonded with HB, trajectories with the following momenta were investigated.
Transition State Theory
Question: State what are the main assumptions of Transition State Theory. Given the results you have obtained, how will Transition State Theory predictions for reaction rate values compare with experimental values?
The Transition State Theory (TST) is an alternative to the Collision Theory, which explains the rate of chemical reactions and provide theoretical basis for the Arrhenius equation, . It assumes a special type of equilibrium exists between the reactants and the activated complex before the product is formed, and provides the following rate equation (the Eyring equation):[2]
The Eyring equation was developed with two assumptions:[3]
- The reactants and product space in the PES can be clearly differentiated/divided; and
- Trajectories going from reactant space to product space will not go back.
In addition, it implicitly assumes that:
- The reactants are equilibrated in an ensemble; and Does this make sense here? We're just looking at a triatomic collision in isolation -- no ensemble of particles considered... Je714 (talk) 17:10, 31 May 2017 (BST)
- The overall reaction is electronically adiabatic.
From the results of the previous part, it can be seen that assumption 2 is not valid. Even if the transition state had been achieved, the trajectory may still undergoing recrossing to return to the reagent space. This recrossing may even happen if the product was formed momentarily. In addition, multiple recrossing may occur depending on the momenta and angle of the trajectory to give the desired product after an even number of crossings. This effect result in TST overestimating the reaction rate constant as compared to experimental values.
In addition, quantum mechanical effects may also affect the rate of reaction by allowing reactants to tunnel through the activation barrier without having sufficient energy. While this would indicate an underestimation of the rate by TST, the previous effect would be much more significant, leading TST predicting higher reaction rate values when compared with experimental data.
Good! Je714 (talk) 17:10, 31 May 2017 (BST)
Exercise 2: F - H - H system


PES inspection
Question: Classify the F + H2 and H + HF reactions according to their energetics (endothermic or exothermic). How does this relate to the bond strength of the chemical species involved?
There are two different reaction under investigation. The first reaction (Reaction 1.) is : F + H2 ⟶ HF + H. The second reaction (Reaction 2.) considered is the reverse reaction of the first, namely H + HF ⟶ H2 + F. As they are the reverse reaction of each other, and due to the fact that enthalpy is a state function, if one of them (e.g. Reaction 1.) is exothermic, the reverse reaction (i.e. Reaction 2.) must be endothermic.
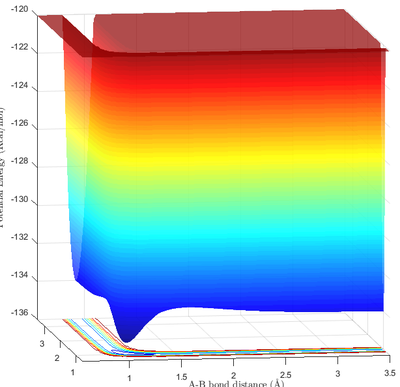
The reaction energetics can be determined simply by examining the potential energy surface of the reaction, and identifying the correct viewing perspective.
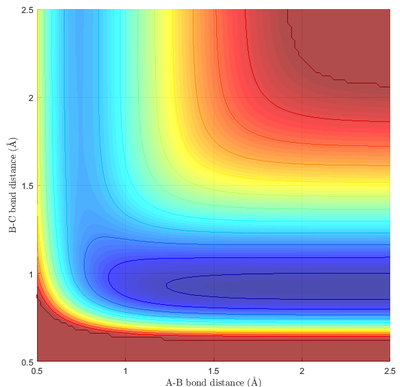
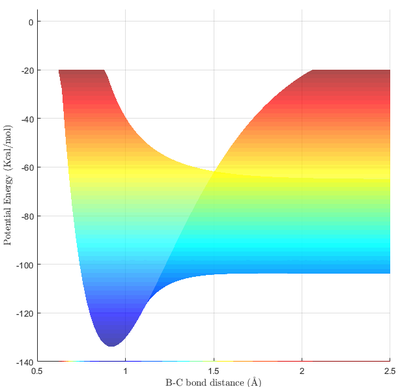
From Fig 9a. and Fig 9b., it can be seen that HF is much more stable than that of H2. Taking the difference between the minima at a BC bond distance of 0.92, and the minima of the PES at the extreme right of Fig 9b, it can be calculated that the energy difference between the two states is (-103.9 - -133.9) = 30.0 Kcal/mol = 126 KJ/mol. Thus, ΔE(Reaction 1) = -126 KJ/mol, and ΔE(Reaction 2) = 126 KJ/mol.
The enthalpy of reaction can also be determined by looking at the bond energy (BE) of the bonds broken and bonds formed. In particular:
For reaction 1 (F + H2 ⟶ HF + H), the bond broken is an H-H bond and the bond formed is an H-F bond. The exothermic energetics of the reaction implies that the H-F bond is stronger than the H-H bond. A stronger bond has higher bond energy. When the bond formed is the stronger bond, it results in a negative ΔE according to the formula above, consistent with our observation. The numerical value can also be verified using bond energies. With an H-H bond energy of 436.0 KJ/mol and an H-F bond energy of 568.5 KJ/mol, [4] ΔE(Reaction 1) = 436.0 - 568.5 = -132.5 KJ/mol, close to the value obtained from the simulation.
In addition to the two reactions above, another reaction of the F-H-H may occur, which is the collision of an H atom into the F atom of a HF molecule, resulting in an exchange of H atom:
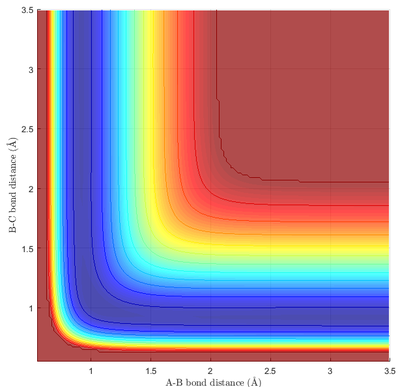
As expected, the PES is symmetric about the y=x diagonal line, implying that H + FH ⟶ HF + H is energetically neutral. In an actual reaction, energy may be transferred in the form of heat or vibration. However, unlike the previous scenario, the most stable molecule is HFH, a linear triatomic molecule. As no bond is broken in this case, the ΔE is negative and the reaction is exothermic.
Question: Locate the approximate position of the transition state. In addition, the transition state can can identified by from Fig 9b. directly by locating the saddle point. By looking at the correct region of the PES at the correct scale, the approximate location of the transition state can be determined. Further refinement of the approximate location was then carried out in a similar manner as in Exercise 1.
Due to the highly endothermic nature of the depicted reaction (Reaction 2), the energy of the transition state was very close to the energy of the product. In addition, the coordinate of the transition state is also located close to the product, as informed by Hammond's postulate. This can be seen easily on Fig 9b., where the transition state was essentially indistinguishable from the product.
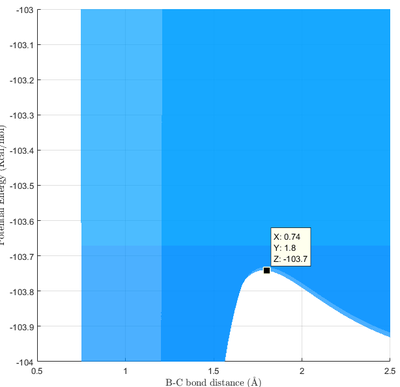
From Fig 11a., the approximate location for the transition was identified as rts = 1.8. By calculating the internuclear distance of rts around the approximate location, the refined internuclear distance was found to be rts = 1.81. Unlike that of r a H3 system, rA ≠ rB due to the asymmetry of the system.
Question: Report the activation energy for both reactions.
From the PES, the energy for the various states can be found. The energy of the transition state can be found as described previously, while the energy of the minima can be extracted in a similar manner: the approximate minima was found by visual inspection of the PES. The approximate location and energy was then refined by conducting a dynamics simulation at the approximate location, and looking at the change in potential energy over time (Fig 12.).
| rHH / | rFH / | Energy /Kcal/mol | |
|---|---|---|---|
| HF | 6 | 0.92 | -134.03 |
| [H-H-F]‡ | 0.74 | 1.81 | -103.75 |
| H2 | 0.74 | 6 | -104.02 |
The activation energy of a reaction can be found by taking the difference in energy between the transition state and the energy of the reagent:
Thus, the activation energy of reaction 1 (F + H2 ⟶ HF + H) is Eea = (-103.75) - (-104.02) = 0.27 Kcal/mol = 1.1 KJ/mol.
Similarly, for reaction 2 (H + HF ⟶ H2 + F), Eea = (-103.75) - (-134.03) = 30.28 Kcal/mol = 136.7 KJ/mol
Awesome discussion. Clear and to the point, I like it! Je714 (talk) 17:13, 31 May 2017 (BST)
Reaction Dynamics
Question: In light of the fact that energy is conserved, discuss the mechanism of release of the reaction energy. How could this be confirmed experimentally?
As energy of conserved, for an exothermic reaction, the reaction energy released was converted from chemical potential energy to kinetic energy. This was seen from Fig 13b., as the peak kinetic energy was equals to the change of potential energy of the reaction, around 30Kcal/mol. The kinetic energy could be either in the form of translational motion, or vibrational motion, or a combination of both. Translational kinetic energy can be measured through measuring the pressure change of the reaction if carried out in gaseous phase, or by measuring the change in temperature through calorimetry.
Alternatively, the vibrational energy can be probed through spectroscopy. For the HF product, as it is IR-active, IR spectroscopy may be used to characterize its vibrational motion, with ṽo(1→0) = 3962 cm-1.[5] As the H2 product is non-polar and is IR inactive, Raman spectroscopy may be used, with ṽo(1→0) = 4156 cm-1.[6]
Nice! Je714 (talk) 17:13, 31 May 2017 (BST)
Question: Discuss how the distribution of energy between different modes (translation and vibration) affect the efficiency of the reaction, and how this is influenced by the position of the transition state.
Polanyi's Rule relates the efficiency of the reaction to the position of the transition state and the mode of excitation of the exchange reaction of simple molecules.[7] Specifically, for a reaction with an early transition state, translational kinetic energy is more efficient than vibrational kinetic energy in promoting the reaction; for a reaction with a late transition state, translational kinetic energy is less efficient than vibrational kinetic energy in promoting the reaction.[8] This can be verified with pairs of simulations with constant total kinetic energy, but with different distributions of kinetic energy.
This can be inferred directly from the simulation. For reaction 1 with early TS (Fig 13a.), a reactive trajectory generally have vibration momentum to be less than the collision momentum, with recrossing back to reagent occurring with high vibration momentum. However, for reaction 2 with a late TS, the collision momentum needed to be higher than the vibration momentum (Fig 14) in order for the reaction to proceed. This is in line with Polanyi's rule.
Again, really good! Je714 (talk) 17:13, 31 May 2017 (BST)
References
- ↑ S. Grabowski and R. Hoffmann, ChemPhysChem, 2012, 13, 2286-2288.
- ↑ IUPAC. Compendium of Chemical Terminology, 2nd ed. (the "Gold Book"). Compiled by A. D. McNaught and A. Wilkinson. Blackwell Scientific Publications, Oxford (1997). XML on-line corrected version: http://goldbook.iupac.org (2006-) created by M. Nic, J. Jirat, B. Kosata; updates compiled by A. Jenkins. ISBN 0-9678550-9-8. https://doi.org/10.1351/goldbook
- ↑ D. Truhlar, B. Garrett and S. Klippenstein, The Journal of Physical Chemistry, 1996, 100, 12771-12800.
- ↑ Haynes, W., Bruno, T. and Lide, D. (2015). CRC Handbook of Chemistry and Physics. 97th ed. [Boca Raton, Florida]: CRC Press.
- ↑ G. Kuipers, D. Smith and A. Nielsen, The Journal of Chemical Physics, 1956, 25, 275-279.
- ↑ D. Shelton, The Journal of Chemical Physics, 1990, 93, 1491-1495.
- ↑ J. Polanyi and W. Wong, The Journal of Chemical Physics, 1969, 51, 1439-1450.
- ↑ J. Liu, K. Song, W. Hase and S. Anderson, Journal of the American Chemical Society, 2004, 126, 8602-8603.


