MRD:YanZhangPhyComp
Molecular Reaction Dynamics: Applications to Triatomic systems
Introduction
In this lab, the reaction inbetween a triatomic system is investigated where an single atom A collides with a diatomic molecule BC, forming a new diatomic AB and an atom of C, where it is assumed that the motion of the atoms obey classical mechanics.
The types of atoms, the internuclear distances between the atoms and their internuclear momentum are varied and its reactivity(whether the reaction occurs or not), the molecular dynamic trajectories and minimum energy paths are monitored on the potential energy surface using MATLAB.
Also,as for a reaction to occur, the particles having sufficient energy to overcome the activation energy barrier is not the only pre-requisite, the vibrational energy also has to be in the right time and in the right mode. Therefore, in the reaction, the ratio of the internuclear momenta is varied to investigate the correct combinations for the reaction to proceed.
Reaction 1: H atom + H2 molecule system
In this reaction, one H atom(HA) collides with one H2 molecule(HB-HC) to form a different H2 molecule(HA-HB) and detaching HC.
Dynamics of the transition state and the minimum
In this triatomic system, the reaction proceed via transition state to the products, in which the transition state links reactants and products together and is defined by the maximum on the reaction path.
Both gradients are equal to 0 at minimum and at a transition structure. Therefore the total value of gradient is 0.
However, for the minimum, it will always be at the lowest point on the potential energy surface, therefore, its second derivative will always be positive. For transition state, as the reaction proceeds via the minimum energy path, the whole trajectory will be minimum in the potential energy surface, so the transition state will have a positive value of second derivative in this aspect; but within the trajectory of the reaction, the reaction has maximum energy and will have a negative value of the second derivative within the path. Therefore, the minimum and the transition state could be distinguished by their second derivatives.
Determination of position of Transition State
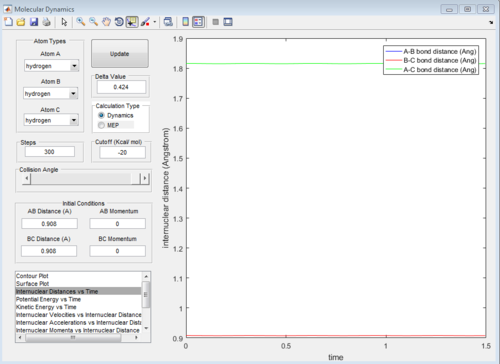
As the three atoms in the system are all identical, the potential energy surface will be symmetrical as well as the reaction path. Therefore, the transition state will occur at the point where two internuclear distances are equal(rAB=rBC).
Also, given 0 momentum for all three atoms, the system will remain on transition state so therefore, the internuclear distances will be constant instead of fluctuating values throughout time.
Therefore, from the internuclear distance vs time plot,the best estimate of the transition state position is determined to be around 0.908 Å for both internuclear distances
MEP and Dynamic paths
MEP represents minimum energy path, in which the path simply follows the lowest energy reaction path in the potential energy surface. It does not account for any vibrational energy and will be follow the valley in the surface plot. Also, the atoms will have 0 momentum throughout the MEP because the velocity of the atoms is always reset to 0 at each time step.
The initial conditions are set as below:
rAB=rts=0.908 Å
rBC=rts+0.01=0.918 Å
pAB=pBC=0
The reaction trajectories are run with the initial conditions in both Dynamic mode and MEP mode and the surface plots are shown below :
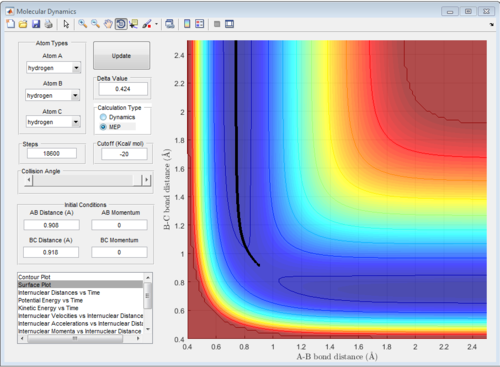
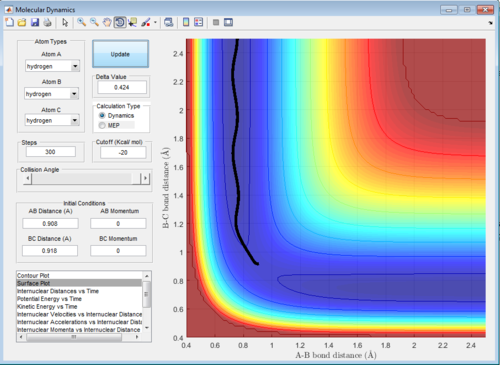
As the MEP does not account for neither vibrations inbetween the molecules, the above graph gives a smooth line, while the dynamic mode accounts for the vibrations of the molecules and appears as a oscillating curve in the potential energy surface.
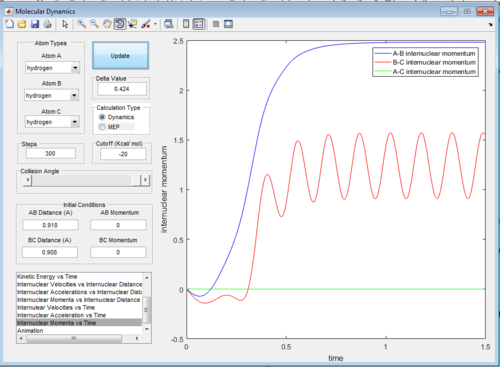
The intermolecular distance vs time and intermolecular momenta vs time graphs for both modes are shown below:
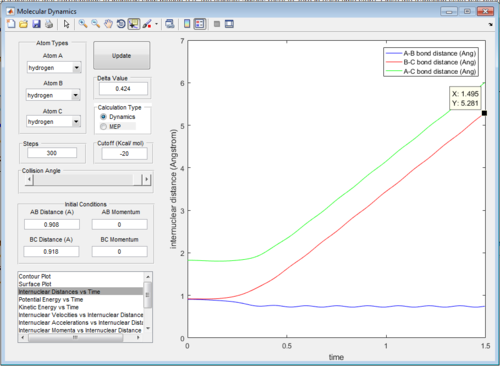
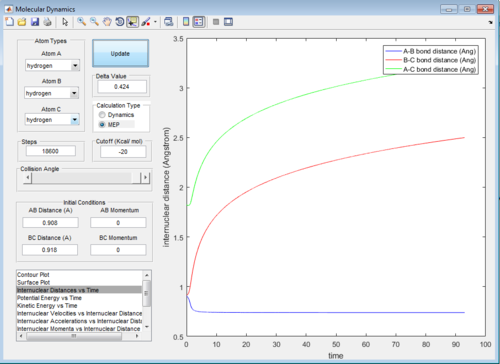

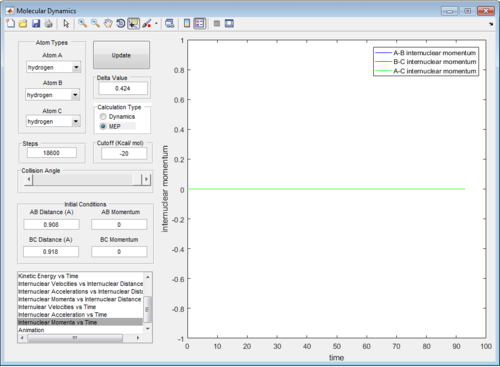
Then the values of the two internuclear distances are exchanged with momentum kept constant, which results in the trajectory going in the direction of the reactants, the internuclear distance vs time and internuclear momenta vs time graphs will have identical shapes only with AB and BC inverted as shown below:
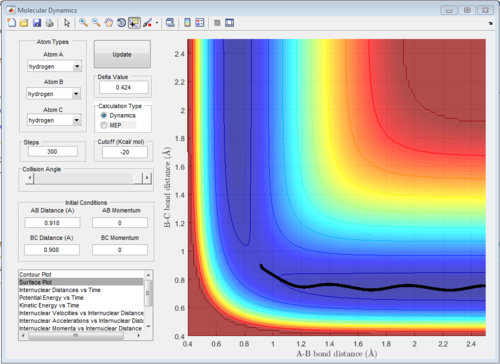
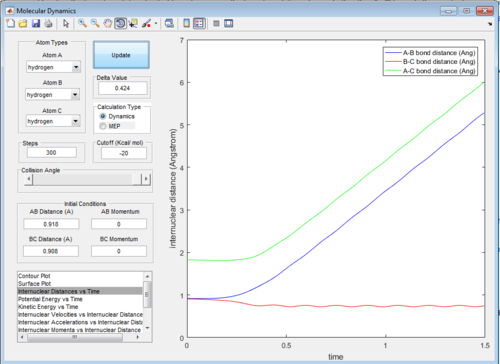
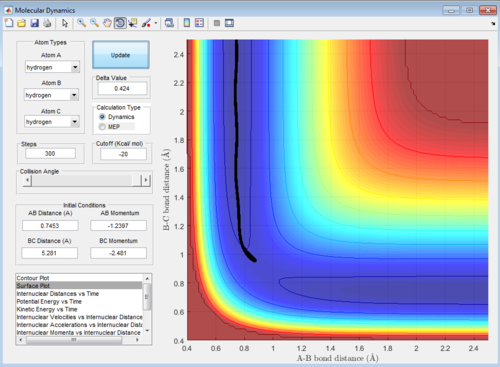
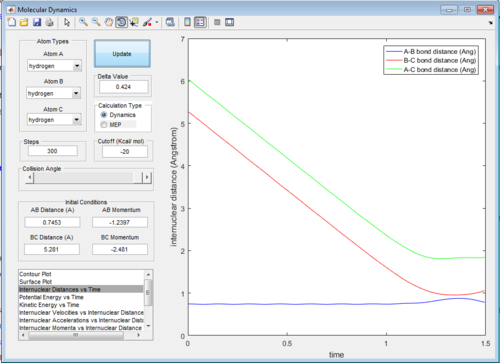
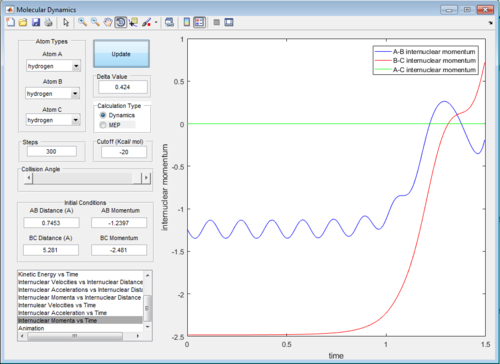
Then, the initial conditions are set as the final conditions as above with the signs of momenta inverted, and the resulting path goes from the products back to the transition state:
Reactive and Unreactive Trajectories
The trajectory is reactive under the following conditions as according to the above calculations:
rAB = 2.0 Å
rBC = 0.74 Å
-1.5 < pBC < -0.8 and pAB = -2.5
As these conditions are reactive, the conditions with higher momentum should have more than sufficient energy to cross the activation barrier and should also be reactive, however, it is not the case as there could be recrossing of the transition state and reformation of the reactants according to the following trajectories.
| pBC | pAB | Reactivity |
|---|---|---|
| -1.25 | -2.5 | Reactive |
| -1.5 | -2.0 | Uneactive |
| -1.5 | -2.5 | Reactive |
| -2.5 | -5.0 | Unreactive |
| -2.5 | -5.2 | Reactive |
Trajectory 1
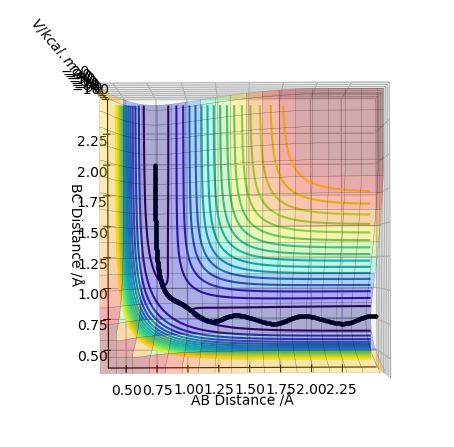
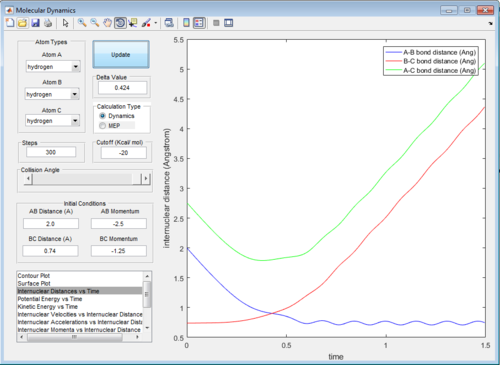
In trajectory 1, enough energy is provided by the initial momentum of the particles to overcome activation barrier, so the the H atom approaches and form a new H-H bond with one H atom in the hydrogen molecule.
Trajectory 2
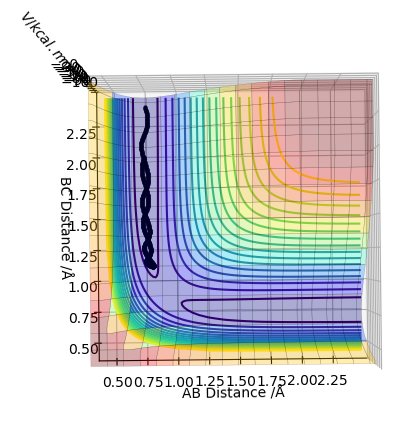
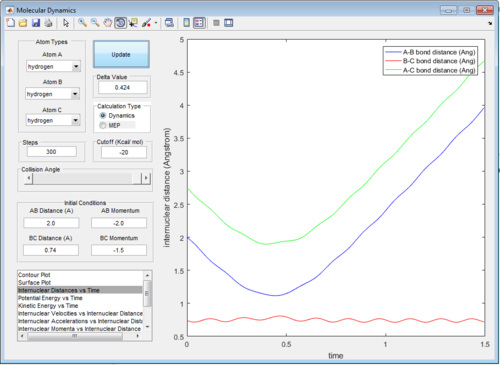
In trajectory 2, not enough energy is provided by the momentum to overcome the activation barrier, so the H atom approaches the transition state but reverts back before reaching the point.
Trajectory 3
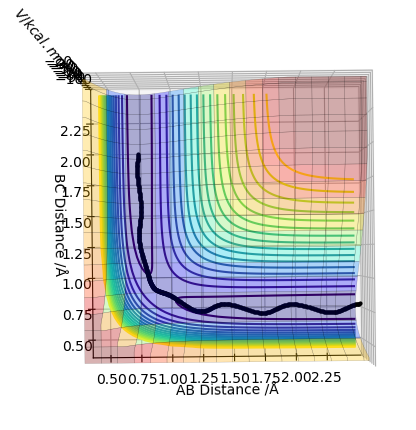
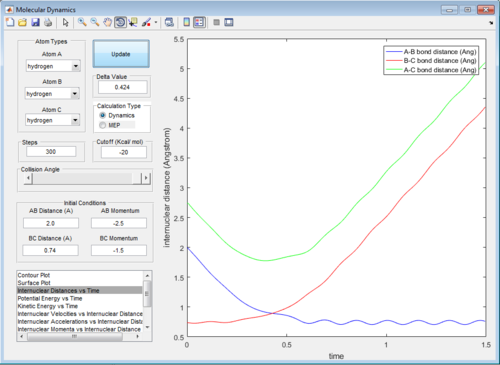
In trajectory 3, similar cases happen with that in trajectory 1, enough energy is provided to overcome the activation barrier to form the product.
Trajectory 4
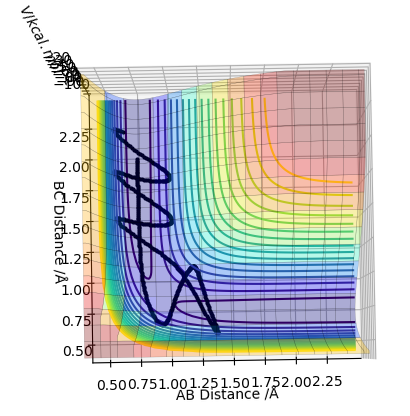
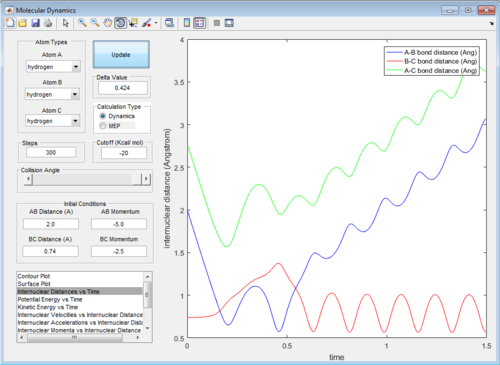
In trajectory 4, the system has enough energy to cross the transition state, but then it falls back and the reactants are reformed.
Trajectory 5
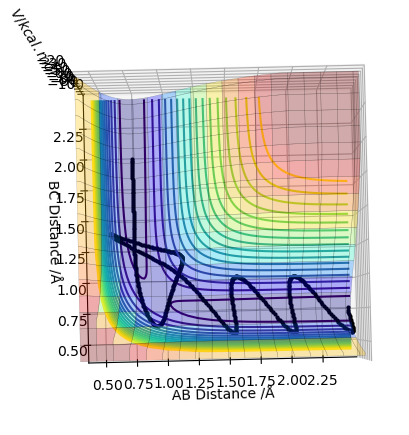
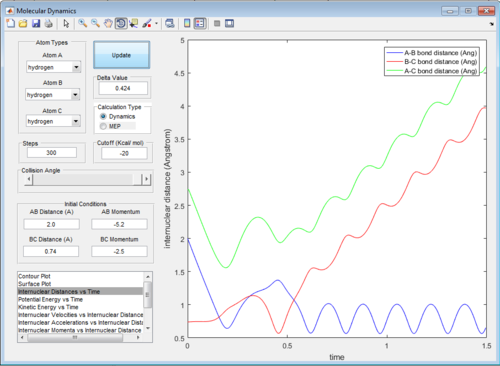
In trajectory 5, the system recrosses the transition state, but it has enough energy to cross again and form the final product.
Transition State Theory
In the Transition State Theory, it was assumed that at transition state, the reaction could only proceed in the direction of the products and could not go back to form the reactants.
However, in reality, for reactive trajectories, there is a possiblity for the transition state to recross and revert back to the reactant and then reform the products, in which the trajectory takes another path rather than predicted minimum energy path. Therefore,the experimental values of reaction rates are always slower than that predicted by the Transition State Theory.
Reaction 2: F-H-H system
In this reaction, three atoms are present, in which they could react via two ways:
1. F atom + H2 molecule reacts to give HF
2. H atom + HF molecule reacts to give H2 molecule and F atom
F+H2 Reaction
In this reaction, F atom collides with the H2 molecule to give HF molecule and H atom. As the H-F bond has a large difference of electronegativity, its ionic character increases so the bond strength of H-F will be much larger than that of H-H, so larger amount of energy will be released during H-F bond formation than the activation energy, and the reaction will be exothermic.
According to Hammond's Postulate, the transition state will resemble one of the reactant/product which has a closer energy. Therefore, in this reaction, the transition state complex will resemble that of the starting material with a relatively small value of activation energy.
Because the transition state resemble the reactants both in energy and in structure, it will be located near the position of the reactants on the potential energy curve.
As illustrated above, the transition state will be located at the position where if no momentum is given, it will remain at the position and the internuclear position will remain constant.
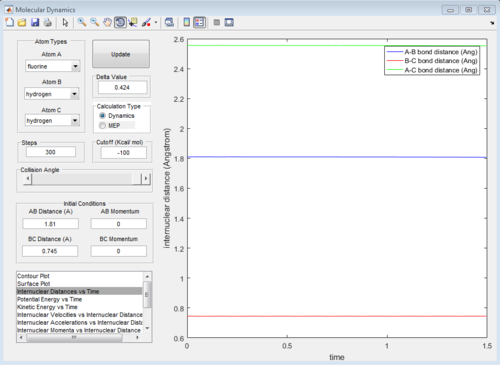
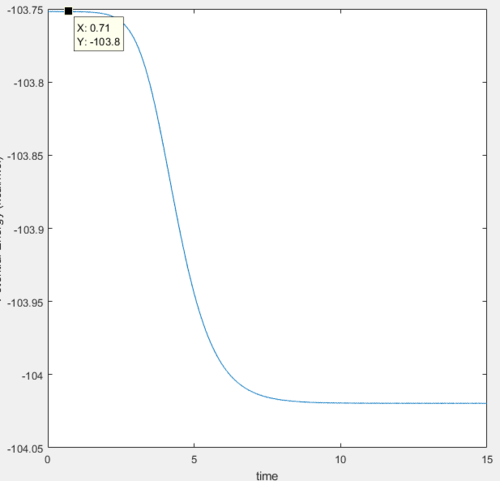
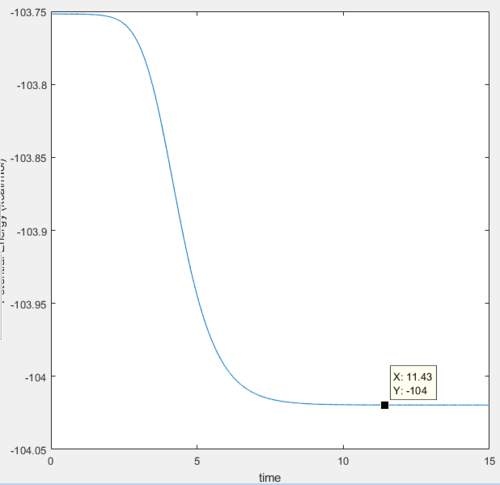
In this reaction, the transition state is located at the position where the internuclear distance of F and H AB=1.81 Å and the internuclear distance of H-H BC=0.745 Å.
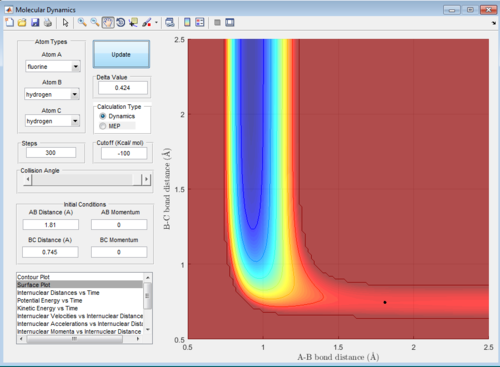
The activation energy is determined by the energy difference of the transition state and the reactants, which in this case was very small of around 0.2 kcal/mol.
H+HF Reaction
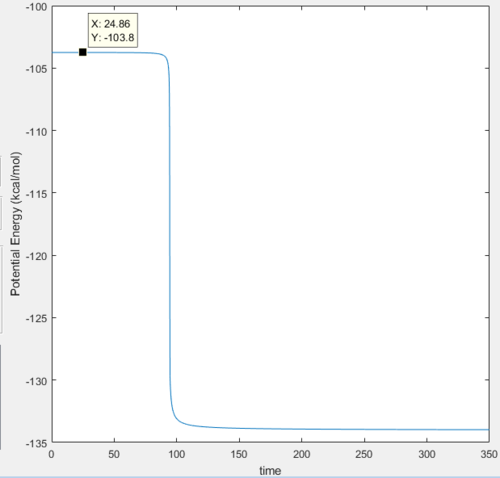
In this reaction, according to Hammond's Postulate, as the H-F bond strength is much higher than that of H-H bond formed, the product will be less stable than the reactants and the reaction will be endothermic. Therefore, the transition state will resemble the product and be located near the position of products on the potential energy curve.
The transition state is located at the position where the internuclear distance of H and H AB=1.81 Å and the internuclear distance of H-F BC=0.7465 Å.
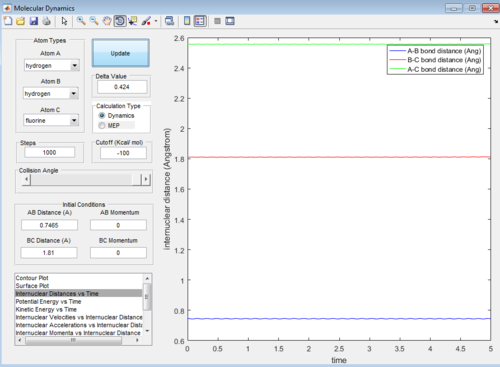
The activation energy is determined by the energy difference between reactants and transition state, which has the value of around 3.1 kcal/mol.
Reaction Dynamics
F + H2 Reaction
Firstly, one of the reactive trajectory was determined with the following conditions:
rFH=1.9 Å
rHH=0.745 Å
pFH=-1.9 kg m s-1
pHH=0.1 kg m s-1
where its internuclear distance vs time graph is shown below:
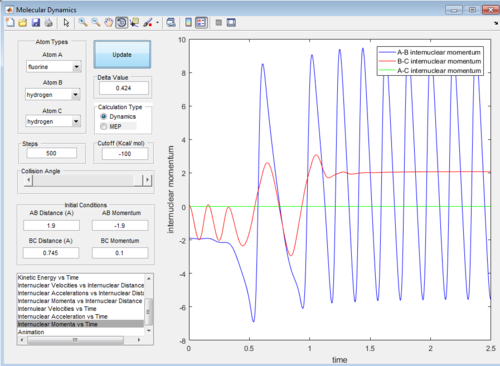
We could see that the reaction occurs to form HF molecule and H atom according to following observations:
1. approaching of the F atom(negative momentum) to the vibrating H2 molecule(shown by oscillating values of internuclear momentum)
2. the collision of two and then the dissociation of H2 molecule(shown by 1. increasing extent of oscillation of B-C internuclear momentum indicating lengthening of the bond. 2. constant B-C internuclear momenta afterwards indicating the dissociation of two H atoms and the steady movement of the H atom away from the HF molecule.) and the formation and vibration of the HF molecule(oscillation of A-B internuclear momentum).
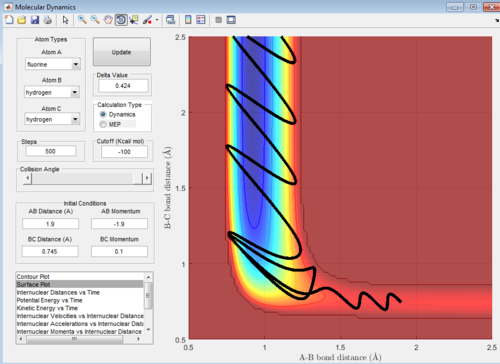
the dynamic surface plot of the reaction is shown below:
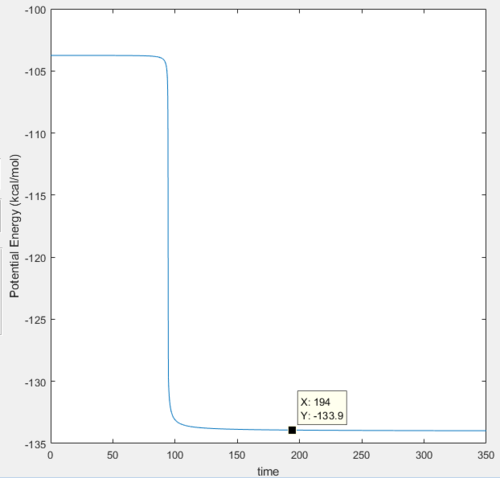
And the graphs of potential energy vs time and kinetic energy vs time are shown below:

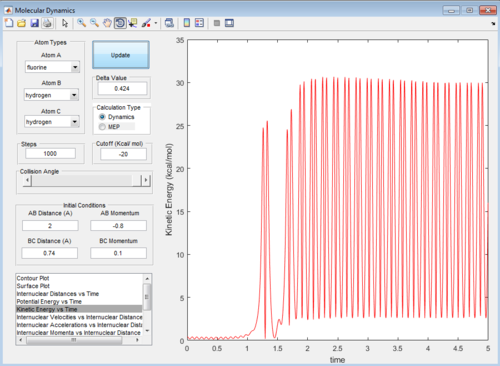
In the reaction, as the energy is conserved, the energy of the particles would be converted between potential and kinetic energies. At the start of the reaction,there are minor vibrations of the reactants shown by the small extent of fluctuations of energy with time shown in the beginning in both energy vs time graphs, where the energy is converted between two types but is largely potential energy and only has small amount of kinetic energy.
As the reaction is exothermic, the potential energy of the reactants will be much higher than that of the products, therefore there will be release of excess potential energy, which is converted into kinetic energy of the product, which is shown in the decrease in the potential energy and the increase in the kinetic energy of the system shown in the graph above. In addition, after the transition state, the molecule starts vibrate in a larger extent, and it could be observed in the large oscillations of the energy curves after transition state.
To confirm that experimentally, IR spectroscopy could be used as it monitors the vibration movement of the moleucules.
Then the value of internuclear momentum of H-H varied between -3-3 kg m s-1, and the two internuclear distances and the internuclear momentum of F-H are kept constant with values of:
rFH=1.81 Å
rHH=0.74 Å
pFH=-0.5 kg m s-1
The values of are and the reactivity of these conditions are shown below:
| pHH | -3.0 | -2.5 | -2.0 | -1.5 | -1.0 | -0.5 | 0.0 | 0.5 | 1.0 | 1.5 | 2.0 | 2.5 | 3.0 |
|---|---|---|---|---|---|---|---|---|---|---|---|---|---|
| Reactivity | Unreactive | Unreactive | Reactive | Unreactive | Unreactive | Unreactive | Reactive | Unreactive | Unreactive | Unreactive | Unreactive | Reactive | Unreactive |
The internuclear distance vs time graphs are shown below:
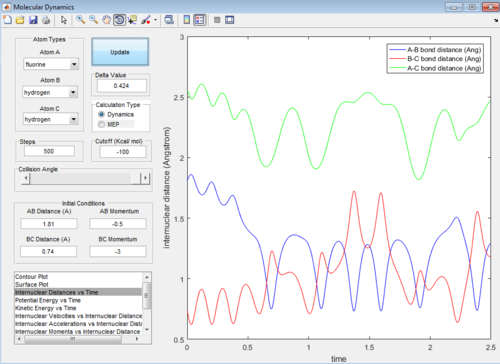

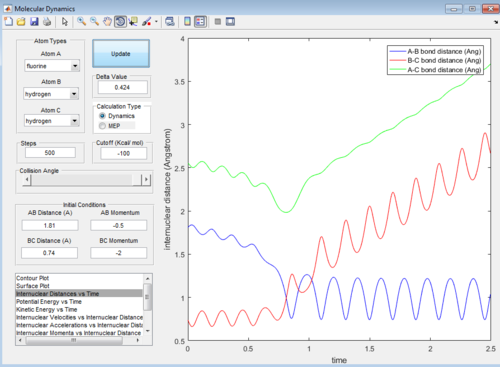

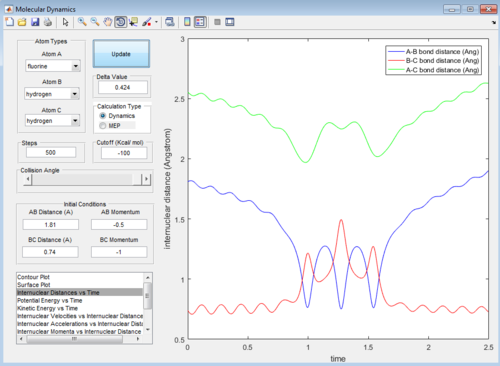
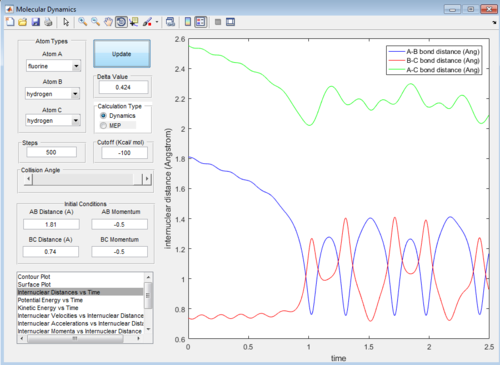
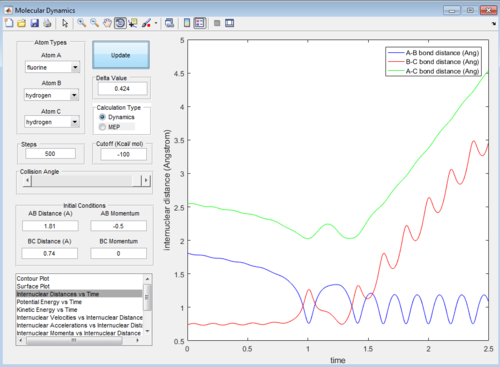
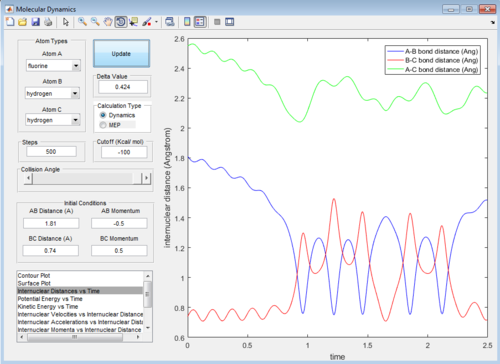
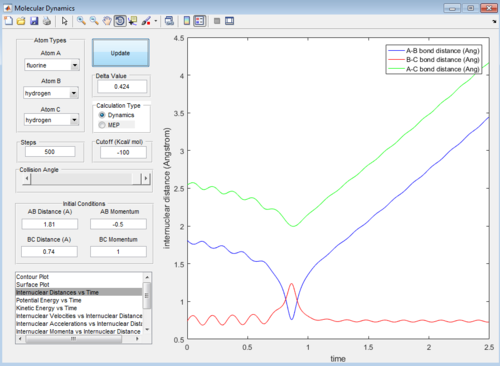
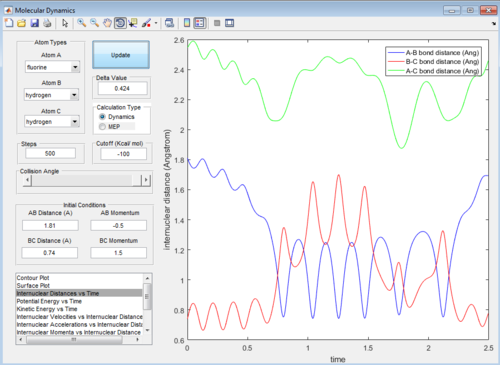
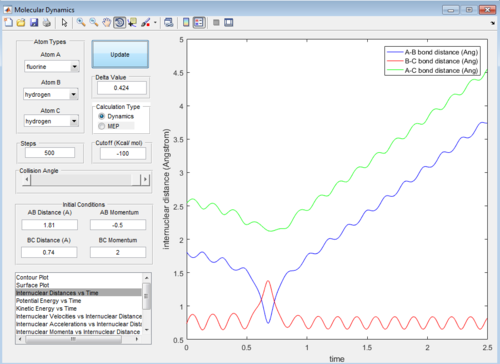
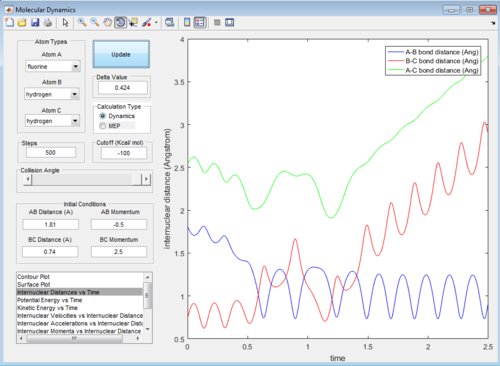
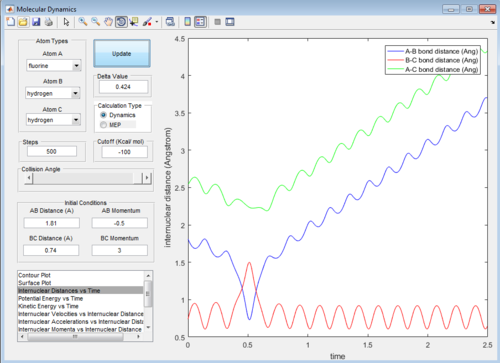
As the activation energy is quite small in this exothermic reaction, significant energy is put into the internuclear momentum of the atoms compared that with the activation energy, therefore, it is predicted that the trajectory should always be reactive. However, this is not the case for these sets of reaction, as only certain values of pHH leads to reactive trajectory.
Then the same initial internuclear distances are used, with internuclear momentum changed to:
pFH=-0.8 kg m s-1
pHH=0.1 kg m s-1
This set of conditions gives a reactive trajectory as shown below:
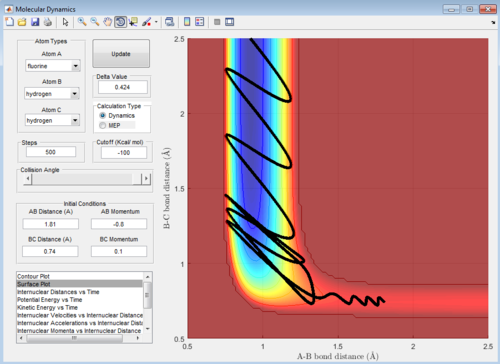
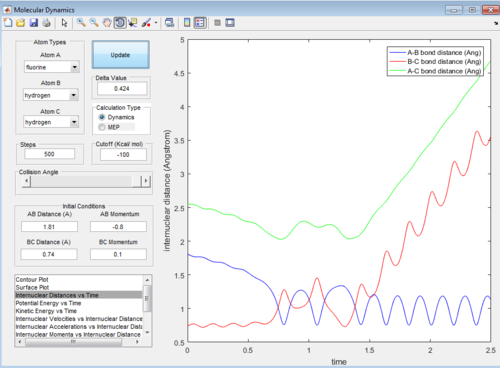
In this reaction, it could be observed that in the reactive trajectory,the reactants have low vibrational kinetic energy which react in a exothermic reaction to give product with high vibrational kinetic energy.
H + HF Reaction
The initial conditions are set to the values below so that the the reactants have low vibrational kinetic energy:
rHH=2.0 Å
rHF=0.91 Å
pHH=-2.2 kg m s-1
pHF=-2.0 kg m s-1
The trajectory is unreactive as shown below:
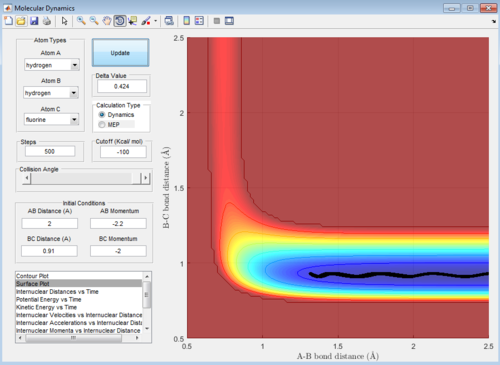
Then, the momentum of incoming hydrogen atom is reduced and the internuclear momentum of the HF molecule are increased and several sets of internuclear momenta are tested to give the reactive combinations below:
| pHH kg m s-1 | pHF kg m s-1 |
|---|---|
| -0.9 | 8.5 |
| -0.9 | 10.0 |
| -1.0 | 10.0 |
| -2.0 | 8.5 |
The surface plots are shown as below:
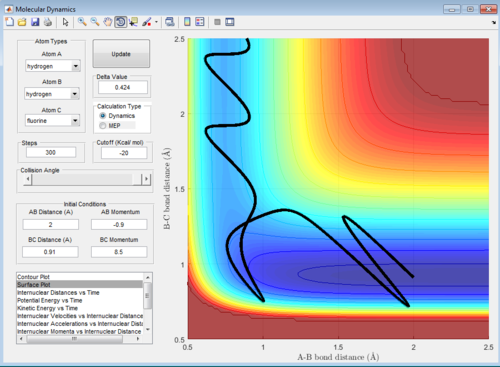


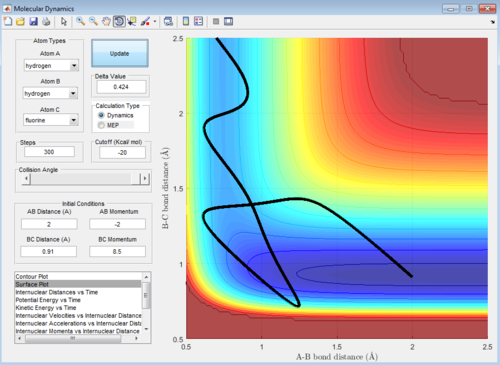
Polanyi's empirical rules states that the vibrational energy is more efficient in promoting a late-barrier reaction than the translational energy.
As a result, as H+HF reaction is an endothermic and so a late-barrier reaction, it should obey the rules.
As the vibrational energy is low in the above trajectory, it does not react as according to the rules.
The following four examples, all with high intermolecular momenta and high vibrational energy as shown in the potential energy surface plots, all proceeds to form the product. Compared with the example above, they have large values of pHF and low values of HH, therefore, the ratio between the translational and vibrational energy is quite high.
Also, for the early-barrier reaction of F+H2 reaction, it reacts with a rather small ratio of two momenta(reactive trajectories have the momentum ratio of :2:1,1.67:1,and 2.08:1), which is different from that in H+HF reaction.
Therefore, the reacion trajectories obey the Polanyi's rules.
