MRD:YX8818CX
Part 1: H + H2 system
Dynamics from the transition state region
In part 1, r1 = rAB, r2 = rBC.
Q1: On a potential energy surface diagram, how is the transition state mathematically defined? How can the transition state be identified, and how can it be distinguished from a local minimum of the potential energy surface?
On a potential energy (PE) surface, the transition state is a saddle point. At that point the gradient of the potential is zero. Mathematically speaking, a saddle point is a point on a surface of a function graph where the slopes (derivatives) in orthogonal directions are all zero, but which is not a local maximum or minimum of the function (as illustrated in the figure[1] on the right).
The saddle point can be determined mathematically by calculating the Hessian matrix for the function at that point.[2] For a function f(x,y) of two variables, a point is a saddle point if:
If fx = 0, fy = 0, and fxxfyy - f2xy < 0. Where fx and fxx are the first and second derivative of f with respect to x respectively.
The transition state (the saddle point) can be identified in a three-dimensional PE plot by looking at the surface at both direcions (r1 and r2 ). A saddle point will be a maximum in one direction and a minimum in the other direction. It can be easily distinguished from a local minimum, as a local minimum will be a minimum in all directions.[3] Great! Mak214 (talk) 18:09, 29 May 2020 (BST)
Trajectories from r1 = r2: locating the transition state
Q2: Report your best estimate of the transition state position (rts) and explain your reasoning illustrating it with a “Internuclear Distances vs Time” plot for a relevant trajectory.
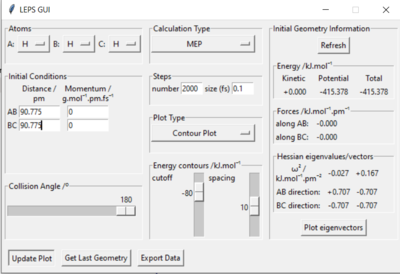
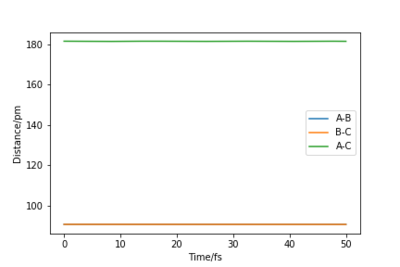
My best estimate of the TS position rts is 90.775 pm.
As p1 = p2 = 0, there is no initial momentum, hence no kinetic energy. So if the H + H2 surface start at the transition state, there will be no oscillation seen in the Distance vs Time plot, thus rAB and rBC will be constant. When r1 = r2 = 90.775 pm, there is negligible oscillatory behaviour displayed in the Distance vs Time plot and zero force along AB and BC, as shown in Figures. This indicates the transition state position (rts) is very close to this value. Well done. Mak214 (talk) 18:09, 29 May 2020 (BST)
 |
 |
Calculating the reaction path
Trajectories from r1 = rts+δ, r2 = rts
Q3: Comment on how the mep and the trajectory you just calculated differ.
1 decimal place of the transition state position here was used for simplicity, i.e. rts = 91.8 pm
Using r1 = rts+1 = 91.8 pm, r2 = rts = 90.8 pm
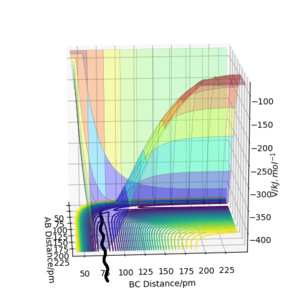
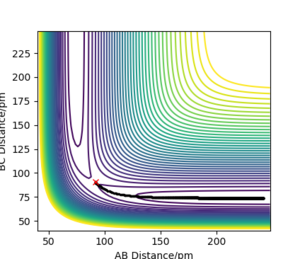
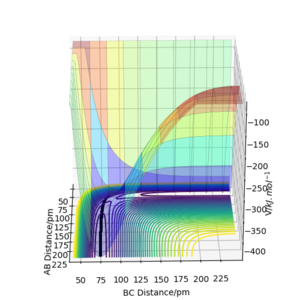
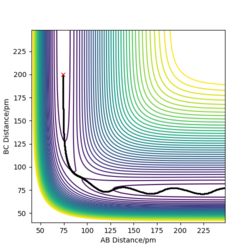
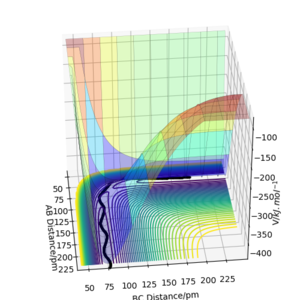
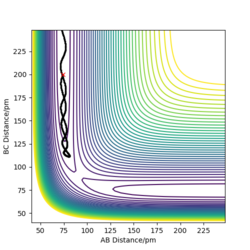
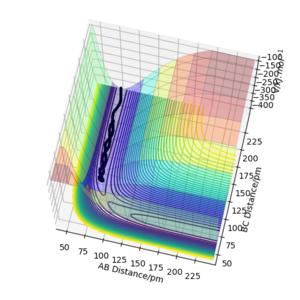
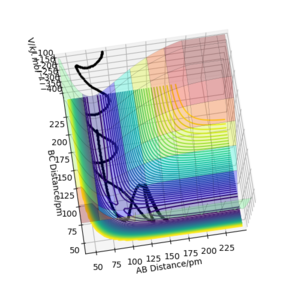
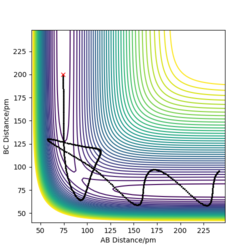
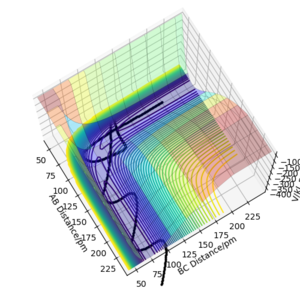
As shown from the contour and surface plots below, The minimum energy path (mep) corresponded to infinitely slow motions, with velocities / momenta reset to zero for each step. Thus, the trajectory corresponds to infinitely slow motion, and simply follows the valley floor, no oscilatiory behaviour is visible. While the mep plot is useful in characterising the reaction, it does not give an realistic account of the atomic motions.
In comparison, the dynamics surface plot gave a more accurate description of atomic motions (inertial) during the reaction. Oscillations of the potential for the H atoms were observed for dynamics plots. Yes. A clear response, thank you. Mak214 (talk) 18:09, 29 May 2020 (BST)
Additional Questions:
A1: Look at the “Internuclear Distances vs Time” and “Momenta vs Time”. What would change if we used the initial conditions r1 = rts and r2 = rts+1 pm instead?
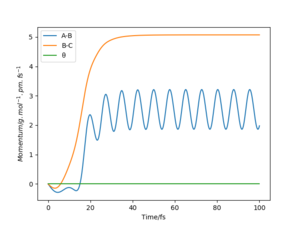
As shown in the “Internuclear Distances vs Time” and “Momenta vs Time” plots below, when r1 = rts+1, r2 = rts, the reaction proceed to form the products, and H2 molecule BC and H atom A were formed. This is because the transition state was displaced slightly towards the products.
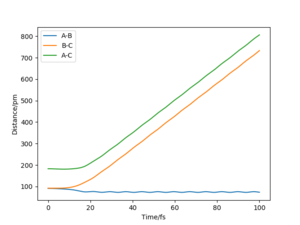
On the other hand, when r1 = rts, r2 = rts+1, the reaction proceed to form the reactants, and molecule AB and atom C were formed.This is because the transition state was displaced slightly towards the reactants.
| initial conditions | r1 = rts+1, r2 = rts | r1 = rts, r2 = rts+1 |
|---|---|---|
| Internuclear Distances vs Time Plot | 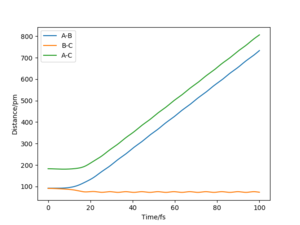
|
|
| Momenta vs Time Plot | 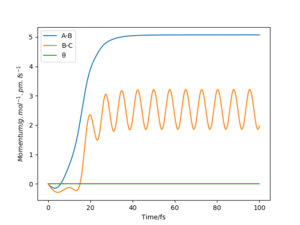
|
|
A2: Note final values of the positions r1(t) r2(t) and p1(t) p2(t) for your trajectory for large enough t .
t = 100 fs was chosen, and for r1 = rts, r2 = rts+1, r1(t) = 731 pm, r2(t) = 75.5 pm, p1(t) = 5.1 g.mol-1.pm.fs-1, p2(t) =2.5 g.mol-1.pm.fs-1.
A3: Setup a calculation where the initial positions correspond to the final positions of the trajectory you calculated above, the same final momenta values but with their signs reversed. What do you observe?
When momentum was reversed, the trajectory traced back to the original position (slightly towards the product from the TS). But as it does not have enough energy to overcome the energy barrier at the TS, it traced back to the product, H2 molecules BC and H atoms A.
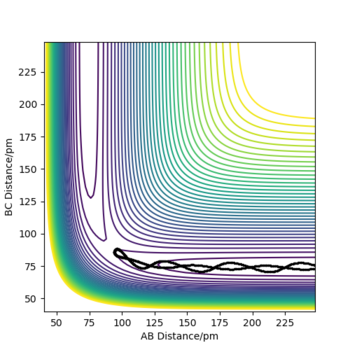
Reactive and unreactive trajectories
The following simulations were investigated with different reaction conditions (momentum) to see whether they resulted in reactive trajectory.
- Initial positions r1 = 74 pm and r2 = 200 pm.
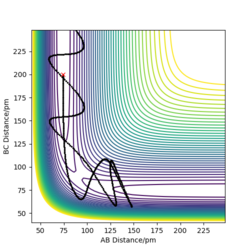
Q4: Complete the table above by adding the total energy, whether the trajectory is reactive or unreactive, and provide a plot of the trajectory and a small description for what happens along the trajectory. What can you conclude from the table?
The hypthesis tested with the above simulation was: For a reactive trajectory, all trajectories starting with the same positions but with higher values of momenta (higher kinetic energy) would be reactive, as they have enough kinetic energy to overcome the activation barrier.
From the simulations of the trajectory, it is found that the hypothesis is false. This is supported by simulation 4, which have momenta higher than some reactive trajectories, but was not reactive. This shows that not all all trajectories starting with the same positions but with higher values of momenta would be reactive. The reactivity of a trajectory thus depend on not just the total energy in the system but also on how the energy is distributed.
Transition State Theory
Q5: Given the results you have obtained, how will Transition State Theory predictions for reaction rate values compare with experimental values?
During a molecular collision, we must consider two molecules to form a single quantum-mechanical entity, which is called a supermolecule.[4]
The Transition State Theory (TST)[4] [5]chooses a boundary surface located between the reactant and product regions and assumes that all supermolecules that cross this boundary surface become products. The boundary surface, called the (critical) dividing surface, is taken to pass through the saddle point of the potential-energy surface.
TST has the following three main assumptions:
1. All supermolecules that cross the critical dividing surface from the reactant side becomes product.
2. During the reaction, the Boltzmann distribution of energy is maintained for the reactant molecules.
3. The supermolecules crossing the critical surface from the reactant side have a Boltzmann distribution of energy corresponding to the temperature of the reacting system.
Experimental results may violate the assumption 1, as in reality reactants and products are in equilibrium, thus allowing both forward and backward reactions to take place, so not all supermolecules that crossed the critical dividing surface from the reactant side will becomes product, causing experimental rates to be lower than TST prediction.This is supported by the simulations findings above.
It was found that majority of the results obtained (Set 1, 2, 3, and 5) agrees with the Transition State Theory, as the supermolecules with sufficient momenta to cross the critical dividing surface from the reactant side becomes product, and those that did not crossed the critical dividing surface remain as reactants. However, the results from Set 4, where the supermolecule recrossed the boundary, contradicted Assumption 1 of TST, showing that some supermolecules that crossed the critical dividing surface containing the transition state, can rebound and reformed the reactants. This shows that TST prediction for reaction rate values might not accurately agrees with experimental values for some cases.
Furthermore, as TST is a classical theory, it does not factor in the quantumn tunneling effect, which could result in the experimental rates to be higher the theory.
Note: the simulations above does not allow investigation in to the Boltzmann distribution of energy in the TST assumption as the system investigated consist of only two reactants, hence is only a small part on the Boltzmann distribution. Great Mak214 (talk) 18:46, 29 May 2020 (BST)
Part 2: F - H - H system
In part 1, rHF = r1 = rAB, rHH = r2 = rBC.
PES inspection
Q6: By inspecting the potential energy surfaces, classify the F + H2 and H + HF reactions according to their energetics (endothermic or exothermic). How does this relate to the bond strength of the chemical species involved?
The potential energy surface for F + H2 → HF + H prcess is shown below:

F + H2 → HF + H : Exothermic.
This can be shown from the lowering of potential energy going from reactant to products.
HF + H → F + H2: Endothermic.
This can be shown from the increase in energy going from reactants to products going in the reverse direction.
Bond strength of HF = 565 kJ.mol-1[6]
Bond strength of H2 = 432 kJ.mol-1[6]
The stronger bond strength of HF bond is a result of the high electronegativity of the F atom, which results in high bond polarisation in the HF bond and a strong ionic / electrostatic attraction between H and F atoms.
F + H2 → HF + H, ΔH = -565 + 432 = -133 kJ.mol-1, which supports it being an exothermic process as energy is being released overall. This is because the energy required to break the H-H bond is less than the energy released in the formation of H-F bond.
HF + H → F + H2 , ΔH = 565 - 432 = 133 kJ.mol-1, which supports it being an enothermic process as energy is being absorbed overall. This is because the energy required to break the H-F bond is more than the energy released in the formation of H-H bond.
Exemplary answer. Mak214 (talk) 19:20, 29 May 2020 (BST)
Q7: Locate the approximate position of the transition state.
By Hammond postulate, an exothermic reaction of F + H2 to HF + H has an early transition state that resemble the reactant.
Thus, the distance rAB between F and H2 molecule should be large, while the H2 molecule distance rBC should be close the H2 bond distance.
Using the same method in Q2, the transition state position was found to be as follows:
F-H distance, rAB = 181.13 pm.
H-H distance, rBC = 74.45 pm.
 |
 |
 |
Q8: Report the activation energy for both reactions.
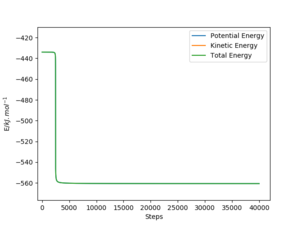
The activation energy of the forward and backward reactions where found by locating the energy of the transition state, reactants, and product, then determining the difference. The reactant and product formation trajectories were obtained by perturbing the system slightly away from the transition state. Results are summarised in the tables below:
| system | rHF / pm | rHH / pm | Total Energy / kJ.mol-1 | Activation EnergyTotal Energy / kJ.mol-1 |
|---|---|---|---|---|
| transition state: F-H-H | 181.13 | 74.45 | -433.978 | --- |
| reactant to product:
F + H2 → HF + H |
180.13 | 74.45 | -560.328 | -433.978 - (-560.328) = 126.350 |
| product to reactant:
HF + H → F + H2 |
182.95 | 74.45 | -435.015 | -433.978 - (-435.015) = 1.037 |
| system | Energy vs time plot (full scale) | Energy vs time plot (zoomed) | Contour plot |
|---|---|---|---|
| transition state: F-H-H | --- | --- | --- |
| reactant to product:
F + H2 → HF + H |

|
|

|
| product to reactant:
HF + H → F + H2 |

|

|

|
Good work well done. Mak214 (talk) 19:20, 29 May 2020 (BST)
Reaction dynamics
The following is a set of reaction conditions that resulted in a reactive trajectory for F + H2
| rFH/pm | rHH / pm | p1/ g.mol-1.pm.fs-1 | p2/ g.mol-1.pm.fs-1 | Illustration of the trajectory |
|---|---|---|---|---|
| 200 | 75 | -1.5 | 0.5 | 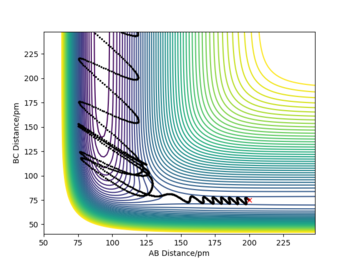
|
| Energy vs time plot | Momentum vs time plot |
|---|---|

|

|
Q9: In light of the fact that energy is conserved, discuss the mechanism of release of the reaction energy. Explain how this could be confirmed experimentally.
Before the reaction took place (t = 0 to 60 s), the F atom only has translational energy, while H2 molecule has both translational and vibrational energy (as shown from the oscillatory behavior in momentum vs time diagram). Before the reaction, the total kinetic and potential energy were relatively constant (at 0 kJ.mol-1 and -433 kJ.mol-1 respectively).
After the exothermic reaction (at around t = 60 s), F + H2 → HF + H, some of the potential energy was converted into kinetic energy of the system, with the total energy remained constant (conservation of energy), as shown in the Energy vs time plot. The kinetic energy could be in the form of translational and vibrational (rotational and electronic energies were ignored here). For the HF molecule formed, its kinetic energy / momentum was in both translation and vibrational; while for the H atom, only translation energy was left. The HF molecule was observed to have a larg bond oscillation along the H-F bond, which resulted in larger oscillations in kinetic and potential energy after the reaction.
The overall release of energy / heat of this exothermic reaction could be monitored using calorimetry.[7] For a reaction involving gaseous reactants, constant-volume calorimeters, such as the bomb calorimeter, is suitable. The reactants can be placed inside a steel vessel with know heat capacity and sealed within an insulated container with known amount of water. The heat released could then be calculated from the temperature change.
In particular, the vibrational energy can be measured using IR spectroscopy, where absorption spectrum can be monitored over time. Before the reaction, the reactants mainly occupied the ground state (lowest vibrational energy level), there would essentially be one absorption peak from 0 to 1. During the exothermic reaction, the molecules will gain vibrational kinetic energy and be excited to occupy the first excited state, allowing overtones (1 to 2) to be observed at lower wavenumbers, thus resulting in two absorption peaks. As the reaction takes place, the intensity of the overtone will be come larger, and the intensity of the fundamental would decrease. After the reaction is complete, the vibrational modes will gradually relax back to the ground state, causing the overtones to disappear, and the fundamental to increase.
Emission of light as a result of this reaction, chemiluminescence,[8] could also be used to monitor this process. The process monitored here would be the decay of the excited state to the lower energy level (ground state). Nice. Thank you for doing some extra reading to give an interesting answer. Mak214 (talk) 19:20, 29 May 2020 (BST)
Further studies
Further invesitgations were conducted to investigate the effect of distribution of energy among translational and vibrational modes on the efficiency of the reaction:
- F + H2 → HF + H. Initial conditions: r1 = rHF = 200 pm, r2 = rHH = 74 pm, p1 = pFH = -1.0 g.mol-1.pm.fs-1, pHH in the range -6.1 to 6.1 g.mol-1.pm.fs-1 .
- Table 1:
| pFH/ g.mol-1.pm.fs-1 | pHH/ g.mol-1.pm.fs-1 | Reactive? |
|---|---|---|
| -1.0 | -6.0 | No |
| -1.0 | -3 | No |
| -1.0 | -2 | No |
| -1.0 | -1 | Yes |
| -1.0 | 0 | Yes |
| -1.0 | 1 | Yes |
| -1.0 | 2 | No |
| -1.0 | 4 | No |
| -1.0 | 5.5 | No |
- F + H2 → HF + H. For the same initial positions, simulations below were conducted.
- Table 2:
| p1/ g.mol-1.pm.fs-1 | p2/ g.mol-1.pm.fs-1 | Reactive? |
|---|---|---|
| -1.5 | 0.2 | Yes |
| -1.6 | 0.2 | Yes |
| -6.0 | 0.2 | Yes |
- For the reverse reaction, HF + H → F + H2. r1 = rHF = 180 pm and r2 = rHH = 74 pm, the following simulations were conducted.
- Table 3:
| p1/ g.mol-1.pm.fs-1 | p2/ g.mol-1.pm.fs-1 | Reactive? |
|---|---|---|
| -8.0 | 1 | Yes |
| -4.0 | 1 | Yes |
| -1.0 | 1 | No |
| -1.0 | -3.0 | No |
Q10: Discuss how the distribution of energy between different modes (translation and vibration) affect the efficiency of the reaction, and how this is influenced by the position of the transition state.
The effect of energy distribution on reaction efficiency can be described by Polanyi's empirical rules.[9]
Polanyi's empirical rules describes how different forms of energy affect the rates of reactions. The rules state that for a given amount of energy / momentum, the vibrational energy is more efficient than translational energy in activating an late barrier / endothermic reactio; whereas translational energy is more efficient than vibrational energy for an early barrier / exothermic reaction.
F + H2 → HF + H is an exothermic reaction with an early barrier, thus the trajectory with high translational energy (pFH) and low vibrational energy (pHH) is reactive.
This is suported by the simulations in Tables 1 and 2, where trajectories with high pFH and low pHH are generally reactive, whereas trajectories with low pFH and high pHH are generally unreactive. This is because the momentum in F atom (pFH) is almost entirely translational, whereas the energy in H2 molecules (pHH) is both translational and vibrational, and the vibrational energy can be thought of as proportional to the total energy present. The trends in the table largely suports Polanyi's rules that translational energy is more efficient in early barrier.
HF + H → F + H2 is an endothermic reaction, thus the trajectory with high vibrational energy (pFH) and low translational energy(pHH) is reactive.
Trends shown in Table 3 also largely supports Polanyi's rules that vibrational energy is more efficient for late barriers. As when higher vibrational energy (pFH) and lower translational energy(pHH) tend to give reactive trajectories.
However, its worthy to note that in the above simulations, the total energy was not kept constants while varying the proportions of the translational and vibrational energy. And the trajectories of the simulations are quite sensitives, sometimes giving conflicting results for certain values of initial conditions. Further explorations could be considered by keeping the total energy / momentum in the one-dimensional trajectory constant, perhaps by varying the collison angle or using more sophisticated simulation package. Well done. A thorough, thoughtful report thank you. It was interesting to see everything that you did to explore the program you were given. Mak214 (talk) 19:20, 29 May 2020 (BST)
References
- ↑ Wikipedia, The Free Encyclopedia, s.v. "Saddle point," (accessed May 20, 2020), https://en.wikipedia.org/wiki/Saddle_point
- ↑ Smith, Colin M. "How to find a saddle point." International journal of quantum chemistry 37.6 (1990): 773-783.
- ↑ Henkelman, Graeme, Gísli Jóhannesson, and Hannes Jónsson. "Methods for finding saddle points and minimum energy paths." Theoretical methods in condensed phase chemistry. Springer, Dordrecht, 2002. 269-302.
- ↑ 4.0 4.1 Daniels, Farrington, J. Howard Mathews, and John Warren Williams. Experimental physical chemistry. No. 541 D35 1962. New York: McGraw-Hill, 1962, chap 22.
- ↑ Henriksen, Niels E., and Flemming Y. Hansen. Theories of molecular reaction dynamics: the microscopic foundation of chemical kinetics. Oxford University Press, 2018.
- ↑ 6.0 6.1 Huheey, pps. A-21 to A-34; T.L. Cottrell, "The Strengths of Chemical Bonds," 2nd ed., Butterworths, London, 1958; B. deB. Darwent, "National Standard Reference Data Series," National Bureau of Standards, No. 31, Washington, DC, 1970; S.W. Benson, J. Chem. Educ., 42, 502 (1965).
- ↑ Sunner, Stig, and Margaret Mansson. "Experimental chemical thermodynamics. Volume I. Combustion calorimetry." (1979).
- ↑ Dodeigne, C., L. Thunus, and R. Lejeune. "Chemiluminescence as diagnostic tool. A review." Talanta 51.3 (2000): 415-439.
- ↑ D. M. Hirst Potential Energy Surfaces: Molecular Structure and Reaction Dynamics Taylor and Francis, 1985, Chap 6.3.


