MRD:XYK17
Introduction
This experiment involved simulation of chemical reaction by describing the relative motion of the atoms during the reaction, to study an atom-diatom collision reaction. This was done by looking into the simplest model, H + H-H system as well as a F-H-H system.
H + H2 System
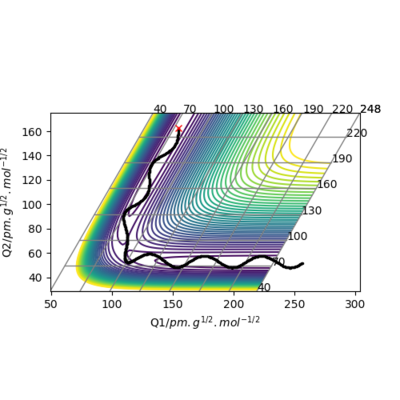
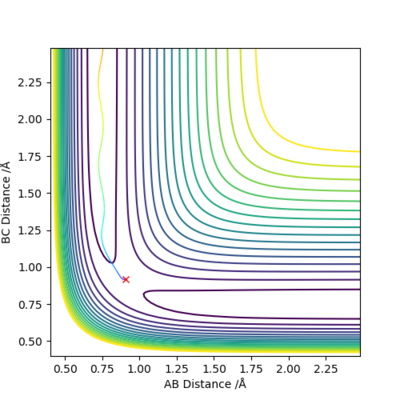
In simple terms, atom A collides with molecule BC and forms a new molecule, while C drifts away as a distinct atom. Before collision, the distance r2 (or RAB) gradually decreases as A approaches B; after collision, r1 (or RBC) gradually increases as it moves away. In the calculations performed, the initial conditions were set as follows:
r1 = 0.74 Å and r2 = 2.30 Å, where r1 is the actual bond length of H-H, and allowing r2 to slowly decrease.
p1 = 0 and p2 = -2.7.
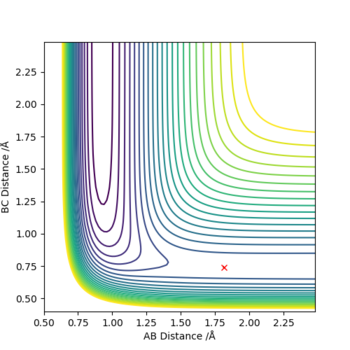
Figure 1. the contour plot showing the trajectory of the reaction
Transition state
On a potential energy surface diagram, how is the transition state mathematically defined? How can the transition state be identified, and how can it be distinguished from a local minimum of the potential energy surface?
Transition state can be identified as the maximum on the minimum energy path connecting both reactants and the products. On a potential energy surface, it is defined mathematically as the point at which fx = 0 and fy = 0 obeys fxx fyy − fxy2 < 0 (where fx represents derivative with respect to distance x, and fy represents with respect to distance y).[1] In simple terms, the transition structure is known as a "saddle point" in the potential energy surface. To distinguish the saddle point from a normal local minimum, it is the stable point where the function has a maximum in one direction, but a local minimum in another direction. In terms of locating the transition state, it is the position at which three atoms A, B and C will just oscillate on the ridge and never fall off, since there's no gradient in the direction at right angles to it.
OK, almost there. What are x and y? How do you define them in terms of the distances r1 and r2? Check in the script! Mak214 (talk) 16:29, 23 May 2019 (BST)
Report your best estimate of the transition state position (rts) and explain your reasoning illustrating it with a “Internuclear Distances vs Time” plot for a relevant trajectory.
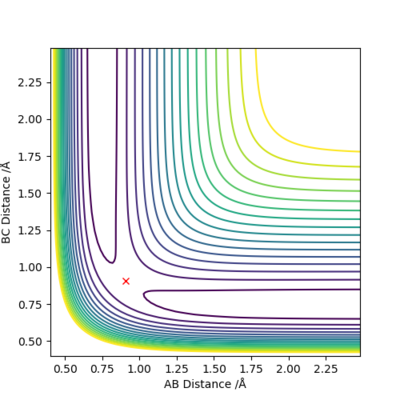
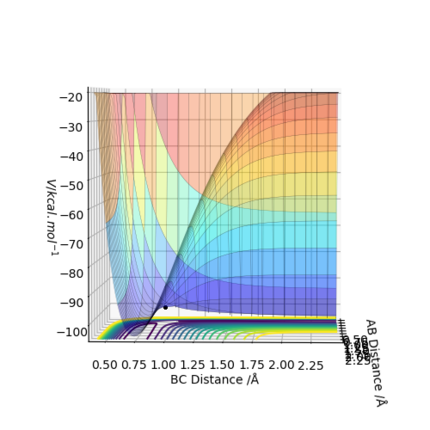
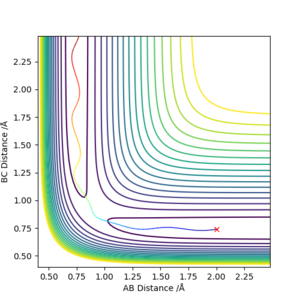
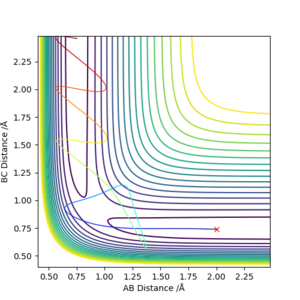
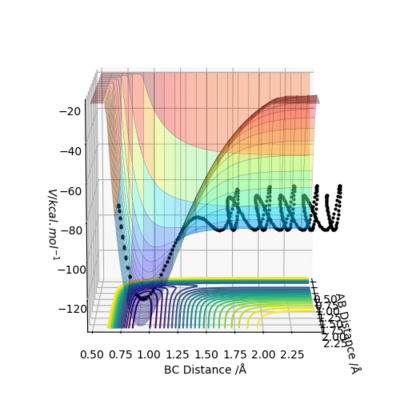
A simulation with zero momentum and varying distances of r1 = r2 was carried out to locate the transition state position. To determine this, it is the distance at which three species have no motion as there is no drive to move at that point. They will just move at the ridge but never fall off. And transition state position, rts was found to be 0.908 Å. This is because from an 'internuclear vs time' plot (figure 2), it can be seen that there are two horizontal straight lines, which shows that there are no change in distance between the species, implying no movement and that the species will "stay" at these positions. In addition, both contour plot (figure 3) and potential energy surface plot (figure 4) shows that there is only one 'dot', which implies that there is no trajectory.
Great. Mak214 (talk) 16:29, 23 May 2019 (BST)
Figure 2. internuclear distance vs time plot
Figure 3. contour plot
Figure 4. potential energy surface plot
Reaction pathway
Comment on how the mep and the trajectory you just calculated differ.
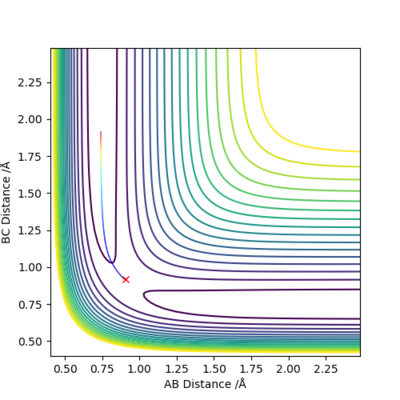
There is a special trajectory called minimum energy path (MEP) besides the dynamics trajectory calculated previously. Now that the initial conditions were set slightly different: r1 = rts + 0.01, r2 = rts , where the system is slightly displaced from the transition state; and p1 = p2 = 0. When MEP trajectory is used, the trajectory is short and it stops at a certain minimum point, as shown in figure 5 below. Whereas with dynamics, the trajectory is much longer. This is because MEP corresponds to infinitely slow motion and the momenta are always reset to zero in the next step, therefore at the minimum point it will stop as there is no drive here. However in reality, atoms have mass and each motion always has inertia, and MEP does not account for this therefore it might not be very accurate. Great. Mak214 (talk) 16:29, 23 May 2019 (BST)
Figure 5 and 6. MEP trajectory and dynamics trajectory
Reactive and unreactive trajectories
Complete the table above by adding the total energy, whether the trajectory is reactive or unreactive, and provide a plot of the trajectory and a small description for what happens along the trajectory. What can you conclude from the table?
A few trajectories were run, to test if one is reactive, with the initial positions r1 = 0.74, r2 = 2.0 Å, and the momenta combination stated in the table below:
| p1 | p2 | Etotal | Reactive? | Description of the dynamics | |
|---|---|---|---|---|---|
| 1 | -1.25 | -2.5 | -99.018 | Reactive | There is a trajectory in the correct direction, implying that there is a reaction occuring and to succesfully form new molecule. |
| 2 | -1.5 | -2.0 | -100.456 | Unreactive | There is no successful reaction as the reactant returns back to starting point before crossing the activation barrier and reaching the transition state |
| 3 | -1.5 | -2.5 | -98.956 | Reactive | There is a trajectory in the correct direction, implying that there is a reaction occuring and to succesfully form new molecule. |
| 4 | -2.5 | -5.0 | -84.956 | Unreactive | There is a barrier recrossing - it passes through the transition state but reverts back to reactants. |
| 5 | -2.5 | -5.2 | -83.416 | Reactive | There is a trajectory in the correct direction, implying that there is a reaction occuring and to succesfully form new molecule. |
From the results, it can be concluded hat not all trajectories starting with the same positions are reactive, with higher momenta, due to having great enough kinetic energy to pass through the activation barrier, as assumed. For example, combination 2 has a higher p1 than that of combination 1, but it is found to be unreactive. Besides, one with much higher momenta, as in combination 4, does indeed has high enough kinetic energy to reach the transition state region, but the barrier was recrossed and the system reverted back.
Good. Mak214 (talk) 16:31, 23 May 2019 (BST)
Figure 7. p1 = -1.25 and p2 = -2.5
Figure 8. p1 = -1.5 and p2 = -2.0
Figure 9. p1 = -1.5 and p2 = -2.5
Figure 10. p1 = -2.5 and p2 = -5.0
Figure 11. p1 = -2.5 and p2 = -5.2
Transition State Theory
State what are the main assumptions of Transition State Theory. Given the results you have obtained, how will Transition State Theory predictions for reaction rate values compare with experimental values?
Transition State Theory was proposed as another way to account for chemical reaction rates. It is based upon that a molecular collision that leads to reaction have to pass through an intermediate state known as the transition state. Therefore to determine the reaction rate, the formation of an activated complex and the decomposition of that complex into the reaction product need to be considered. When applying transition state theory to potential energy surfaces, there are three main assumptions to be applied:
1.Separation of electronic and nuclear motions, which is equivalent Born-Oppenheimer Approximation
2. Molecular system that crossed the transition state towards the product cannot turn around to reform reactants. A
3.The reactants molecules are distributed among their states in accordance with the Maxwell-Boltzmann distribution (this should be satisfied if the system has had enough time for thermal equilibrium). [2]
The reaction rate values predicted by Transition State Theory will be smaller than that of experimental values, because it assumes that all the components are assumed to be independent.
Yes. What about the 2nd assumption? Look at your trajectories for question 4 also to illustrate your point. Mak214 (talk) 16:32, 23 May 2019 (BST)
F - H - H system
.
By inspecting the potential energy surfaces, classify the F + H2 and H + HF reactions according to their energetics (endothermic or exothermic). How does this relate to the bond strength of the chemical species involved?
From its potential energy surface shown below (figure 12), it can be seen that the trajectory is going downhill to the potential well from right to left, and that the energy decreases, indicated by from yellow (high energy region) to blue (low energy region). Therefore, the F + H2 --> HF + H reaction is exothermic. This is because H-F has greater bond strength and higher bond energy compared to H-H, hence the energy released from bond formation of H-F is greater than the energy required to break H-H.
Good. Mak214 (talk) 16:39, 23 May 2019 (BST)
Figure 12. potential energy surface plot of F + H2
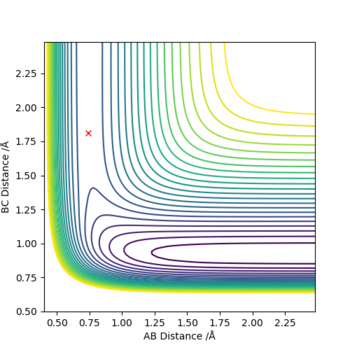
From its potential energy surface shown below (figure 13), it can be seen that the trajectory is going uphill from the potential well from left to right, and that the energy increases, indicated by from violet (lower energy region) to blue (higher energy region). Therefore, the H + HF --> H2 + F reaction is endothermic. This is because H-F has greater bond strength and higher bond energy compared to H-H, hence the energy required to break H-F bond is greater than the energy released from H-H bond formation.
Good. Mak214 (talk) 16:39, 23 May 2019 (BST)
Figure 13. potential energy surface plot of H + HF
Locate the approximate position of the transition state.
To locate the transition state position, rts the method used was the same as in H2 + H system:
For F + H2 , transition state positions were found to be r1/rHH = 0.74 Å and r2/rHF = 1.814 Å. At these positions no trajectory was observed, shown in a contour plot below (figure 14). it -103.756 -104.013
For H + HF , transition state positions were found to be r1/rHF = 1.8136 Å (or 1.814 Å corrected to 3 d.p) and r2/rHH = 0.74 Å. At these positions no trajectory was observed, shown in a contour plot below (figure 15).
Figure 14. contour plot for F + H2 and figure 15. contour plot for H + HF'
Good. Mak214 (talk) 16:39, 23 May 2019 (BST)
Report the activation energy for both reactions.
For F + H2, the activation energy is very small and it is not easy to locate the transition state. As the reaction is exothermic, it has an early transition state, i.e the energy of transition state is closer to the reactants, according to Hammon's Postulate. Therefore the system was displaced slightly away from the transition state towards the reactants, therefore r2/rHF has to be increased slightly so that the reaction reverts back to reactants. The activation energy was determined by reading off the difference in energy in a 'energy vs time' plot (figure 16).
The positions used are: r1/rHH = 0.74 Å and r2/rHF = 1.89 Å (r2 slightly greater than rts)
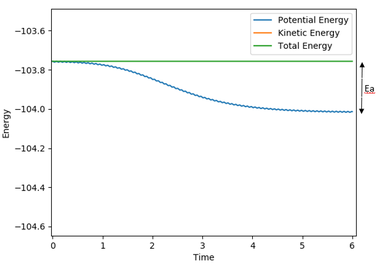 Activation energy for F + H2 = -103.756 - (-104.013) = 0.257 kJ mol-1
Figure 16. energy vs time plot for F + H2
For the reverse reaction H + HF, to determine the activation energy, the system was displaced slightly away from the transition towards the product, therefore r2/rHF has to be decreased slightly so that the reaction reverts back to reactants. The activation energy was determined by reading off the difference in energy in a 'energy vs time' plot (figure 17).
The positions used are: r1/rHH = 0.74 Å and r2/rHF = 1.807 Å (r2 slightly smaller than rts)
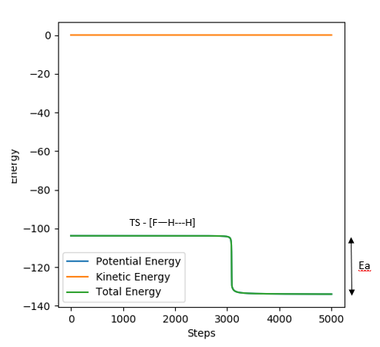 Activation energy for H + HF = -103.476 - (-133.696) = 30.22 kJ mol-1
Figure 17. energy vs time plot for H + HF
Good. Mak214 (talk) 16:39, 23 May 2019 (BST)
Reaction dynamics
In light of the fact that energy is conserved, discuss the mechanism of release of the reaction energy. Explain how this could be confirmed experimentally.
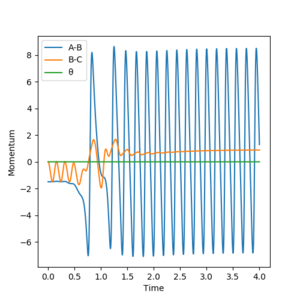
At the start of the trajectory, there is the system has high potential energy (PE) and relatively low kinetic energy (KE). But as the reaction proceeds, it gains more KE as it is given momentum, and there's vibration of the bond. Conversely PE slowly decreases. Throughout the reaction, the system oscillates between high KE and low PE to low KE and high PE, but the total energy will remain constant, as shown below (figure 18). To check this experimentally, the temperature of the system could be used to determine if the KE has increased or decreased. The same thing can also be illustrated in a momenta vs time plot, as momenta is directly related to KE. It can be seen that at the start there is a low momentum, but at a point it starts increasing and constantly varying due to vibration. (figure 19)
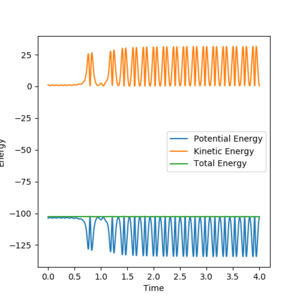 Initial conditions used: r1 = 2 Å and r2 = 0.74 Å, p1 = -1.5 and p2 = 0
Figure 18. energy vs time plot
Figure 19. momenta vs time plot
Good. Mak214 (talk) 16:39, 23 May 2019 (BST)
Discuss how the distribution of energy between different modes (translation and vibration) affect the efficiency of the reaction, and how this is influenced by the position of the transition state.
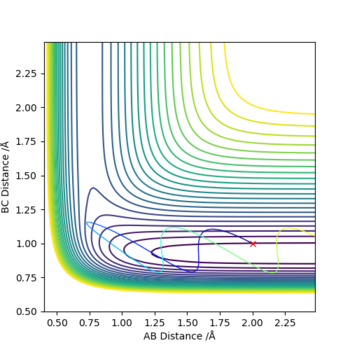 Initial conditions used: r1 = 2 Å and r2 = 1.0 Å, p1 = -1.12 and p2 = 6.7. This shows a trajectory with high translational energy. When the translation energy is high, the reaction tends to be going in reverse direction.
 Initial conditions used: r1 = 2 Å and r2 = 1.0 Å, p1 = -5 and p2 = 0.01. This shows a trajectory with high vibrational energy. When the vibrational energy is high, the reaction tends to be successful.
Polanyi's empirical rule states that when a higher vibrational energy is makes a reaction more efficiency, for a late transition state (i.e the transition state is closer to the product). This can be shown in the two examples above.
Great. A very good report, thank you.Mak214 (talk) 16:39, 23 May 2019 (BST)


