MRD:XP1117
Molecular Reaction Dynamics: Applications to Triatomic systems
Introduction
A triatomic reaction, one single atom collides to one diatomic molecule, were analysed based on the transition state and the reactivity in MATLAB. To promote a reaction, not only the energy has to be sufficient to overcome the barrier but also to be at the right vibrational modes. Two sets of reactions are investigated, including H atom with H2 molecule, and F-H-H system. By examining the potential energy surface and internuclear distances-time graphs of different trajectories, the transition state theory and Polanyi's empirical rules are discussed and confirmed.
Reaction 1: H + H2 system
In this reaction, one hydrogen atom (HA) reacts with one hydrogen molecule (HB-HC), forming the HA-HB molecule and HC.
Analysis of the transition state
The transition state is the maximum of the lowest energy pathway of the reaction in between the reactant and the product, which is also the saddle point in the potential energy surface connecting two minima (reactant and the product). The gradient (first derivative) at the minimum is 0 as well as at the transition structure, so the total gradient is 0. The second derivative is used to distinguish the minimum and the transition structure. From the trajectory of reactant and product, they are the minima of the whole potential energy surface, however, for the trajectory of the orthogonal axis, the transition state is the maximum energy, which has the negative second derivative.
(I think you forgot to mention that the second derivative is > 0 for the direction of the reaction at the TS. Je714 (talk) 10:22, 15 May 2017 (BST))
Due to the symmetry of the surface, the transition state is where the distance A-B is equal to B-C. As the transition state is where the configuration does not have the potential to move towards the reactant or the product and oscillates at the unchanged position, the momenta of A-B and B-C were both set to be 0. In the internuclear distances-time graph (Fig.1) , the best estimate of transition state is 0.908 Å.

Dynamic and MEP calculation
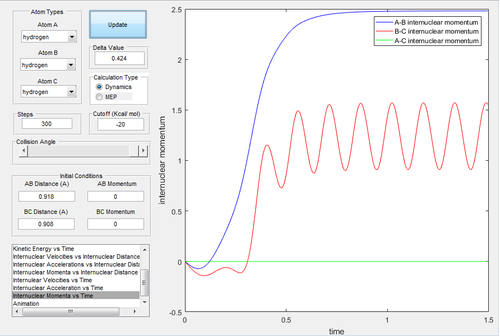
MEP, the minimum energy path, is a trajectory that setting the velocity to 0, resulting in the momenta are always 0 and no vibrational energy is taken into account. In contrast, dynamic calculation simulates the realistic situation. The initial condition was set as rBC= 0.908+ 0.01=0.918 Å, rAB=0.908 Å, with pBC=pAB=0. The initial conditions were analysed in the dynamic and MEP calculation.
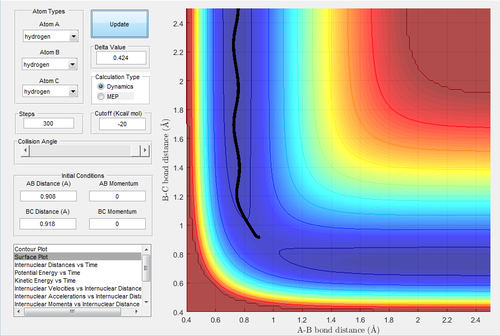
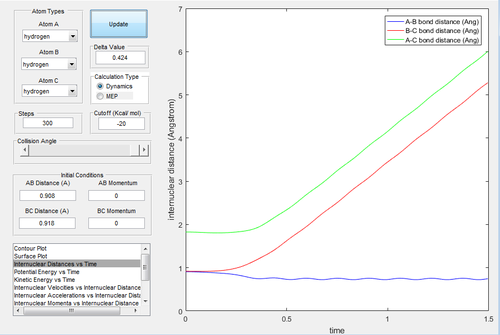
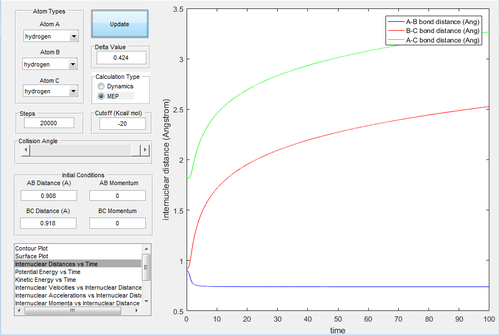
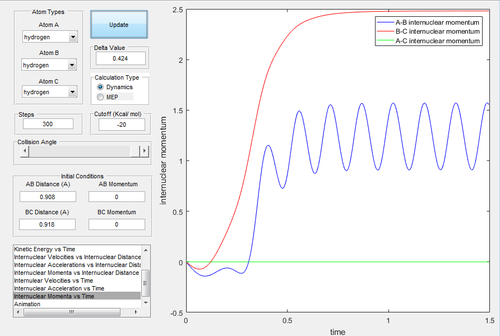
Investigating the potential energy surfaces, the MEP (Fig.3) provides a more smooth curve as the vibrational energy is not included, while the dynamic (Fig.2) shows a wavy curve due to the oscillation of molecules. For the internuclear distances-time graphs, the dynamic (Fig.4) shows the vibrations, however in the MEP (Fig.5), both curves are not wavy. Examining the internuclear momenta-time graphs, the dynamic (Fig.6) shows the vibration clearly, but no curve is shown in the MEP (Fig.7). These differences are all due to the resetting zero velocity in the MEP calculation.
If the initial condition was changed to rBC=0.908 Å,rAB=0.908+0.01=0.918 Å with unchanged momenta.
 |
 |
 |
Combining Fig.2 and Fig.8, the whole graph is the complete potential energy surface. In Fig.9 and Fig.10, the curves are swapped the positions and remained same shape.
Reactive and unreactive trajectories
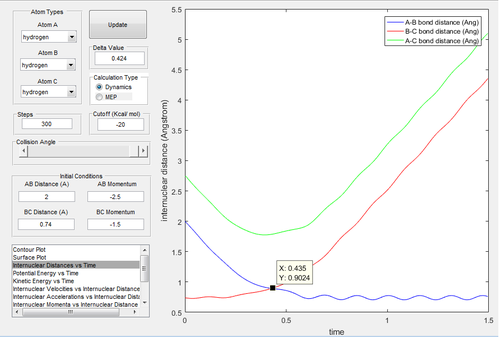
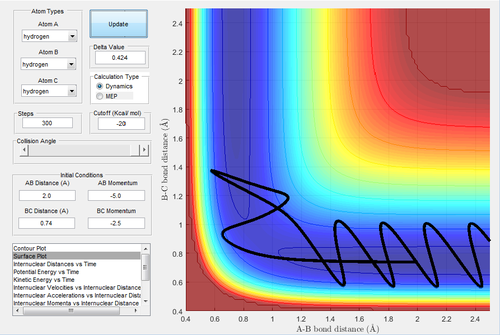
A reactive trajectory is that has enough energy to pass through the transition state and does not bounce back to reproduce the reactant. To determine the conditions of the reactive trajectories, the initial conditions were set as rBC= 0.74 Å, rAB=2.0 Å, with -1.5 < pBC < -0.8 Ns and pAB = -2.5 Ns. By varying the momenta, five trajectories were tested out to find the reactivity as shown in the following table.
| pBC | pAB | Reactivity |
|---|---|---|
| -1.25 | -2.5 | Reactive |
| -1.5 | -2.0 | Unreactive |
| -1.5 | -2.5 | Reactive |
| -2.5 | -5.0 | Unreactive |
| -2.5 | -5.2 | Reactive |
The higher the momentum, the higher the transltional energy (as all momenta are negative). Even when the sufficient energy is provided, some trajectories are not reactive.
 |
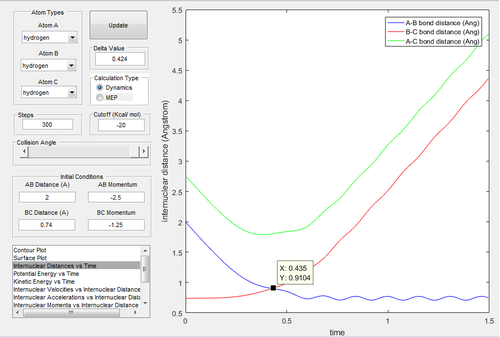 |
In Fig.11, the curve passes through the transition state and towards to the exit channel. indicating this trajectory has enough energy to overcome the activation barrier. In Fig.12, it confirms that the transition state is around 0.435 time unit.
 |
 |
The energy is not sufficient to reach the transition state in Fig.13 and Fig.14.
 |
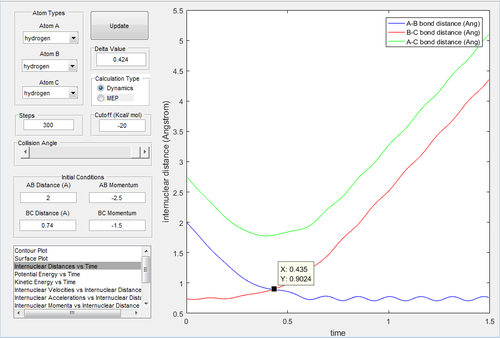 |
The results are similar to the trajectory 1.
 |
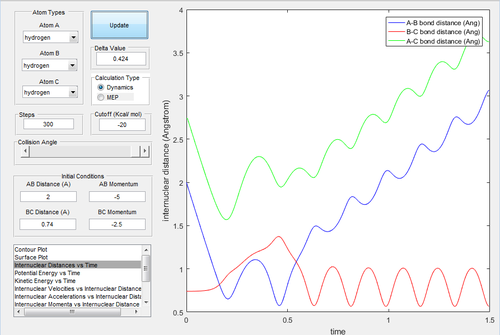 |
In Fig.17, there is sufficient energy to reach the transition state but not enough to reach the exit channel. The atom bounced back to regenerate reactant.
 |
 |
In Fig.19, although the curve bounced back to the reactant, it then have enough energy to reach the product, resulting in two transition state.
(Careful, Fig. 14 and Fig. 16 are the same (?) Fig. 14 does not correspond to Fig. 13. Otherwise good discussion. Je714 (talk) 10:26, 15 May 2017 (BST))
Transition State Theory
The transition state theory assumes that the reactant and the transition state form the "quasi-equilibrium"[1], and the reaction can go through from reactant to product or vice versa without recrossing the transtion state in classical mechanism[2]. Also, this theory is based on the Born-Oppenheimer Approximation and molecules follow the Boltzmann distribution[3]. In realistic situation (Fig.19), there is possibility that the translational energy is sufficient to reach the transition state but is towards back to the reactant and then recrossed the transition to reach the product. In this case, the predicted rate is faster than the experimental rate as it omitted the time of recrossing.
(Does the quasi-equilibrium point make sense in this exercise though? You're just looking at three atoms in isolation, not treating a statistical ensemble of them. Je714 (talk) 10:28, 15 May 2017 (BST))
Reaction 2: F-H-H system
Two reactions are analyse,
1.F + H2 systemːThe fluorine atom reacts with the hydrogen molecule to form hydrogen fluoride molecule and hydrogen atom.
2.H + HF systemːThe hydrogen atom reacts with the hydrogen fluoride molecule to form fluorine atom and hydrogen molecule.
1.F + H2 system
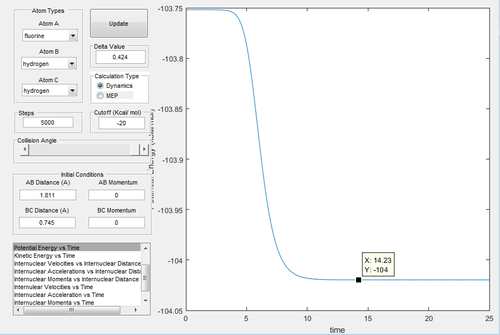
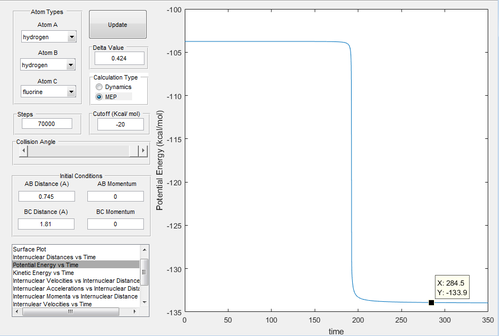
As fluorine is the most electronegative atom, the ionic character of the H-F bond is much stronger than the covalent bond H-H. Therefore the H-F bond is energetically more stable, which releases energy and the reaction is exothermic. By investigating the potential energy vs time graphs (Fig.21,22), the energy of transition state is -103.8 kcal/mol. In Fig.21, the energy of reactant H-H is -104 kcal/mol, and the activation energy of first reaction is 0.2 kcal/mol. In Fig.22, the energy of reactant H-F is -133.9 kcal/mol, and the activation energy of second reaction is 30.1 kcal/mol. According to the Hammond postulate[4], the exothermic reaction is when the transtition state is similar to the reactant, and the endothermic reaction is when the transition state is similar to the product. In this reaction, the transition state has the closer energy to the reactant, therefore it confirms that it is exothermic.
As the surface plot is not symmetrical, the distance is not same this time. The momenta are both set to 0 and then to find the transition state. The estimate of transition state is rH-H=0.745 Å and rH-F=1.811 Å.
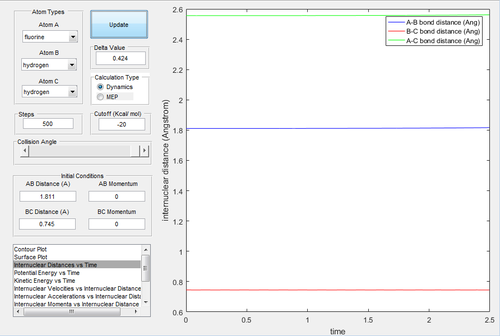
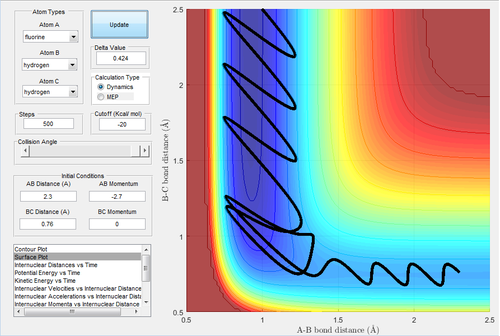
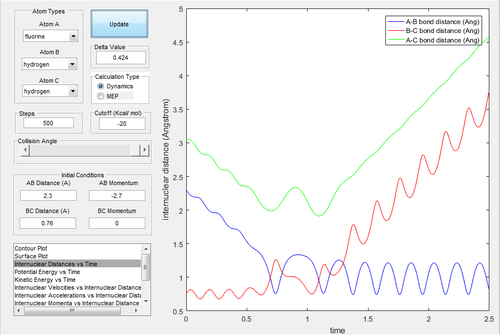
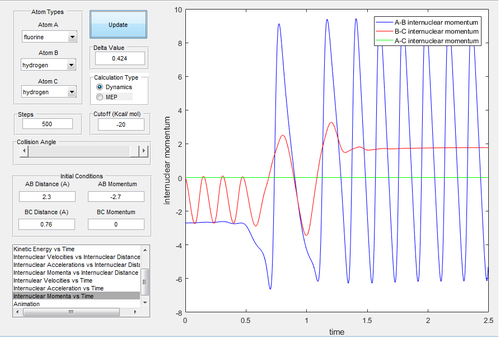
An initial condition is set up as rH-H=0.76 Å and rH-F=2.3 Å, with pH-H=0 and pH-F=-2.7 Ns to investigate the mechanism of the reaction.
By investigating the Fig.24, 25 and 26, the mechanism of this reaction is processed via two steps. The first step is when F atom approaches to the hydrogen molecule, the H-F distance reduces and the first transition state is reached. Nevertheless, the F atom bounces back and the H-F distance increases due to the lack of translational energy to overcome the activation barrier. In the next step, the F atoms attacks again and reaches the second transition state. As the reaction is exothermic, the thermal energy released is converted to the vibrational energy of the H-F bond. IR spectroscopy is able to detect the vibrational energy. In a closed system, the energy released can be calculated by Q=cmΔT, where Q is the thermal energy, c is the heat capacity, m is the mass and ΔT is the change in temperature which can be measured before and after the reaction by thermometer.
(Good calorimetry discussion. Wish you gave the same detail for the IR spectroscopy suggestion (just how exactly you would monitor the reaction with it?). Je714 (talk) 10:33, 15 May 2017 (BST))
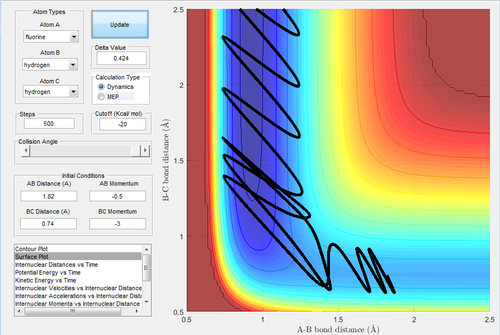
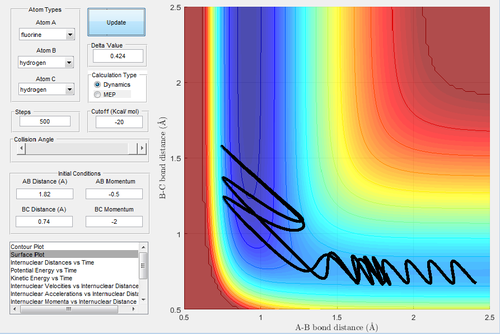
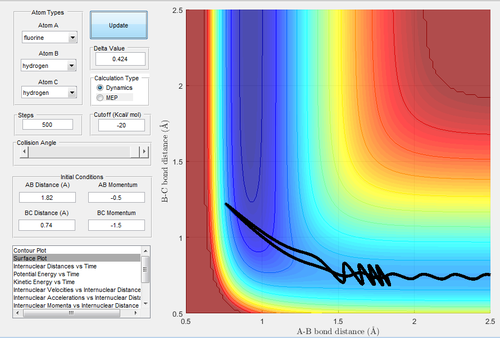
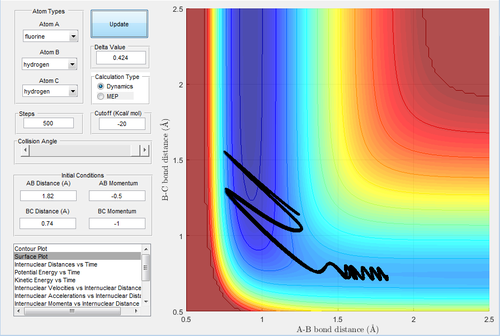
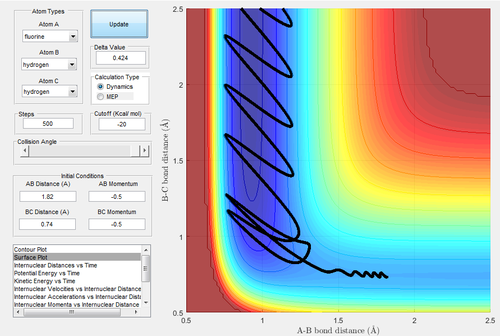
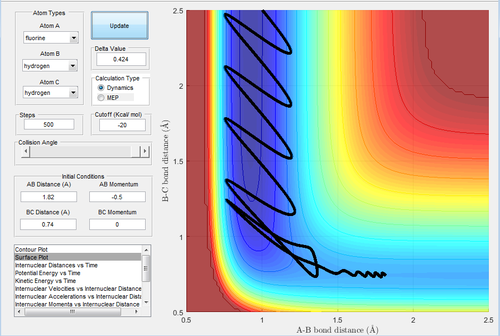
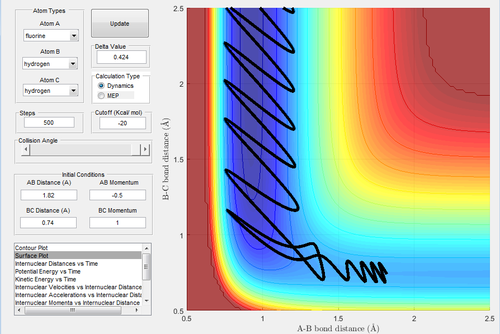
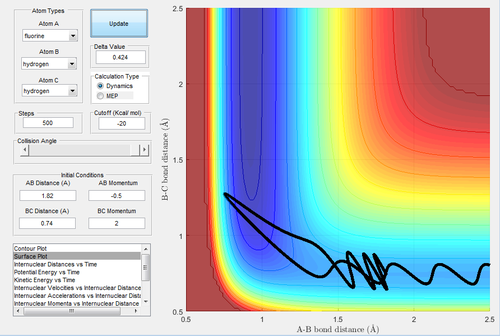
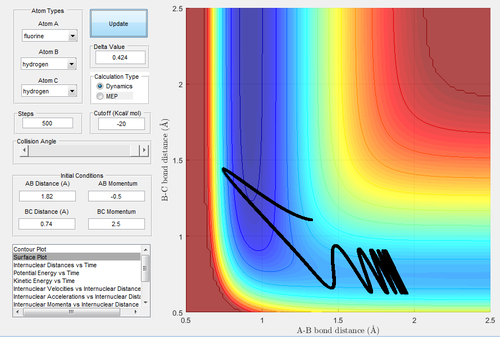
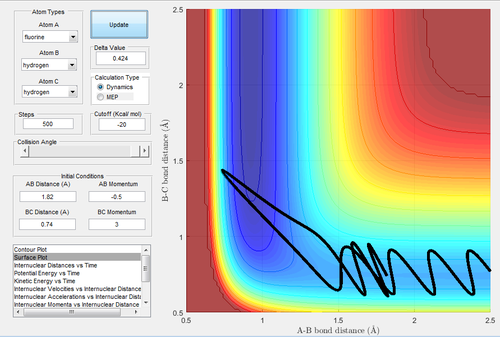
The initial conditions are set up as rH-F=1.82 Å and rH-H=0.74 Å, with pH-F=-0.5 Ns and -3≤pH-H≤3 Ns. The reactivity is shown in Table.2.
| pHH | -3.0 | -2.5 | -2.0 | -1.5 | -1.0 | -0.5 | 0.0 | 0.5 | 1.0 | 1.5 | 2.0 | 2.5 | 3.0 |
|---|---|---|---|---|---|---|---|---|---|---|---|---|---|
| Reactivity | Reactive | Unreactive | Unreactive | Unreactive | Unreactive | Reactive | Reactive | Reactive | Reactive | Reactive | Unreactive | Unreactive | Unreactive |
Although the activation energy for this reaction is low and sufficient energy provided to H-H bond, there are still some trajectories not reactive.
The initial is unchanged, but the pH-F increases slightly,-0.8 Ns and pH-H=0.1 NS.
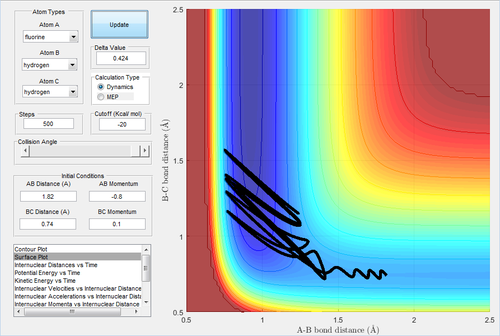
The energy is sufficient to reach the transition state but not the product, which is unreactive. The reactivity of one trajectory is not dominant by one of the momenta, therefore it is also important to adjust the momentum of H-H.
2.H + HF system
The H-F bond is stronger than the H-H bond so the reactant is more energetically stable. As the activation energy calculated before (Fig.23 and Fig.24), the transition state has the similar energy to the product, which is considered as endothermic.
The estimate of transition state is rH-F=1.811 Å and rH-H=0.745 Å.
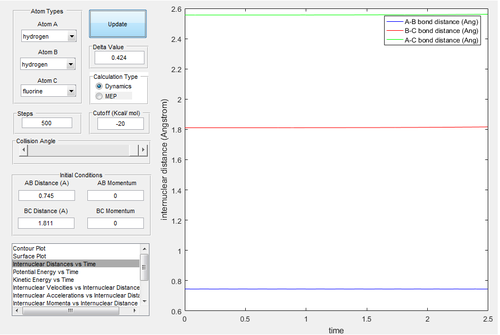
Polanyi's empirical rules state that in the late-barrier reaction (the transition state is product-like), the vibrational energy has a larger contribution to promote the reaction than translational energy[5]. For the early-barrier reaction, the translational energy is more efficient.
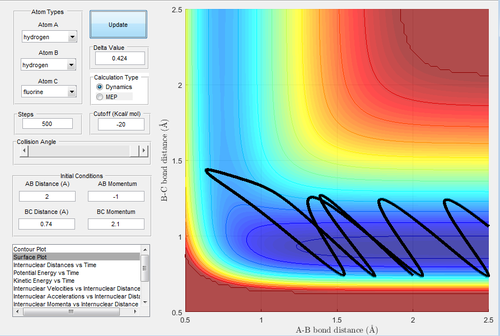
The initial conditions are rH-H=2 Å and rH-F=0.74 Å, with pH-H=-1 Ns and pH-F=2.1 Ns.
 |
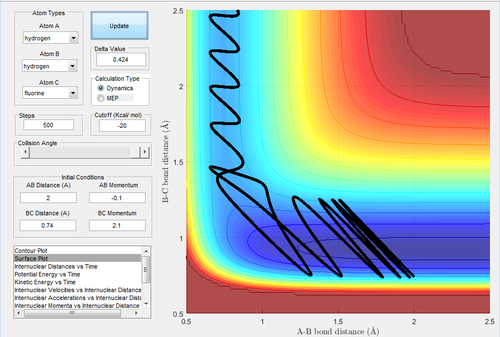 |
In Fig.42, the setup is the low vibrational energy and high translational energy. As this reaction is an endothermic reaction, the transition state is similar and closer to the product. This trajectory is unreactive. Then the momentum of H-H (Fig.43) is changed to -0.1 Ns. This is the setup of high vibrational energy and low translational energy. Decreasing the translational energy give rise to a reactive trajectory, which confirms the rules.
Conclusion
For a triatomic reaction, the transition state can be estimated approximately and the reactivity can be identified in the potential energy surface. Polanyi's empirical rules are confirmed by different trajectories.
Reference
- ↑ K. J. Laidler and M. C. King, J. Phys. Chem., 1983, 87, 2657–2664.
- ↑ P. Pechukas, Annu. Rev. Phys. Chem. 1981.32:159-177.
- ↑ R. J. Silbey, R. A. Alberty, M. G. Bawendi, Physical Chemistry, 4th ed., John Wiley & Sons, 2005.
- ↑ M. Solà and A. Toro-Labbé, J. Phys. Chem. A, 1999, 103, 8847–8852
- ↑ J. M. Bowman, J. Phys. Chem. Lett., vol. 4, pp. 4–7, 2012.

