MRD:WhoKnewThreeAtomsCouldBeSoComplicated
Molecular Reaction Dynamics of Triatomic Systems
Introduction
LEPS GUI software was used to model the molecular reaction dynamics of two systems: H + H2 and F - H - H. Reactions were modeled to answer specific questions in each case
Hydrogen Models
Question 1
"What value do the different components of the gradient of the potential energy surface have at a minimum and at a transition structure? Briefly explain how minima and transition structures can be distinguished using the curvature of the potential energy surface."
Gradients of a potential energy plot provide a lot of information. There are three distinct ways in which the gradient can be used to ascertain chemical information:
- At maxima the gradient is zero. On the minimum energy pathway, the maxima also shows the point of the transition state; from which products may be formed or the reaction may return to reactants. To which outcome the reaction tends is defined by the steepness of the gradient to either result, with the steepest gradient (thus the lowest energy pathway) tending to be the path followed. Hence, a useful metaphor is to think of the transition state as the crest of a hill, down which a ball (the reaction) may roll; it is most likely to roll down the steepest slope. Maxima can be defined by their second differential, which is always negative.
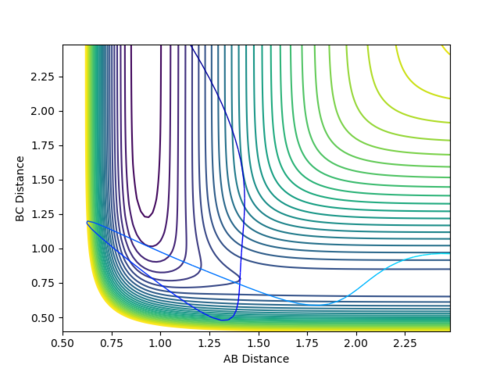
- At minima the gradient is also zero. On the potential energy surface, the minima are the lowest energy points of the system and represent the most stable state the system can be in. Thermodynamically, these tend to be "local" minima - stable system states that are at a minima due to high activation energy barriers on either side. Minima have a gradient of zero like maxima, but their second differential is always positive.
- In-between maxima and minima the gradient varies. The magnitude of the gradient shows how quickly the energies increase / decrease with increasing r.
Thus, to distinguish between maxima and minima, use the second differential.
Ng611 (talk) 20:08, 24 May 2018 (BST) What about saddle points? These are the most important feature when assessing transition states. You've included a correct diagram below, but you should also mention it here.
Question 2
"Report your best estimate of the transition state position (rts) and explain your reasoning illustrating it with a “Internuclear Distances vs Time” plot for a relevant trajectory."
To find the transition state position, the momenta of AB and BC were set to be zero. The bond distances were also set to be equal and varied until the transition state position was found. As this was done by trial and error, the value is only an estimate.
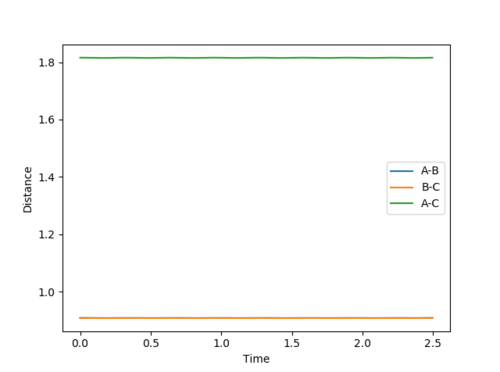
The transition state position was found to be at 0.908 pm , as this was the point at which there is no visable fluxuation of motion in the Internuclear Distances vs Time plot, shown below:
Question 3
"Comment on how the mep and the trajectory you just calculated differ."
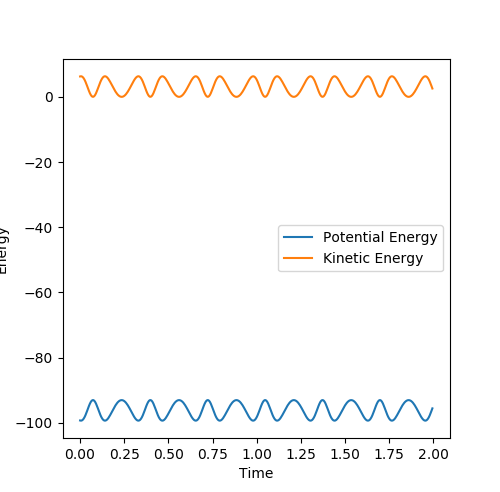
The Energy vs. Time graphs for the MEP and Dynamic trajectories are shown below. There are two key differences between the MEP and the dynamic trajectory:
- The potential energy of the MEP is stable: a constant value of about 100 Kcal/mol. The MEP model shows no oscillatory behavior, hence is shown as a straight line. In contrast, the dynamic trajectory has a varying potential energy. This is due to the fact that the dynamic model takes into account the vibrations of the molecules.
- The kinetic energy of the MEP is zero, whereas in the dynamic trajectory this is also fluxuating. This is again due to the molecular vibrations of the molecules. As the molecules are constantly in motion, their kinetic energy varies about a non-zero mean over time
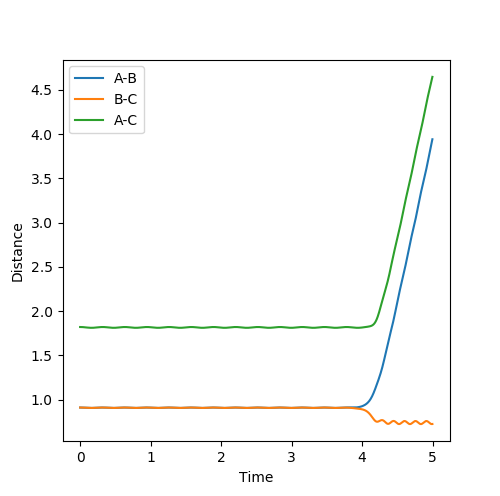
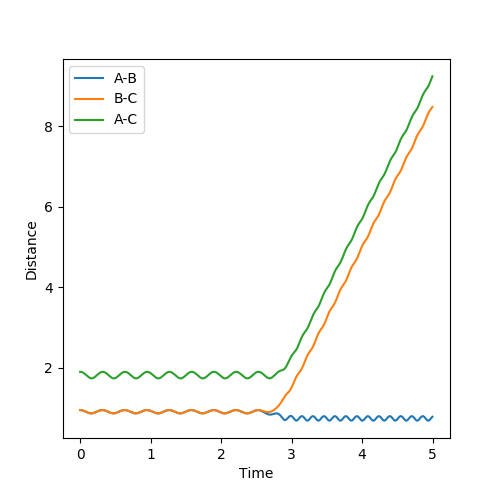
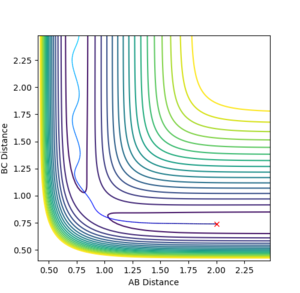
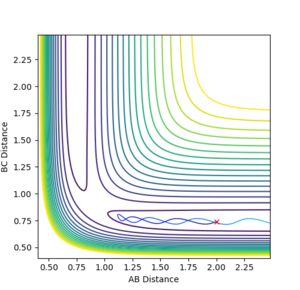
Looking at the Internuclear Distances vs. Time plot shows that although these distances are close to the transition state, they are not exact as after sufficient time, the reaction continues:
In the first case, the internuclear distances increase rapidly after 4 s, and it is atom A that is not included in the molecule formation. If the AB/BC distances are increased to 0.95, it is atom C that is excluded and the molecule is formed from A and B (shown in the second graph). This shows that the estimated TS is to one side of the real value. For the true transition state, the internuclear distances would not change over time as at the maxima that represents the TS, the gradient is zero:
Question 4
"Complete the table by adding a column with the total energy, and another column reporting if the trajectory is reactive or unreactive. For each set of initial conditions, provide a plot of the trajectory and a small description for what happens along the trajectory."
| p1 | p2 | Energy (Kcal/mol) | Plot | Info |
|---|---|---|---|---|
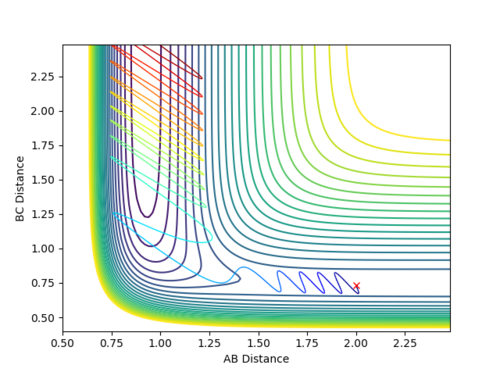
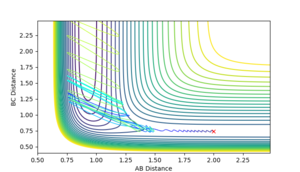
| -1.25 | -2.5 | -99.018 | The plot shows a reactive pathway. The AB distance gradually decreases from the reactant channel to the transition state, where the BC distance starts to increase. After the transition state period, BC distance increases, showing that the new molecule has been formed as the trajectory leads out of the product channel. | |
| -1.5 | -2.0 | -100.456 | The plot shows an unreactive pathway. The AB distance decreases in approach to the transition state region, but then increases again back down the reactant channel. This suggests that the atom and the molecule collide but ricochet off one another as oppose to reacting. The energy is lower than the reaction above, showing that there is insufficient energy for a reaction. | |
| -1.5 | -2.5 | 98.956 | The plot shows a reactive pathway. Again, the AB distance gradually decreases from the reactant channel to the transition state, where the BC distance starts to increase. After the transition state period, BC distance increases, showing that the new molecule has been formed as the trajectory leads out of the product channel. | |
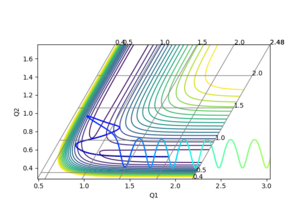
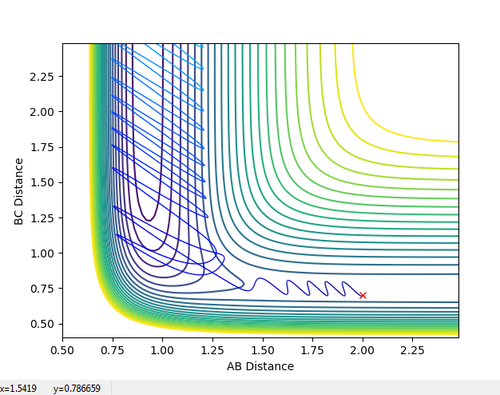
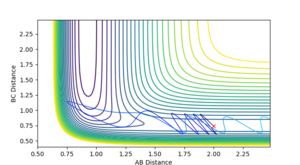
| -2.5 | -5.0 | -84.956 | The plot shows an unreactive pathway as the reactants remain the same at the end. However, the reaction in the middle is more interesting than that of reaction 2 and is better explained by a skew plot. In this case, the reactants have so much energy that they shoot into the transition state region and make it some way up the product channel. They have so much energy, however, that they hit the walls of the products channel, recross the transition state region and roll back down the reactants channel. In the skew plot, the forces are orthogonal to the lines of the channel and it can be seen that at the moment of the molecule traveling up the product channel, the orthogonal direction of action will force the molecule back to the reactant channel. The emitted molecule has a lot of energy, as can be seen by the magnitude of its vibrations. | |
| -2.5 | -5.2 | -83.416 | The plot shows a reactive pathway. Similarly to the plot above, the system has a high energy. The reactants undergo two changes of direction however; they have so much momentum, that the reactants start to follow the trajectory back down the reactant channel but are repelled back down the product channel by the steepness of the walls. |
Question 5
"State what are the main assumptions of Transition State Theory. Given the results you have obtained, how will Transition State Theory predictions for reaction rate values compare with experimental values?"
Five assumptions of Transition State Theory are:
- Molecular systems that have gone over the transition state towards products cannot go back to reform the reactants
- In the transition state, motion along the reaction coordinate can be separated from all other motion and treated classically as translation
- In the absence of equilibrium between reactants and products, the transition states becoming products are distributed among their states according to the Maxwell-Boltzmann laws
- The electronic and nuclear motions are separated (Born-Oppenheimer)
- Reactant molecules are distributed among their states in accordance with Maxwell-Boltzmann distribution
[Ref. JI Steinfeld, JS Francisco, Chemical Kinetics and Dynamics, WL Hase - 1989]
The simulated reactions above go some way to show that the above points are assumptions. The first point in particular is quickly disproved by reaction 4, which goes over the transition state and then back to reform the reactants. The fact the trajectory isn't straight in the transition periods of successful reactions also suggests that there is more than translation occurring, as suggested by point 2.
F-H-H Models
Question 1
"Classify the F + H2 and H + HF reactions according to their energetics (endothermic or exothermic). How does this relate to the bond strength of the chemical species involved?"
F + H2
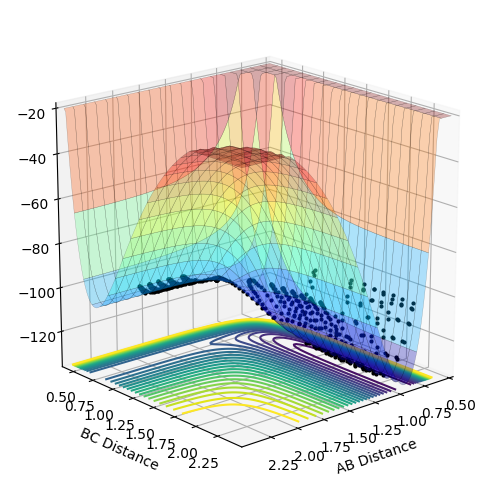
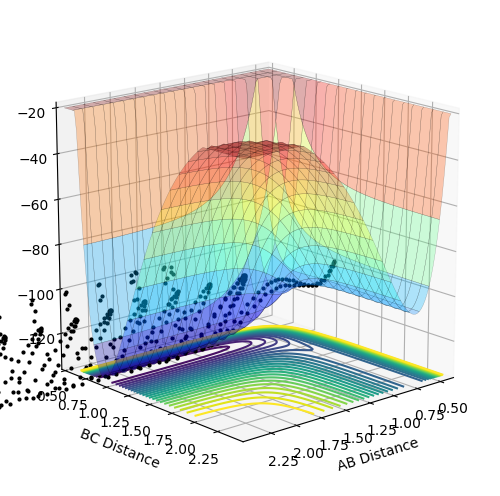
The reaction of F and H2 is exothermic as shown by the surface plot of the reaction. The products have a lower energy than the reactants; a hallmark of exothermic reactions.
A is the fluorine atom and BC is the hydrogen molecule. The reaction does not require very much momentum to proceed, adding credence to the conclusion that it is the exothermic reaction. The contour plot for the reaction can be seen below (AB momentum = -1, BC momentum = -2)
H + HF
The reaction of HF and F is endothermic as the reactants have lower energy than the products. This again can be seen in the surface plot of the reaction:
This is clearly the endothermic reaction as for the same momenta conditions, the reaction does not proceed:
'Bond Strengths'
Thus, it is clear from the above that if the reaction of F and H2 is exothermic then the formation of the HF bond is favorable. This is reinforced by mean bond energy (MBE) data: the H-H bond has an MBE of 103.3 kcal/mol whereas the H-F bond has an MBE of 135.0 kcal/mol.
Question 2
"Locate the approximate position of the transition state."
| H-F | H-H |
|---|---|
| 1.8107 | 0.7450 |
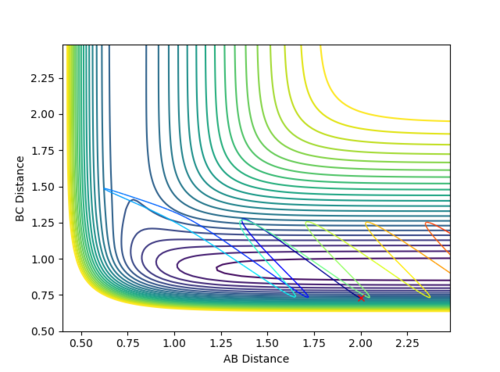
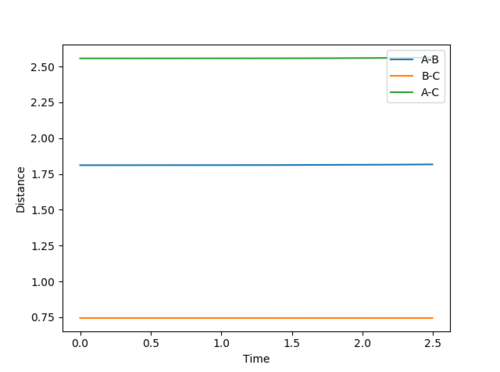
This was estimated by the same method as above: the momenta were each set to zero and the H-H and H-F distances were varied until the Internuclear Distance vs. Time graph showed minimal fluctuation. However, as the reaction is no longer balanced, the H-H and H-F distances would not be equal. Estimates for the position of the transition state were taken from a preliminary trajectory in the test phase (below). This showed the H-F distance would be above 1.5 and the H-H distance would be around 0.8:
The estimated transition was then confimed by the Internuclear Distance vs. Time graph, which can be seen below:
Question 3
"Report the activation energy for both reactions."
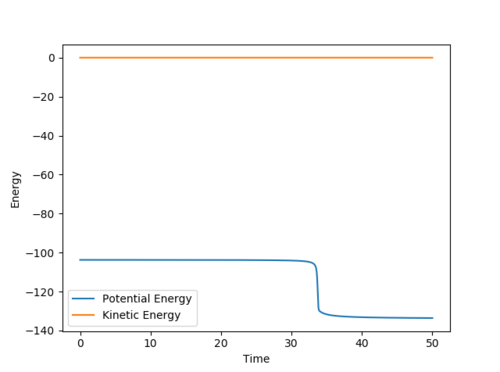
To calculate the activation energies, an MEP profile with 10,000 steps was generated from the transition state, with slight perterbations to the initial F-H or H-H distances. From this, an Energy vs. Time graph was plotted. The point at which the potential energy changes was found; from this the activation energy was calculated. The transition state has an energy of -103.752 kcal/mol (relative to the vacuum). The difference between this and the reactants was used to calculate the activation energy.
F + H2 → H + FH
The Energy vs Time plot:
From this plot (zoomed in, showing only the potential energy) the final state can be seen to have an energy of -104.0195 kcal/mol. The difference between this value and the energy of the transition state gives the activation energy: 0.2675 kcal/mol.
FH + H → F + H2
The Energy vs Time plot:
From this plot the final state can be seen to have an energy of -133.760 kcal/mol. The difference between this value and the energy of the transition state gives the activation energy: 30.008 kcal/mol.
Thus, it is clear to see that the reaction strongly favours the formation of FH + H, as it has a significantly lower activation energy.
Question 4
"In light of the fact that energy is conserved, discuss the mechanism of release of the reaction energy. How could this be confirmed experimentally?"
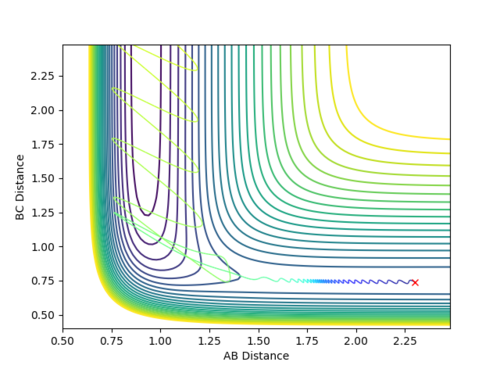
As H2 is a well known molecule, the known bond length was set: 0.74 angstroms. The F atom was placed 2.3 angstroms away. The momenta were set to -0.7 (F-H) and -0.1 (H-H) units and a successful reaction occurred, as can be seen below.
The reaction is highly favoured, as can be seen by the fact that it proceeded even with very low relative momenta. The Internuclear Momenta vs. Time plot is shown below:
Kinetic energy has two components: translational and vibratinal energies. The H2 molecule is very small, so most of its kinetic energy is in the form of translational energy, as its molecular vibrations are relatively small. The F atom shows all it's kinetic energy as translational, as being mono-atomic it cannot vibrate.
As the two collide, energy is conserved by the conversion of potential to kinetic energy; the F-H molecule is highly favoured. The F-H molecule vibrates much more strongly than the H2 molecule. This can be seen by the significantly larger oscillations in the Internuclear Momenta vs. Time plot and in the contour plot.
This in silico prediction could be tested experimentally by time-resolved IR of the reaction.
Ng611 (talk) 20:12, 24 May 2018 (BST) Time-resolved IR is an interesting choice. What would you expect to see?
Question 5
"Discuss how the distribution of energy between different modes (translation and vibration) affect the efficiency of the reaction, and how this is influenced by the position of the transition state."
Polanyi rules assert that "vibrational energy is more efficinet in promoting a late-barrier reaction than translational energy."
[Ref. Z. Zhang, et al, J. Phys. Chem. Lett., 2012, 3 (23), pp 3416–3419]
As we have seen, the F + H2 reaction has a very early transition state. This means, according to Hammond's Postulate, that the transition state closely resembles the reactants. As a result, any increase in the vibrational energy of the H-H bond will not necessarily increase the likeliness of a reaction being successful (as can be seen in the table below).
A reaction starting from: rHH = 0.74 A, rHF = 2.0, pFH = -0.5 was undertaken, with varying momenta values of pHH
| pHH | Energy (Kcal/mol) | Plot | Explanation |
|---|---|---|---|
| -3 | -96.159 | The contour plot shows an unreactive trajectory, with the H2 molecule hitting the F atom with too much energy and ricocheting off back down the reactant channel. | |
| -2 | -100.659 | The contour plot shows a reactive trajectory, with the trajectory leading through the reactant channel to the transition state region and out through the product channel. | |
| -1 | -103.159 | The contour plot shows an unreactive trajectory, with the trajectory crossing the transition state region but then recrossing after entering the product channel at an unfavourable angle. As a result, the reaction leads back to the reactant channel. | |
| 0 | -103.659 | The contour plot shows a reactive trajectory. It leads through from the reactants channel over the transition state region. It then recrosses several times before eventually leading to the product channel. | |
| 1 | -102.159 | The contour plot shows a reactive trajectory. Again, it leads through from the reactants channel over the transition state region. It recrosses several times before eventually leading to the product channel. | |
| 2 | -98.659 | The contour plot shows another reactive trajectory. Again, it leads through from the reactants channel over the transition state region. It recrosses several times before eventually leading to the product channel. | |
| 3 | -93.159 | The contour plot shows an unreactive trajectory. Again, it leads through from the reactants channel over the transition state region but very quickly recrosses, leading back down the reactant channel. |
Thus, it can be seen that increasing the momentum of H-H does not necessarily increase the likelihood of a successful reaction. Thus, translation energy will be the bigger factor.
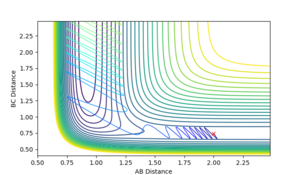
Conversely, the FH + H reaction has a late transition state, again implying that it more closely resembles the products (which one would expect from a reversible reaction!). Hence, the Polanyi rules suggest that increasing the vibrational energy will be a more efficient driving force than translational energy. This can be seen in the two contour plots below:
Translational Energy Increased:
Ng611 (talk) 20:15, 24 May 2018 (BST) This really is an excessive amount of translational energy!
Vibrational Energy Increased:
Here it took a value of -12 units of momentum in translational energy to result in a reactive trajectory (ie; a fast moving H atom colliding with the HF molecule to react). As predicted, it only took -10 units of momentum in vibrational energy to result in a reactive trajectory (ie; increasing the vibrational energy of the HF bond, while keeping the speed of the approaching H atom to a minimum, leading to a high energy species that is easier to react with). Thus, the in silico reaction proved the Polanyi rules.
Ng611 (talk) 20:15, 24 May 2018 (BST) Good! Remember that polanyi's rules are 'guidelines', rather than concrete rules. Overall, a good report!

