MRD:WXY0119
Molecular Reaction Dynamics Report
EXERCISE 1ː H + H2 SYSTEM
In the H + H2 system, the distance between the first two H atoms (m1, m2) is r1 and the distance between the two H atoms in the H2 molecule (m2, m3) is r2.
Dynamics from the transition state region
Question 1 ː What value do the different components of the gradient of the potential energy surface have at a minimum and at a transition structure? Briefly explain how minima and transition structures can be distinguished using the curvature of the potential energy surface.
|

|

|
| Figure.1 Surface plot of reaction trajectory | Figure.2 Transition state surface plot | Figure.3 Transition state surface plot (different angle) |
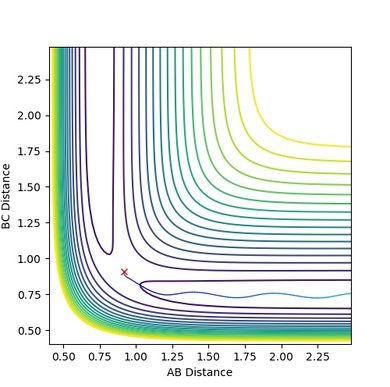
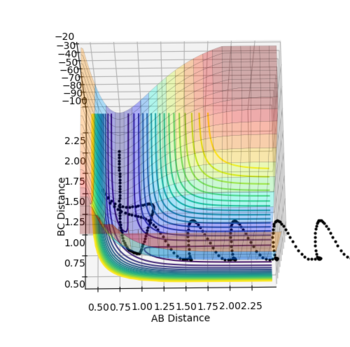
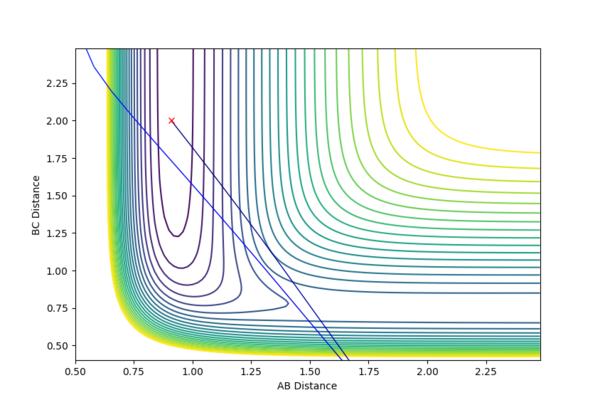
In the reaction trajectory surface plot (Fig.1), AB is the distance r1 and BC is the distance r2. The gradient of the potential energy with regard to r1 and r2 are ∂V(r1)/∂r1 and ∂V(r2)/∂r2 respectively. The second derivatives of the potential energy with regard to r1 and r2 are ∂2V(r1)/∂r12 and ∂2V(r2)/∂r22 respectively.
At the two minimum structures which are at the two ends of the reaction pathway, ∂V(r1)/∂r1 = 0 and ∂V(r2)/∂r2 = 0 respectively. Since the two minimum structures are at two local minimum point , the second derivatives ∂2V(r1)/∂r12 and ∂2V(r2)/∂r22 are both greater than zero.
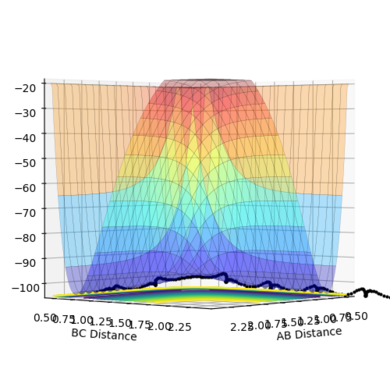
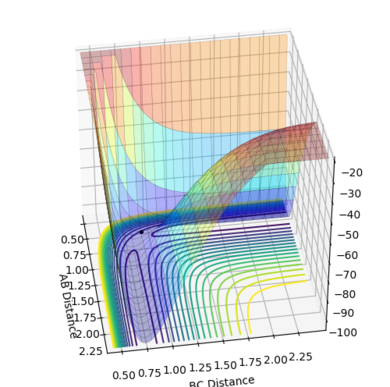
On the other hand, the components at the transition state structure (Fig.2) are different from that at minimum points. The gradient ∂V(r1)/∂r1 and ∂V(r2)/∂r2 are both equal to zero at the transition structure. However, ∂2V(r1)/∂r12 >0 and ∂2V(r2)/∂r22 <0. The transition state point is actually a saddle point which is observed more clearly in Fig.3. The Transition state point is thus distinguished from the minimum points as the potential energy surface curves inwards and downwards at the minimum points.
Mm10114 (talk) 15:45, 29 May 2018 (BST) Nice and clear.
Locating the Transition State
Question 2ː Report your best estimate of the transition state position (rts) and explain your reasoning illustrating it with a “Internuclear Distances vs Time” plot for a relevant trajectory.
|
|
|
| Figure.4 Transition state contour plot | Figure.5 Transition state surface plot | Figure.6 Internuclear distance against time plot |
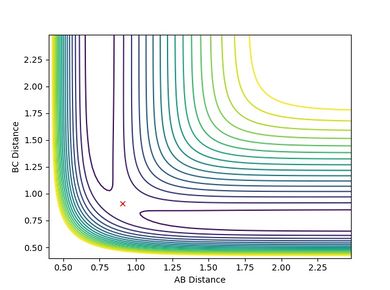
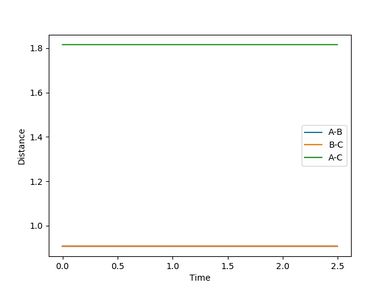
The best estimate of the transition state position is rts = 0.9078 Å.
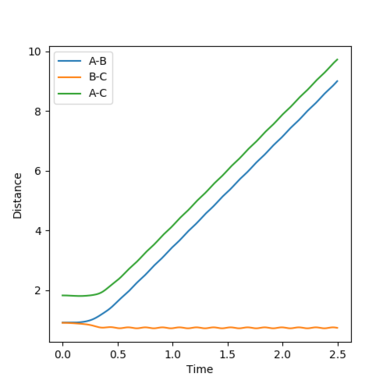
When r1 = r2 = rts and momenta are set to zero, a graph of intermolecular distance against time is plotted. (Fig.6) In this graph, AB and BC lines are the same and overlap, the two lines on the graph are flat and horizontal, indicating that the atomic distances are the same at the position and with no momenta the state is at equilibrium, validating the position is the transition state position. The transition state is shown as a cross on the counter plot (Fig.4) and a dot on the surface plot (Fig.5).
Mm10114 (talk) 15:48, 29 May 2018 (BST) Nicely done. Just worth thinking through: Would you expect the “Internuclear Distances vs Time” plot to stay the same if you would considerably increase the length of the simulation (number of steps)? Why/Why not?
Calculating and comparing the reaction path and trajectory
Question 3ː Comment on how the mep and the trajectory you just calculated differ.
|

|
| Figure.13 Dynamics calculation internuclear momenta against time plot | Figure.14 mep calculation internuclear momenta against time plotsurface plot |
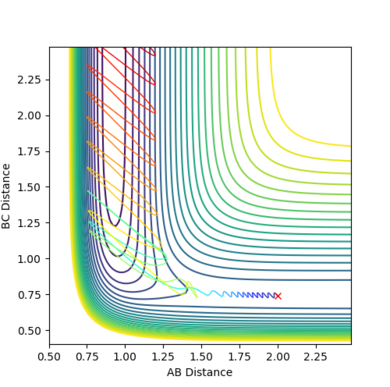
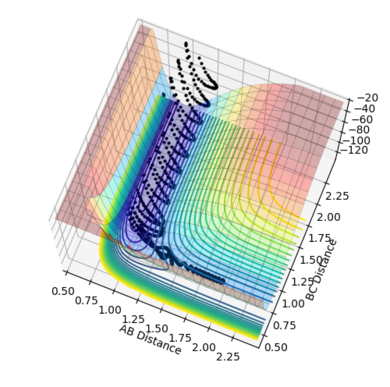
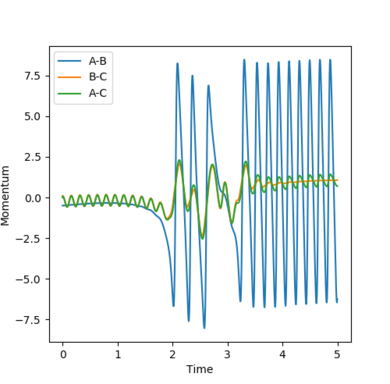
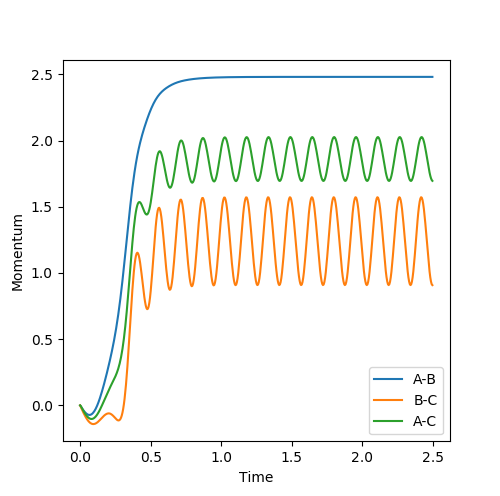
The mep (minimum energy path) trajectory is a smooth line on contour and surface plot (Fig.7 Fig.8) while the trajectory under dynamics calculation is oscillating along the pathway. (Fig.10 Fig.11) The mep trajectory takes more steps and longer time than the dynamics trajectory as shown in internuclear distance against time plots. (Fig. 9 Fig.12) The momentum is zero all the time under mep calculation (Fig.13) but under dynamics calculation, the momenta lines are oscillating against time.
The differences arise from mep and dynamics calculations can be explained by the the natures of the two calculations. Under mep calculation, the atoms are in extremely slow motion and the momentum is zero for each step, i.e. the atoms are "stop" after every step. The pathway under mep calculation is formed by connecting all the minimum energy points of each step and appears as a smooth line. On the other hand, atoms are in continuous motion and the momentum is accumulated after each step, atoms are then oscillating on the potential energy surface along the pathway. The steps are set to 5000 in the mep calculation but are only 500 in the dynamics calculatoin. Since the steps in mep are small, more time is needed to complete the same length on the trajectories.
Mm10114 (talk) 15:50, 29 May 2018 (BST) Very thorough explanation supported by all the necessary figures. It is clear you understand very well the difference.
Reactive and unreactive trajectories
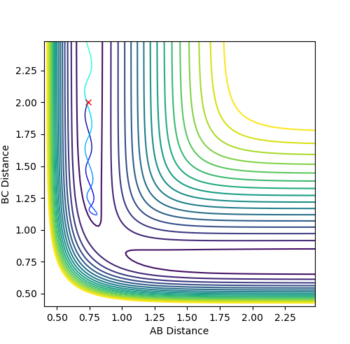
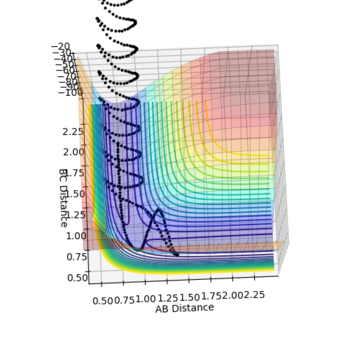
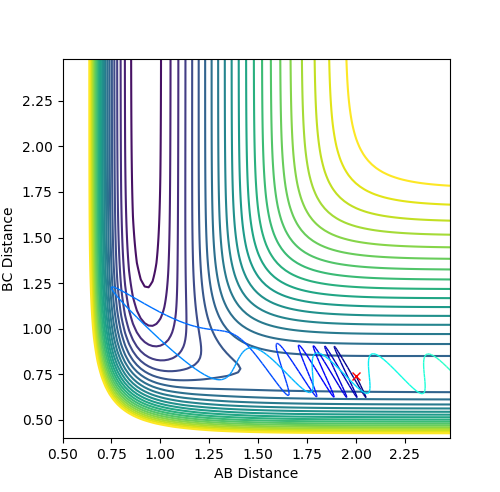
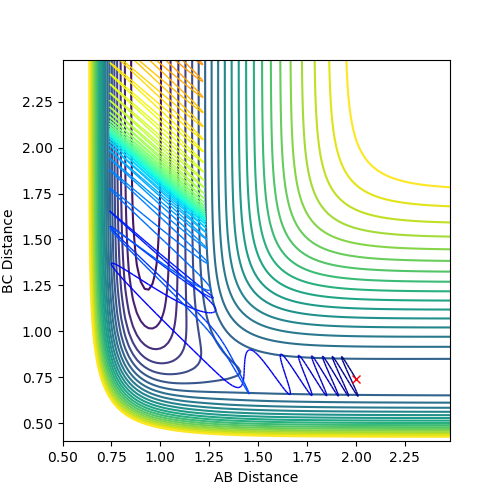
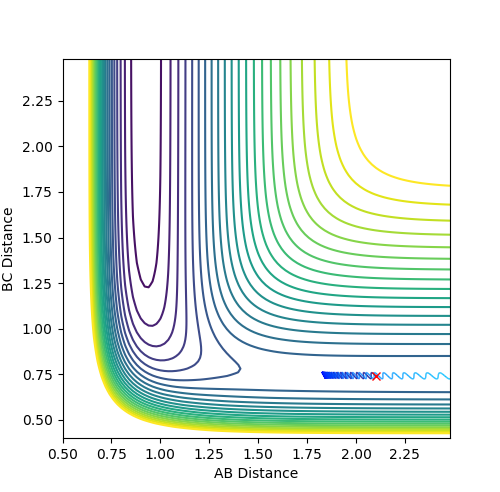
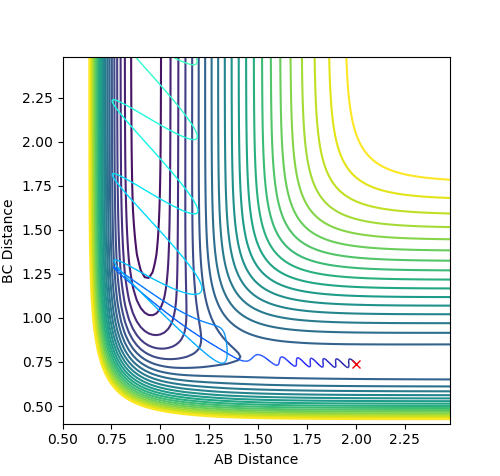
Question 4ː Complete the table by adding a column with the total energy, and another column reporting if the trajectory is reactive or unreactive. For each set of initial conditions, provide a plot of the trajectory and a small description for what happens along the trajectory.
For the initial positions r1 = 0.74 and r2 = 2.0, run trajectories with the following momenta p1 and p2 combinations:
| Condition | p1 | p2 | Total Energy/ kcal mol -1 | Reactivity |
| 1. | -1.25 | -2.5 | -99.018 | reactive |
| 2. | -1.5 | -2.0 | -100.456 | unreactive |
| 3. | -1.5 | -2.5 | -98.956 | reactive |
| 4. | -2.5 | -5.0 | -84.956 | unreactive |
| 5. | -2.5 | -5.2 | -83.416 | reactive |
Mm10114 (talk) 15:52, 29 May 2018 (BST) So what would be the final conclusion? Does high momenta guarantee a reactive outcome? Otherwise, you did a good job.
Transition State Theory
Question 5ː State what are the main assumptions of Transition State Theory. Given the results you have obtained, how will Transition State Theory predictions for reaction rate values compare with experimental values?
The main assumptions of Transition State Theory (TST) are[1]ː
1. The behaviours of the atomic nuclei follow the classical mechanics rules, i.e. the transition structure is formed as long as atoms or molecules collide with enough energy.
2. The intermediates have a long enough lifetime for the energies to be Boltzmann distributed preceding the next step.
3. The lowest energy saddle point on the potential energy surface is passed over in the reaction system.
The TST does not take into account of the quantum tunnelling effect which allows reactions to happen even when the energy carried by the system is lower than the activation energy barrier, especially for reactions with low energy barriers. Nor does the theory consider the intermediates with short lifetimes. When the energies are not fully distributed, the momentum of the reaction trajectory from the reactants to the intermediate can have effects on product selectivity. Moreover, the theory fails at high temperature because higher vibrational energy modes can be populated for a molecule at high temperature. The molecules can have complex motion and their collisions may result in a higher energy transition structure. The experimental results may thus deviate from that predicted by the TST. For example in condition 4, the kinetic energy of the reactants is much higher than the activation energy required. However, the momenta between atoms are very high and higher vibrational modes are populated that result in higher energy transition structures formed and the system does not pass though the lowest transition saddle point as shown in the diagram. Barrier recrossing occurs but the products are not formed as opposed to the predictions by the TST.
Mm10114 (talk) 15:54, 29 May 2018 (BST) Excellent. You don't forget to reference the source, you link your discussion with observations from previous exercise. Just as it was intended for you to.
EXERCISE 2: F - H - H SYSTEM
Reaction Energetics
Question 6ː Classify the F + H2 and H + HF reactions according to their energetics (endothermic or exothermic). How does this relate to the bond strength of the chemical species involved?
|
|
| Figure.15 F + H2 position on surface plot | Figure.16 HF and H position on surface plot |
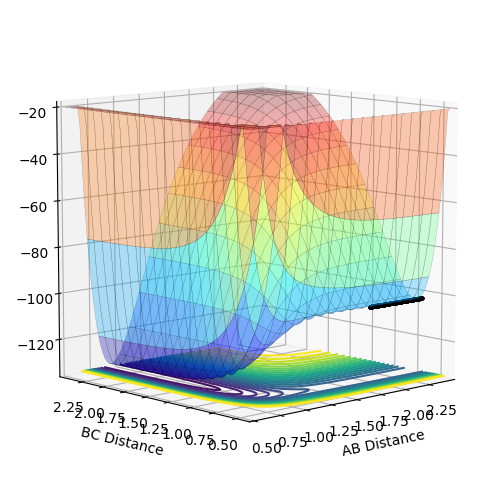
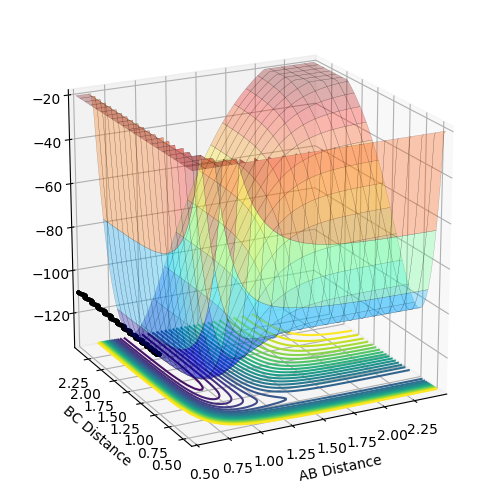
The surface plots of the potential energy surface of H + HF → F + H2 reaction is shown (Fig.15 Fig.16). Distance AB is the distance between H and F atoms and distance BC is the distance between two H atoms. The two minimum points shown in the graph are positions of F + H2 (Fig.15) and H + HF (Fig.16) respectively. If forward reaction is H + HF → F + H2, then the backward reaction is F + H2 → H + HF. As clearly shown in the diagram F + H2 are at a minimum point of higher potential energy than that of H + HF. Thus, by comparing the potential energy of reactants and products, the signs of changes in enthalpy (ΔH) and the energetics are determined. H + HF → F + H2 is endothermic and F + H2 → H + HF is exothermic.
The energetics of the two reactions are in accordance to the predictions by comparing bond strengths of chemical species. The bond energy of H-F bond (565 kJ/mol) is higher than the bond energy of H-H bond (432 kJ/mol). Thus, energy released by forming the H-H bond is not enough to compensate for energy required for breaking the H-F bond and the reaction H + HF → F + H2 is endothermic. On the contrary, the reaction F + H2 → H + HF is exothermic.
Transition State Approximation
Question 7ː Locate the approximate position of the transition state.
|

|
|
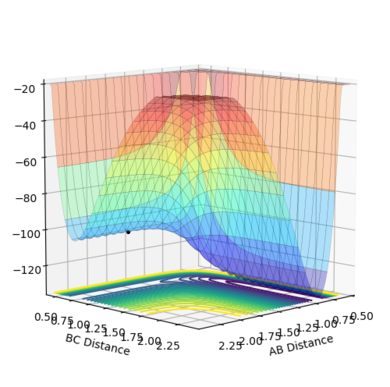
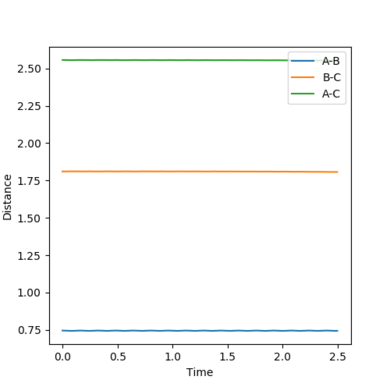
| Figure.17 Transition state surface plot | Figure.18 Transition state contour plot | Figure.19 Internuclear distance against time plot (at TS point) |
The transition state (TS) is shown as a black dot on the potential energy surface plot (Fig.17) and a red cross on the contour plot. (Fig,18) The position of the TS is at the point where the distance between F and H (rFH) is 1.810Å and the distance between two H atoms (rHH) is 0.746Å. The TS is closer to F + H2 and further away from H + HF. At the transition state position, the distance between F and H, between two H atoms are constant with no momentum as shown in the internuclear distance against time plot as horizontal and flat lines, validating the position is the transition state point (Fig.19)
Mm10114 (talk) 15:55, 29 May 2018 (BST) This is correct. Would be nice if you additionally put 1-2 sentence how you've obtained the TS. What was your approach/sampling technique?
Activation Energies
Question 8ː Report the activation energy for both reactions.

|

|
| Figure.21 Energy against time plot (HF + H) | Figure.20 Energy against time plot (F + H2) |
By performing MEP calculation with slight increase and decrease of the rFH to 1.820Å to perform F + H2 → H + HF reaction and to 1.800Å to perform H + HF → F + H2 reaction, the activation energies (Ea) of both reactions can be calculated from the differences in their potential energies (Fig.20 Fig.21)ː
H + HF → F + H2ː Ea = -103.751 - (-133.624) = +29.873 kcal mol-1
F + H2 → H + HFː Ea = -103.751 - (-103.972) = + 0.221 kcal mol-1
Reaction Dynamics
Question 9ː In light of the fact that energy is conserved, discuss the mechanism of release of the reaction energy. How could this be confirmed experimentally?
Reactionː F + H2 → H + HF
Initial condition setː rHF = 2Å rHH = 0.74Å pHF = -0.5 pHH = 0.1
As shown in the plots and animation figures, the H-H bond in the reactants is broken and H-F bond in the products is formed. There are small momenta between both H and F and H-H bond that provide the initial kinetic energy of the reactants and the initial vibrational energy of the H-H bond in the reactants. The initial energy is required to break the H-H bond and reduce the distance of H and F for bond forming and potential energy is released when H-F bond is formed. Since energy is conserved, the reaction energy released is converted to the vibrational energy of the H-F bond and the translational kinetic energies of the products. This is shown in the internuclear momentum against time graph as the initial vibrations of B-C (H-H bond) becomes flat as two H atoms are separated in the product and the A-B (H-F bond) formed in the product vibrates with a large amplitude. (Fig.25) The contour plot and the surface plot also clearly show there is a significant increase in the amplitude of the oscillation of H-F bond which is an indication of the large vibrational energy of H-F bond. (Fig.23 Fig.24)
The predictions can be proved experimentally. The vibrational energy of H-F bond can be determined by measuring the frequency and the intensity of the absorption band of the H-F bond with infrared spectroscopy. The conversion to the kinetic energies of the products can be observed by measuring the temperature of the reaction as the kinetic energy can be converted to thermal energy as products collide with solvent molecules. The temperature is expected to increase as this is an exothermic reaction.
Energy Distribution and Reactivity
Question 10ː Discuss how the distribution of energy between different modes (translation and vibration) affect the efficiency of the reaction, and how this is influenced by the position of the transition state.
| Condition | rFH /Å | rHH /Å | pFH | pHH |
| 1. | 2 | 0.74 | -0.5 | -3 |
| 2. | 2 | 0.74 | -0.5 | 1.9 |
| 3. | 2.1 | 0.74 | -0.5 | 0.1 |
| 4. | 2 | 0.74 | -0.8 | 0.1 |
| 5. | 0.91 | 2 | 0.05 | -20 |
| 6. | 0.91 | 2 | 0.8 | -7.5 |
The transition state illustrated in Question 7 is closer to F and H2 than H and HF. From the above illustrations, it can be shown that the translational energy is more efficient in promoting the reaction between F and H2 which is exothermic, has a lower activation energy and has an earlier transition state. On the other hand, the vibrational energy is more efficient in the reactivity of the reaction between H and HF which is endothermic, has a higher activation energy and has a late transition state. These observations agree with the Polanyi's empirical rules.[2]


