MRD:WS4718
Exercise 1: H2 + H
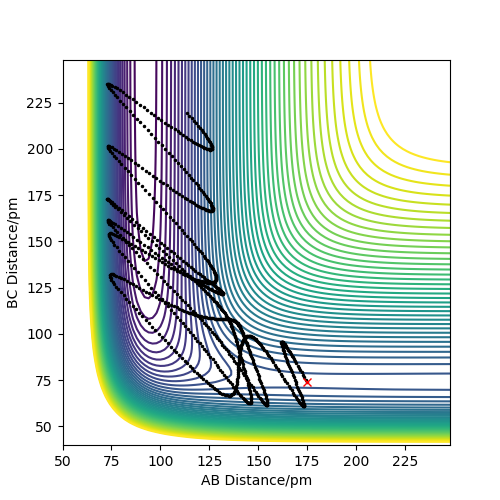
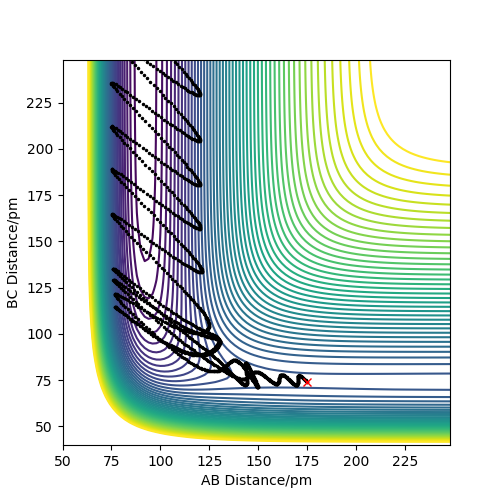
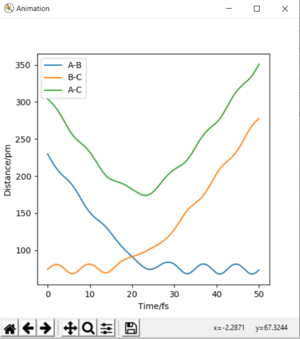
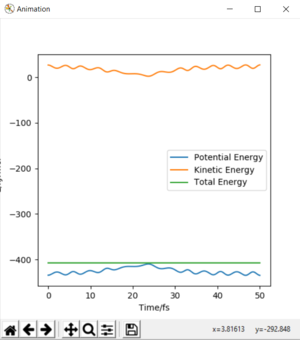
The following plots were produced from observation of the reaction dynamics that occur as a hydrogen atom (A) approaches a hydrogen molecule (BC). The trajectories show how the reaction proceeds from reactants to products. Analysis of these plots allow us to find key parameters, such as the location of the transition state, computationally.
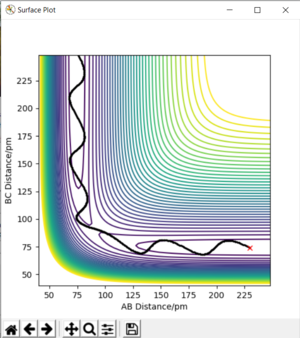
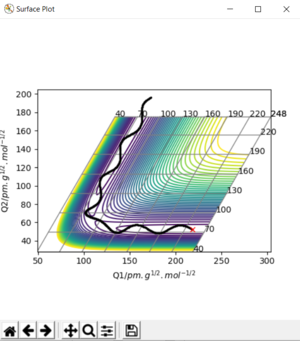
On a potential energy surface diagram, how is the transition state mathematically defined? How can the transition state be identified, and how can it be distinguished from a local minimum of the potential energy surface?
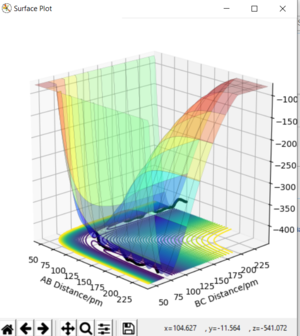
A potential energy surface diagram shows how potential energy varies with bond distances. A minimum energy path shows how reactants turn into products and the transition state is the maximum on this path. But as each bond lengths change, the potential energy changes (appearing like a Leonard-Jones potential), where the minima is the most stable energy conformation, at an equilibrium bond length. Making the transition state a saddle point, where the transition state represents a maxima on the reaction pathway (it is higher energy than the reactants/products). But if you assess how the energy varies with bond distance at this maxima, it will be the minima. The saddle point can be distinguished from local minima, because if you take the second derivative of the minima in all directions they will all be positive. But if you take the second derivative of a saddle point , one will be negative and the rest will be positive, showing its dual nature as a maxima from one perspective and a minima from all others.
Good but a mathematical definition for the transition state would be when the partial derivative of V(r1,r2) is zero, remember that the derivatives are partial. Also, what are the scales on your animations? Sf3014 (talk) 16:21, 1 June 2020 (BST)
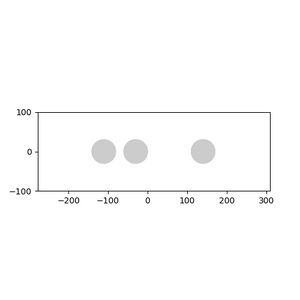
If the trajectory is begun at the transition state, it will remain there as there is no momentum. But geometrical rearrangement to emulate reactants or the products, will push the trajectory in favor of them. To find this state, begin trajectories around this transition state and see in which direction the trajectory follows. In symmetric surfaces, the transition state will also be symmetric. As shown by the following animation.
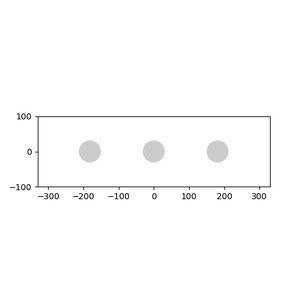
The transition state can be found by setting bond distances equal to one another and the momentum equal to 0.
Report your best estimate of the transition state position (rts) and explain your reasoning illustrating it with a Internuclear Distances vs Time plot for a relevant trajectory.


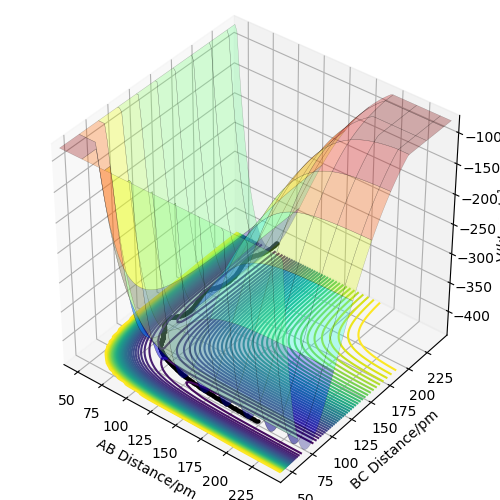
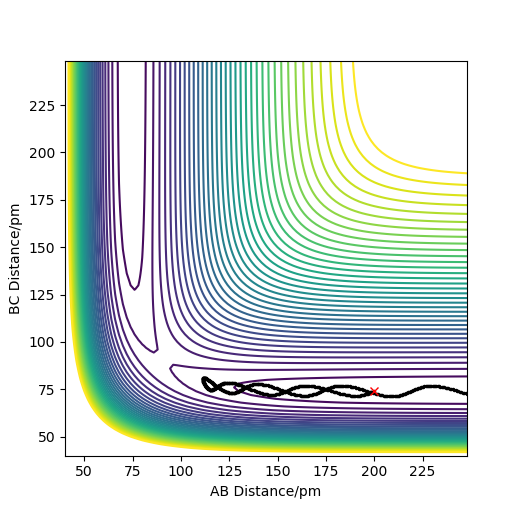
Analysis of the contour and surface plots show the region where the transition state could be, here the momentum is 0 and the distances are equal (230 pm). It appears the transition state seems to be around 90-100 pm for both AB and BC, as this is where the saddle point seems to be located.
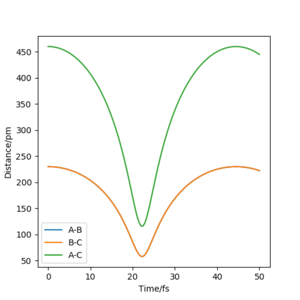
However it is clear that 230 pm is not the the transition state bond length as there is still movement, if it were a transition state it would not have to move to reach it. 90 pm was tried next. There is almost no variation about the lowest energy, but there is still movement shown in the internuclear distance v time graph.
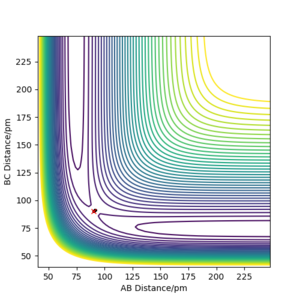
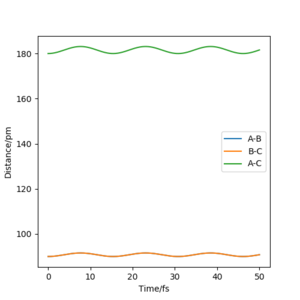
However when r1 and r2 were set to 90.8 pm, no movement was seen. So this is most likely to be transition state bond length.
Good but your distances could be more accurate (to 3 d.p), did you round up your value? If so, state its accuracy and/or zoom in on the distance vs time graphs so it can be shown clearly. Also, if you number your figures at makes it easier to refer to them in your text and make your report clearer. Sf3014 (talk) 16:29, 1 June 2020 (BST)

Calculating the Reaction Path ː MEP
r1 = 91.8 pm r2 = 90.8 pm
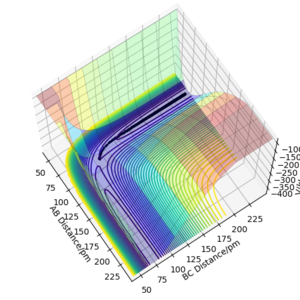
MEP
Trajectories from r1 = rts+δ, r2 = rts

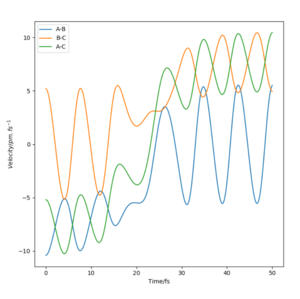
Compared to MEP, the trajectory is oscillating as it represents how the atoms move in real life not in slow motion, where they access vibrational, roatational and translational degrees of freedom. The length of r1 is increased, geometrically becoming more like products, so from the transition state it 'rolls' towards the products.
Your comment on the mep calculation seems more like a comment on dynamic calculation. So, you compared dynamic with mep without explaining mep. Comment on your figures, there are so many with no caption or explanation, how do they all fit into your discussion? Sf3014 (talk) 16:38, 1 June 2020 (BST)
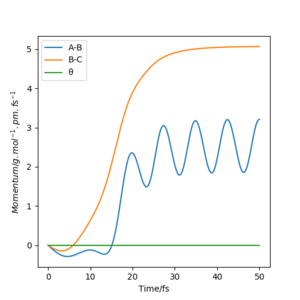

This is changed if r1 and r2 are switched - r1 = 90.8, r2 = 91.8. This geometrically changes it to be more like the reactants, thus it rolls towards the reactants.
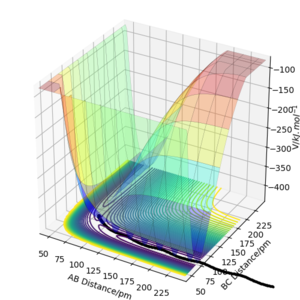
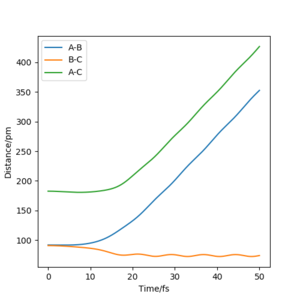

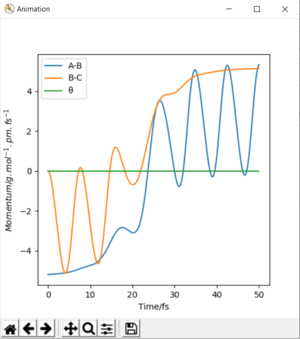
For t = 50 s : r1(50) = ~70 pm, r2(50) = ~350 pm : p1(50) = ~3.5 g.mol-1.pm.fs-1, p2(50) = ~5 g.mol-1.pm.fs-1
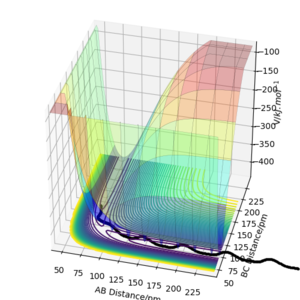
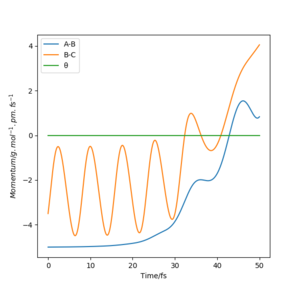

Reactive and unreactive trajectories
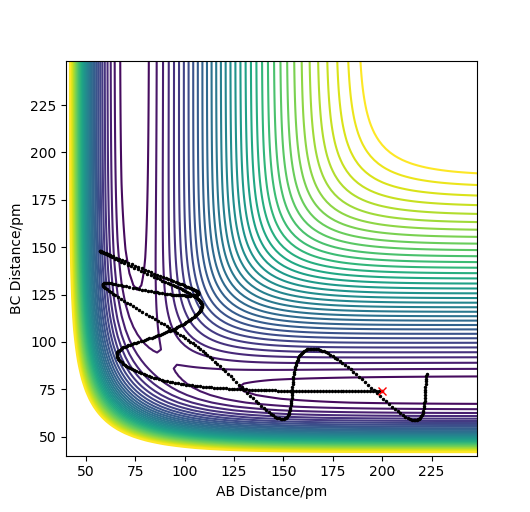
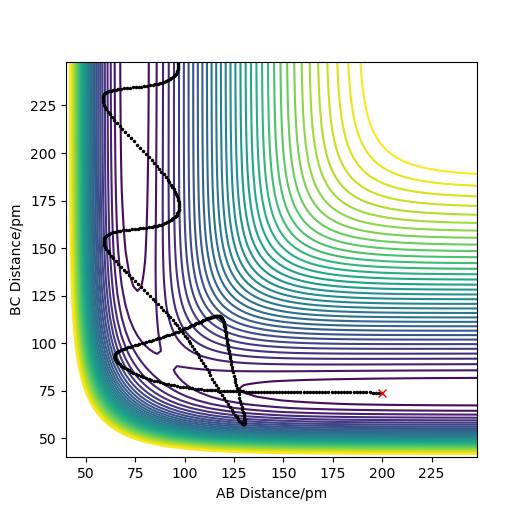
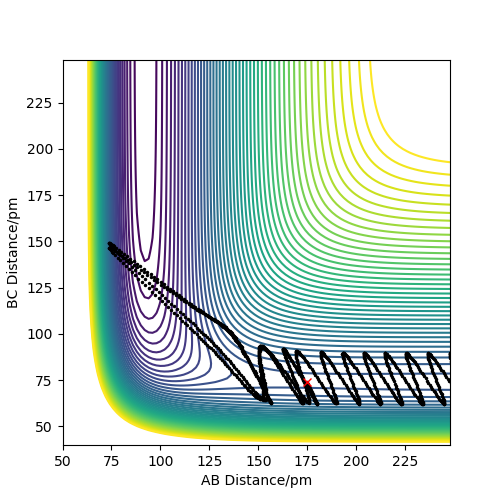
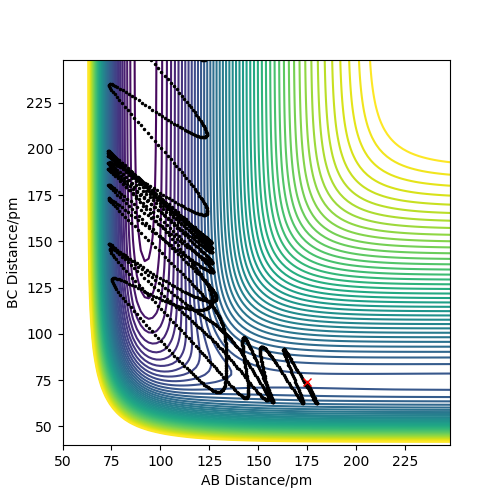
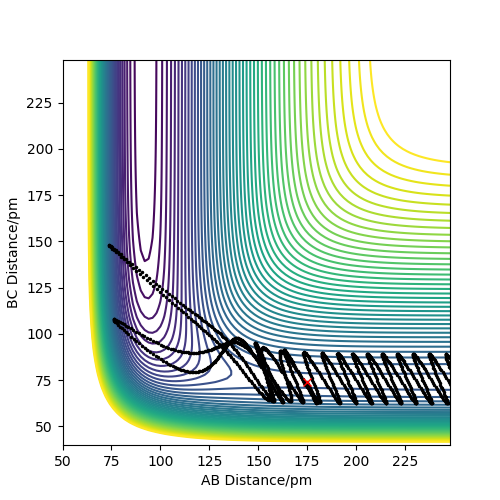
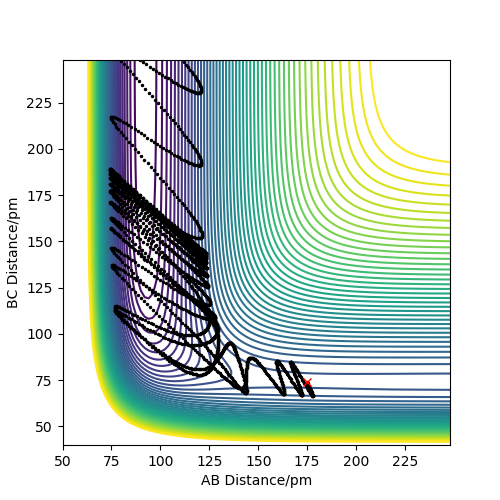
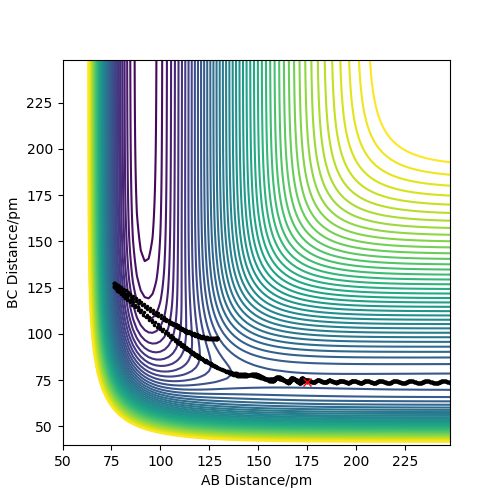
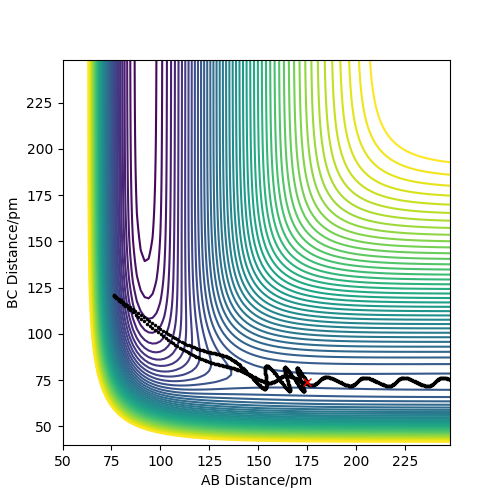
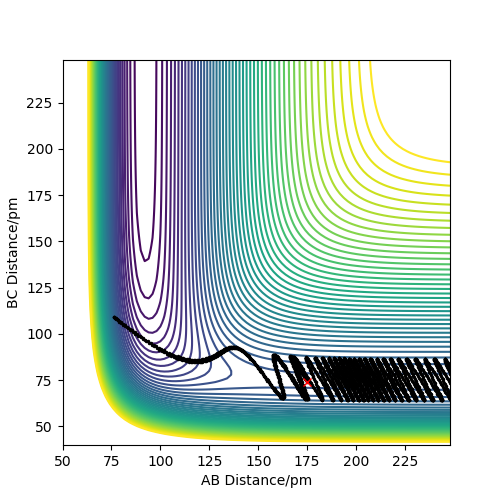
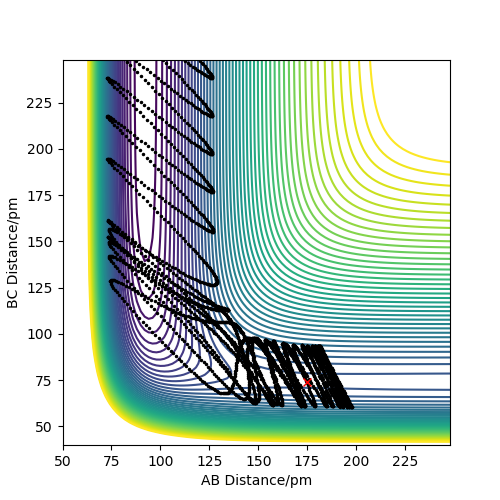
As you increase the momentum of the H2 molecule, the momentum of the H atom also needs to increase. If this is not sufficient, the reaction will not proceed. In some instances a bond will form but it is not permanent. But a slight increase in momenta will push it towards the products.
Good table layout and conclusion. The conclusion would be clearer to follow if p1 and p2 were defined with respect to distances AB and BC. Sf3014 (talk) 16:59, 1 June 2020 (BST)
Given the results you have obtained, how will Transition State Theory predictions for reaction rate values compare with experimental values?
Transition State Theory for a bimolecular reaction, Transition State Theory allows us to find the rate constant. However it is based on several assumptionsː
1) It assumes that molecules will have enough kinetic energy to overcome the energy barrier and form products, if it cannot quit make the transition state its treated as a reactant.
2) Once products are formed, the reverse reaction will not proceed and reform reactants.
3) It ignored phenomenon like quantum mechanical tunneling, where instead of going over an energy barrier it will go through it, this is a result of the breakdown of the born-oppenheimer approximation. As such the system here is treated classically, it won't account for this when considering the rate. The rate will therefore be underestimated as tunneling is the lower energy process.
4) When looking at the transition state, the reaction coordinate can be viewed as purely translational motion. But there are many more degrees of freedom available for the molecule, such as vibrational and rotational. It was seen that bond vibrations can result in the formation of bonds and the breaking of them, before permanent bonds form eventually. This can cause a large overestimation of the rate.
Good but how will point 1 affect the rate? You would gain more clarity when referring to trajectories in your table above, if you numbered the trajectories and the table. Is the reference below for transition state theory? It is poorly placed and linked poorly to your text. Your reference should be place when the information is stated in your text and linked according to the "general instructions" for wiki's in your lab script. Sf3014 (talk) 16:59, 1 June 2020 (BST)
chapter 10 of J. I. Steinfeld, J. S. Francisco, W. L. Hase Chemical Kinetic and Dynamics 2nd ed., Prentice-Hall, 1998
Exercise 2
PES Inspection
By inspecting the potential energy surfaces, classify the F + H2 and H + HF reactions according to their energetics (endothermic or exothermic). How does this relate to the bond strength of the chemical species involved?
F + H2:
We can conclude the reaction is exothermic, as shown by the BC (reactants) bond being significantly higher in energy with respect to AB (products). The products HF + H would be expected. There is an energy difference between reactants and products of around 124 kJ/mol. So we can assume the HF bond is stronger than HH. This can be seen on the PES. There is a large oscillation in the products as the bond is vibrating and initially there is bond breaking and reforming with the H and F, but eventually a permanent HF bond is formed.

H + HF:
The converse is seen here, where the expected products would be H2 + F. The PES shows the reactants (BC) having a much lower energy than the products, supporting the above and that this is the converse endothermic reaction. Here the trajectory shows that in the following conditions the reaction could not take place.
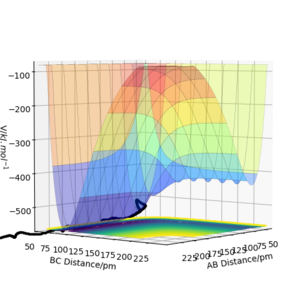
The energy barrier for F + H2 is very large, requiring around 800 K. However interstellar HF has been found to exist at (10-100K) and fast reactions can take place at much lower temperatures providing quantum mechanical tunneling occurs.(1)
Good. However, this final statement is a little unclear. Description on bond energies would benefit from published experimental values for the bond energies for HH and HF Sf3014 (talk) 17:14, 1 June 2020 (BST)
(1) Tizniti, M.; Le Picard, S. D.; Lique, F.; Berteloite, C.; Canosa, A.; Alexander, M. H.; Sims, I. R. The Rate of the F + H2 Reaction at Very Low Temperatures. Nat. Chem. 2014, 6 (2), 141–145. https://doi.org/10.1038/nchem.1835.
Locate the approximate position of the transition state
This molecule is not symmetric, so we cannot assume the transition state will be. Using Hammond's postulate, we can gather that in an exothermic reaction the transition state will be closer to the reactants in energy. Therefore will geometrically resemble them granted a small rearrangement, the converse is true for products in an endothermic reaction. As symmetry cannot be used for the F-H-H system, an initial guess would be that the transition state has a H-H bond length very similar to a H2 molecule (74 pm) and the F-H bond would be very large. After trial and error it was found that r1 = 74.54 pm and r2 = 180.62 pm. This is evidenced by the PSE and Internuclear Distance v Time plots.
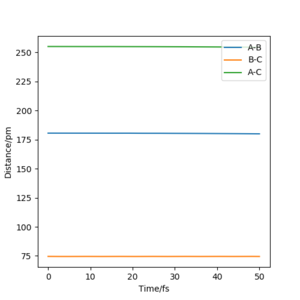
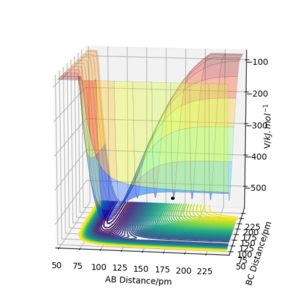
For H-H-F, as this system is endothermic, the transition state would most closely represent the products. As this is the reverse reaction of the above, it would be expected the transition state would be in the same place. Where r1 = 74.54 pm and r2 = 180.62 pm. This was evidenced by the PSE and the Internuclear Distance v Time plots.
Very good. Where did you get the information on Hammond's postulate and the HH bond distance? Sf3014 (talk) 17:18, 1 June 2020 (BST)
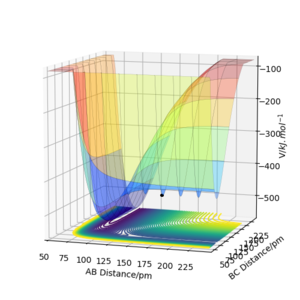
Report the activation energy for both reactions
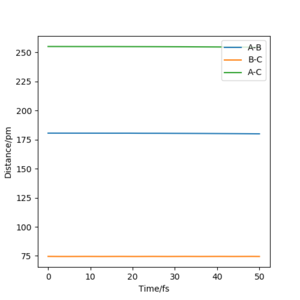
Transition State Energy (r1 = 74.54 pm, r2 = 180.62 pm) = -433.361 kJ/mol
F-H-H:
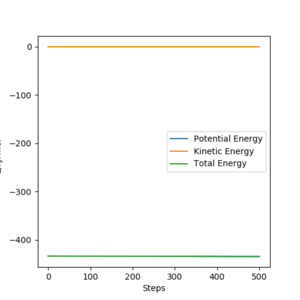
- The activation energy for the reaction was found by an MEP calculation and setting r1=75.54 pm. This 'rolled' the reaction towards the reactants. This averaged the energy of the reactants to a constant.
- E(transition) = -433.361
- Activation Energy = 1.945 kJ/mol
H-H-F
For the endothermic route the same method was repeated, giving the following MEP.

- E(reactants) = -561.804
- E(transition state) = same as F-H-H
- Activation Energy = 128.443 kJ/mol
Goog but it isn't clear to how you calculated the activation energies. You could show this more clearly on your energy vs time graphs by zooming in and referring/describing your figures Sf3014 (talk) 17:21, 1 June 2020 (BST)
Reaction Dynamics
F-H-Hː
r1 = 74, p1 = -0.2, r2=175, p2= -1.6


In light of the fact that energy is conserved, discuss the mechanism of release of the reaction energy. Explain how this could be confirmed experimentally
The momentum v time and the animation show the product (HF) bond vibrate much more than that of the reactant (H2). This can be seen in the high frequency oscillations of the blue (AB) line, showing fast variations in momentum. Visually this is is seen in the animation as the bond being stretched backwards and forwards. As the reaction is exothermic, energy will be released to compensate the formation of lower energy products. This excess energy could be expressed in the vibrational modes of the molecule, causing the faster oscillations. Spectroscopic techniques such as IR can be used to analyse how this energy is being released. In the IR spectrum of HF, one band would be expected (linear : 3N-5). But as the reaction is exothermic, vibrationally excited states are now available, so we would expect to see an overtone at a much weaker intensity. As time progresses, the overtone becomes weaker as the molecule becomes less excited. Thus it can be shown how the energy is being released into the environment as the reaction proceeds and how it impacts the molecules around it. If energy released had no impact on HF, an overtone would not be seen at all.
Good description but unclear links to figures. Also, your animation does not work, a gif file format would work better. Good explanation on IR spectroscopy but how can you measure the HF vibrations as the reaction proceeds? Sf3014 (talk) 17:40, 1 June 2020 (BST)
Chang, H. C.; Klemperer, W. The
Vibrational Second Overtones of HF Dimer: A Quartet. J. Chem. Phys. 1994,
100 (1), 1–14. https://doi.org/10.1063/1.466980.
F+H2:
Setup a calculation starting on the side of the reactants of F + H2, at the bottom of the well rHH = 74 pm, with a momentum pFH = -1.0 g.mol-1.pm.fs-1, and explore several values of pHH in the range -6.1 to 6.1 g.mol-1.pm.fs-1 (explore values also close to these limits). What do you observe? Note that we are putting a significant amount of energy (much more than the activation energy) into the system on the H - H vibration.
For the same initial position, increase slightly the momentum pFH = -1.6 g.mol-1.pm.fs-1, and considerably reduce the overall energy of the system by reducing the momentum pHH = 0.2 g.mol-1.pm.fs-1. What do you observe now?
H+HF: Setup initial conditions starting at the bottom of the entry channel, with very low vibrational motion on on the H - F bond, and an arbitrarily high value of pHH above the activation energy (an H atom colliding with a high kinetic energy). Try to obtain a reactive trajectory by decreasing the momentum of the incoming H atom and increasing the energy of the H - F vibration. (It may be difficult to find the initial conditions that generate a reactive trajectory for this reaction. Using the inversion of momentum procedure for a trajectory starting on the transition state can be useful in this case. Working on the Skew Plot framework could also be helpful.)
| p1 | p2 | ||
|---|---|---|---|
| -0.1 | -6.1 | 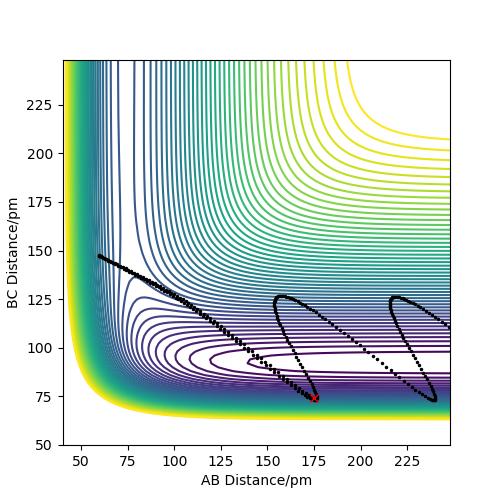
| |
| -3 | -5 | 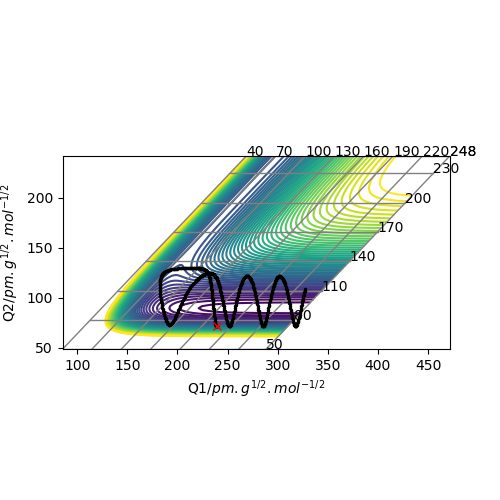
| |
| 0 | 8 | 
|
Discuss how the distribution of energy between different modes (translation and vibration) affect the efficiency of the reaction, and how this is influenced by the position of the transition state.
Polanyi Rules show for an early transition state (exothermic reaction), the product is more likely to possess higher vibrational modes in the product and much less so for late transition states (endothermic). It is seen that for exothermic F+H2, there is a large amount of oscillation in the product HF. This is not seen as much when H2 is formed in H+HF.. Looking at the plots of forwards and reverse reactions, we could analyze the amount of vibrations and assess whether the transition state was likely to be late or early. Helping to establish if the reaction was exothermic or not.
Good effort but hard to follow. p1 and p2 were not defined properly, but is was easier to determine for first table than the second in this section because of the description. Your conclusions on the tables is not clear with little/unclear references to them. Also, where did you get this information on Polanyi's rules? Sf3014 (talk) 17:49, 1 June 2020 (BST)

