MRD:WLi01255539
Exercise 1
Question 1:
What value do the different components of the gradient of the potential energy surface have at a minimum and at a transition structure? Briefly explain how minima and transition structures can be distinguished using the curvature of the potential energy surface.
Answer:
In 3D plots, local minimum point is the point that is always the lowest point no matter which direction the 3D plot is seen. In other words, no matter which angle the 3D plot is seen, local minimum point is always the lowest point of the curve. In contrast, saddle point is the point that is the lowest point when the 3D plot is seen from one direction, but is the highest point when the 3D plot is seen from another direction. In terms of gradients, local minimum point will have a first derivative (δV(r)/δr) as 0 and a second derivative (δV²(r)/δr²) smaller than 0 no matter which curve it is in (i.e. no matter which direction the 3D plot is seen). However, a saddle point will have a first derivative (δV(r)/δr) as 0 no matter which curve it is in, but its second derivatives (δV²(r)/δr²) could be either larger than 0 or smaller than 0 dependent on which curve it is in (i.e. which direction the 3D plot is seen).
In Chemistry, the transition state is a saddle point, as it is the maximum on the minimum energy path linking reactants and products. In other words, it is the highest point in terms of reaction pathway, since activation energy barrier is required to overcome in any reactions; but it is at the lowest point in terms of molecular potential energy. Since molecules are always in vibration, the energy of molecules is always changing. And as the transition state is defined to be on the minimum reaction pathway, it should be the lowest energy state compared to any other state which is also the maximum on the (non-minimum) reaction paths.
Ng611 (talk) 13:49, 8 June 2018 (BST) A good explanation -- a diagram might have made things even clearer.
Question 2:
Report your best estimate of the transition state position (rts) and explain your reasoning illustrating it with a “Internuclear Distances vs Time” plot for a relevant trajectory.
Answer:
The best estimate of the transition state position is 0.908 Å, which could be supported by the plot of 'Internuclear Distance vs. Time' as shown below in Figure 1.

As can be seen from the plot, the distance of A-B, A-C and B-C barely changes with time, showing the atoms A, B and C barely oscillate or collide, which suggests that the reaction is at transition state. Transition structure is a saddle point in the potential energy surface. Since it is the maximum of a reaction pathway, the atoms will neither go back to reactants nor go to products, therefore no collision will happen; also it is the minimum of the molecular potential energy curve, and therefore the atoms will not oscillate, thus the distance remains basically the same with time. Combining the two factors, when the distances between atoms stay the same, the reaction is at its transition state.
Question 3:
Comment on how the mep and the trajectory you just calculated differ.
Answer:
The following plots show the MEP calculated with steps being 80000.


The following plots show the Dynamics trajectory calculates with steps being 500.


The difference between the two types of plots are due to the fact that mep calculation is only considering the lowest potential energy (while kinetic energy is set to zero) and the momentum is reset to zero in each time step, thus no oscillation of atoms, and therefore a straight line is shown in the plot (energy is not conserved); while in the calculation of dynamics, it takes into account of atom mass and gas-phase inertia and its momentum is not reset to zero (closer to reality), so small oscillation is seen as potential energy is transferred to kinetic energy (energy conserved).
The reason why the step of MEP calculation is much bigger than that of dynamics calculation (while the reaction trajectory of MEP is much shorter than that of dynamics) is possibly because the momentum is reset to 0 in each time step in MEP, while in dynamics calculation the momentum is never reset and therefore accumulated, as a result more step needed in MEP to see longer reaction trajectory.
Ng611 (talk) 13:49, 8 June 2018 (BST) Good!
Question 4:
Complete the table by adding a column with the total energy, and another column reporting if the trajectory is reactive or unreactive. For each set of initial conditions, provide a plot of the trajectory and a small description for what happens along the trajectory.
Answer:
Table completed as shown below in Table 1.
| set | p1 | p2 | total energy (kJ/mol) | reactive or unreactive |
|---|---|---|---|---|
| 1 | -1.25 | -2.5 | -99.018 | reactive |
| 2 | -1.5 | -2.0 | -100.455 | unreactive |
| 3 | -1.5 | -2.5 | -98.955 | reactive |
| 4 | -2.5 | -5.0 | -84.954 | unreactive |
| 5 | -2.5 | -5.2 | -83.414 | reactive |
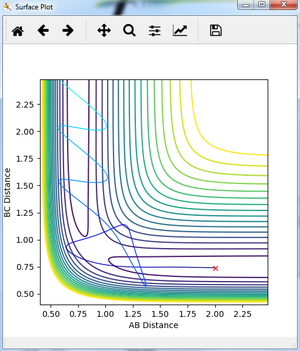
Figure 6 shows the plot of trajectory corresponding to the first set of p1 and p2. The two particles (oscillating) approach each other as each of them possesses a momentum, and then they collide. Since the kinetic energy in total is high enough to cross the activation barrier, a reaction happens as the bond between B and C is broken while a bond between A and B is formed. As a result, a new particle AB is formed and oscillating regularly; while C gets a new (opposite) momentum after collision and moves away.

Figure 7 shows the plot of trajectory corresponding to the second set of p1 and p2. Along the trajectory, the two particles (oscillating) approach each other as each of them possesses a momentum, and then they collide. Since the kinetic energy in total is not high enough to cross the activation barrier, there will be no reaction happening. No bond is formed or broken. H-atom A just collides with particle BC and is pumped away (A gets an opposite momentum after collision).

Figure 8 shows the plot of trajectory corresponding to the third set of p1 and p2.The two particles (oscillating) approach each other as each of them possesses a momentum, and then they collide. Since the kinetic energy in total is high enough to cross the activation barrier, there is a reaction happening as the bond between B and C is broken while a bond between A and B is formed. As a result, a new particle AB is formed and oscillating regularly; while C gets a new (opposite) momentum after collision and moves away.

Figure 9 shows the plot of trajectory corresponding to the fourth set of p1 and p2.The two particles (oscillating) approach each other as each of them possesses a momentum, and then they collide. Since the kinetic energy in total is high enough to cross the activation barrier, there should be a reaction happening, however, this case is not that simple. For some time, the product (AB and a single atom C) is formed but it seems to be unstable, so it just breaks down and goes back to the reactant (BC + A). This is where the experimental observation is not consistent with transition state theory. The extent of oscillating increases as more kinetic energy is in the system.

Figure 10 shows the plot of trajectory corresponding to the fifth set of p1 and p2.The two particles (oscillating) approach each other as each of them possesses a momentum, and then they collide. Since the kinetic energy in total is high enough to cross the activation barrier, there should be a reaction happening. There is a reaction happening at the end, with AB formed and C moved away alone, but before the final result, B is quite hesitate between A and C, moving back and forth, and the system also moves between reactants and products. In the end, H-atom B makes a bond with A and forms a new product with oscillating regularly; while C gets an opposite momentum after collisions and moves away. This is also where the experimental observation is not consistent with transition state theory. The extent of oscillating increases as more kinetic energy is in the system.
Question 5:
State what are the main assumptions of Transition State Theory. Given the results you have obtained, how will Transition State Theory predictions for reaction rate values compare with experimental values?
Asnwer:
Main assumptions of transition state theory:
(You are quoting these from somewhere. You must cite the source, otherwise you are incurring into plagiarism. João (talk) 12:06, 2 June 2018 (BST))
1. The reactants are assumed to be in thermal equilibrium with the transition state.
2. The separation of electronic and nuclear motions, equivalent to the Born-Oppenheimer approximation.
3. The reactant molecules are distributed among their states in accordance with the Maxwell-Boltzmann distribution.
4. Molecular systems that have crossed the transition state in the direction of products cannot turn around and reform reactants.
5. In the transition state, motion along the reaction coordinate may be separated from the other motions and treated classically as a translation.
6. Even in the absence of an equilibrium between reactant and product molecules, the transition states that are becoming products are distributed among their states to the Maxwell-Boltzmann distribution.
Transition state theory explains the rate of chemical reactions.
The first three results obtained from question 4 are in accordance with the transition state predictions however the last two are not.
The fourth assumption is not applied in the two scenarios. This is possibly because the transition state theory only takes into account the statistical properties of the reactive system, with no microscopic details of molecular collisions.
The consequences of the recrossing the transition state (particularly the non-reactive trajectory, e.g. result 4 in question 4) is that the rate of this reaction will be smaller than the rate predicted by this theory. As a fraction of trajectories is non-reactive (result 4 cannot be unique), the rate of the reaction is smaller compared to theory predicted rate (in theory, all trajectories should be reactive).
Ng611 (talk) 13:52, 8 June 2018 (BST) Good! As you've pointed out, this is a classical theory so tunneling is not accounted for (which isn't a huge deal as it's a far less significant effect compared to TS recrossing). Remember to cite your sources.
Exercise 2
Question 1:
Classify the F + H2 and H + HF reactions according to their energetics (endothermic or exothermic). How does this relate to the bond strength of the chemical species involved?
Answer:
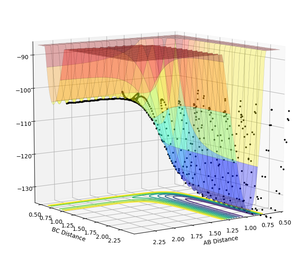
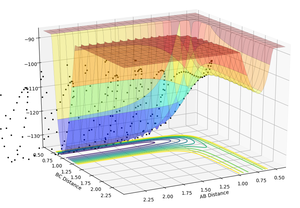
F+H2 is exothermic (shown in figure 11) while H+HF is endothermic (shown in figure 12).
In figure 11, A represents F atom while BC represents H-H molecule, the reaction pathway is from left to right. As can be seen, the potential energy surface is decreased as reactants converted to products, thus exothermic.
In figure 12, A represents H atom while BC represents H-F molecule, the reaction pathway is from left to right. As can be seen, the potential energy surface is increased as reactants converted to products, thus endothermic.
In the reaction of F+H2, the bond between two H atoms breaks (releases heat) while the bond between H and F atoms forms (absorbs heat). The overall result is an exothermic reaction, implying the heat released is larger than the heat absorbed. This could be explained by the difference between bond strengths, which is the amount of energy needed to absorbed when a bond forms (same amount is released when the bond breaks). As H-H bond is stronger than H-F bond, more energy is released when H-H bond breaks than absorbed when H-F bond forms. Therefore the overall energetics is exothermic.
The same applies in the case of H+HF. The bond strength of H-H is stronger than that of H-F, so more energy is absorbed when H-H bond forms than released when H-F bond breaks. As a result, the overall energetics is endothermic.
Question 2:
Locate the approximate position of the transition state
Answer:
Hammond postulate is used to guide the search: the distance between H atom and H atom should be close to 0.74.
Hammond postulate states that the if a reaction is endothermic, it will be a late transition state and the structure at transition state is closer to products; while if the reaction is exothermic, it will be an early transition state and the structure at transition state is closer to reactants.
The reaction of F + H-H is exothermic so the transition structure should mimic the reactant structure, thus the distance between H-H atom should be close to 0.74 (covalent H-H bond length).
The reaction of H + H-F is endothermic so the transition structure should mimic the product structure, thus the distance between H-H atom should be close to 0.74 (covalent H-H bond length).
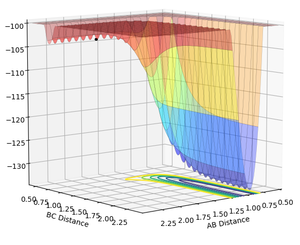

The position of transition state is r1= 0.743 r2= 1.812 as shown in figure 13. (i.e. rAB=1.812; rBC=0.743)
This is proven with figure 14. (discussed before in Ex.1 Q2.) As can be seen from the plot, the distance of A-B, A-C and B-C barely changes with time, showing the atoms A, B and C barely oscillate or collide, which suggests that the reaction is at transition state.
Transition structure is a saddle point in the potential energy surface. Since it is the maximum of a reaction pathway, the atoms will neither go back to reactants nor go to products, therefore no collision will happen; also it is the minimum of the molecular potential energy curve, and therefore the atoms will not oscillate, thus the distance remains basically the same with time. Combining the two factors, when the distances between atoms stay the same, the reaction is at its transition state.
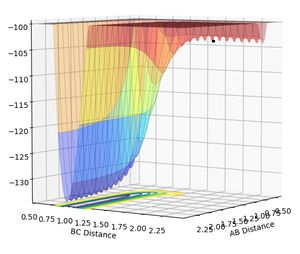

The position of transition state is r1= 1.812 r2= 0.743 as shown in figure 16. (i.e. rAB=0.743; rBC=1.812)
This is proven with figure 14. (discussed before in Ex.1 Q2.) As can be seen from the plot, the distance of A-B, A-C and B-C barely changes with time, showing the atoms A, B and C barely oscillate or collide, which suggests that the reaction is at transition state.
Transition structure is a saddle point in the potential energy surface. Since it is the maximum of a reaction pathway, the atoms will neither go back to reactants nor go to products, therefore no collision will happen; also it is the minimum of the molecular potential energy curve, and therefore the atoms will not oscillate, thus the distance remains basically the same with time. Combining the two factors, when the distances between atoms stay the same, the reaction is at its transition state.
Question 3:
Report the activation energy for both reactions
Answer:
For reaction of F + H-H, the distance between F and H-H is made larger compared to transition state, trying to find the activation energy. With rAB=1.822 and rBC=0.743 and momentum all zero under MEP calculation (step 200000), Energy vs time plot is shown as figure 17.
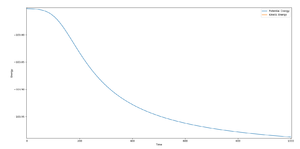
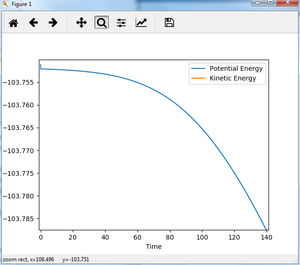

The activation energy of reaction F + H-H is estimated from figure 17 to be 0.238 kJ/mol. As can be seen from figure 17, the activation energy should be approx. 0.2 kJ/mol. To see clearly, the beginning and end of fig. 17 is zoomed in. The transition state energy in fig. 18 is approx. -103.750 kJ/mol, and the reactant energy in fig. 17 is approx. -103.9875 kJ/mol. It could be seen from fig.19, the plot is still not a straight line, suggesting it is still not the exact energy of reactant, but the slope is really small so it could be used as an approximation. After calculation, the activation energy is 0.238 kJ/mol.
Ng611 (talk) 13:54, 8 June 2018 (BST) Yep, I'd say you've done well to get that far and any changes beyond your simulation will be negligible!
For reaction of H + H-F, the distance between H-F atoms (B and C) is made smaller compared to transition state, trying to find the activation energy. With rAB=0.743 and rBC=1.802 and momentum all zero under MEP calculation (step 200000), Energy vs time plot is shown as figure 20.
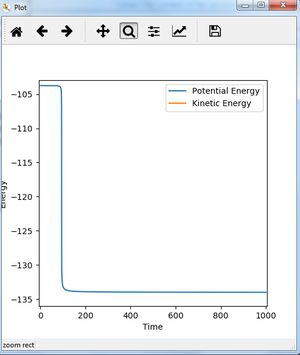
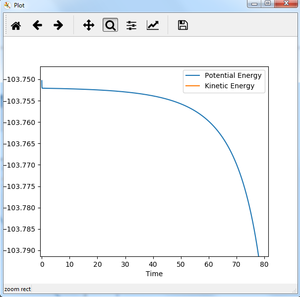

The activation energy of reaction F + H-H is estimated from figure 20 to be 30.258 kJ/mol. As can be seen from figure 20, the activation energy should be approx. 31 kJ/mol. To see clearly, the beginning and end of fig. 20 is zoomed in. The transition state energy in fig. 21 is approx. -103.750 kJ/mol, and the reactant energy in fig. 22 is approx. -134.008 kJ/mol. It could be seen from fig.22, the plot is still not a straight line, suggesting it is still not the exact energy of reactant, but the slope is really small so it could be used as an approximation. After calculation, the activation energy is 30.258 kJ/mol.
Ng611 (talk) 13:54, 8 June 2018 (BST) Good estimate!
Question 4:
In light of the fact that energy is conserved, discuss the mechanism of release of the reaction energy. How could this be confirmed experimentally?
Answer:
The set of initial conditions that results in a reactive trajectory:
Atom A= F, Atom B= H, Atom C= H.
rAB=2.3, rBC=0.74 (i.e. r1=0.74, r2=2.3)
AB momentum= -2.5, BC momentum= -1.25 (i.e. p1= -1.25, p2=-2.5)

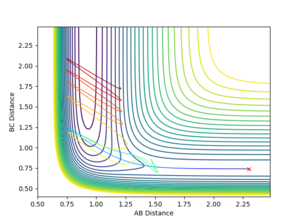

The mechanism of release of the reaction energy is as follows:
There are two kinds of energy at the very beginning: chemical potential energy (stored in the bonds) and kinetic energy (momentum).
The two particles are approaching and colliding to have reactions. Due to bond strength differences, the energy released when H-H breaks is larger than the energy absorbed when H-F bond forms. Then the energy released (exclude the fraction of energy absorbed to form the new bond) is transformed to kinetic energy, i.e. translational energy and vibrational energy.
As can be seen in fig. 23, the vibrational extent becomes larger with the newly formed bond (between atom A and B). And also in fig.25, the slope of distance vs time becomes larger after the reaction, suggesting the particles are moving faster, which implies that translational energy is increased as well, but not as large as vibrational energy.
The recrossing of the transition state (as can be seen in fig. 24) results in the unexpected trend (sudden decrease or sudden increase) of distance (shown in fig. 25) and momentum (shown in fig.23).
Temperature will go up as kinetic energy goes up. Calorimetry could be used to experimentally confirm the mechanism stated above.
Otherwise, IR could be used in this situation to particularly confirm the increase in vibrational energy, because overtone in the IR spectrum will be seen as the result of increased vibrational energy.
As more particles in the first vibrational level are populated to the second level (vibrational energy increases), the intensity of the overtone will increase.
Ng611 (talk) 13:55, 8 June 2018 (BST) Good explanation, and good idea with regards to the IR experiment. Double check to make sure you're using the right terminology -- what you describe as an overtone may be a hot band.
Question 5:
Discuss how the distribution of energy between different modes (translation and vibration) affect the efficiency of the reaction, and how this is influenced by the position of the transition state.
Answer:
The distribution of energy between different modes will have an effect on whether this reaction trajectory is reactive or not, thus will affect the efficiency of the reaction.
Polanyi's rule states that for an endothermic A + BC reaction: if the reaction has an early barrier, then translational energy will contribute more (i.e. translational energy is effective) in overcoming the barrier than vibrational energy; however, if the reaction has a late barrier, then the vibrational energy will contribute more (i.e. vibrational energy is effective) in overcoming the barrier.
(Overcoming the barrier basically means highly possible to have a reactive trajectory, although it is not definite)
From previous questions, the reaction of H + H-F is endothermic and the transition state position for H + H-F reaction is figured out as: rAB=0.743; rBC=1.812, which is a late transition state.
According to Polanyi's rule, in this reaction, the vibrational energy should be effective rather than translational energy.

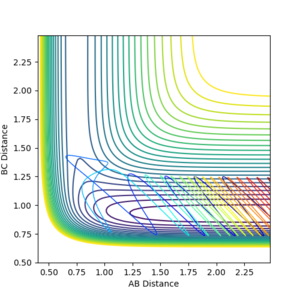
As can be seen in fig.26, the vibrational energy is very large (the oscillation extent is huge) so that the reaction trajectory could be reactive.
The reactive trajectory parameters are as shown below:
rAB = 2.634, rBC = 0.765, AB momentum = -1.263, BC momentum = 3.701.
However, if the trajectory parameters are changed a little bit, e.g. changing the BC momentum from 3.701 to 4.001, the reaction trajectory is no longer reactive, yet the vibrational energy is still large (as can be seen in fig. 27, the oscillation extent remains huge). This implies that there is more than just energy distribution that will affect the efficiency of the reaction.
Ng611 (talk) 13:58, 8 June 2018 (BST) Good second section and overall an excellent report. You need to cite your sources however, otherwise you run the risk of plagiarism. Besides this, some very good explanations, well done.
