MRD:TW2115PhysComp
Potential Energy Surfaces of Hydrogen

Hydrogen is a simple diatomic molecule that rapidly undergoes substitution reactions with other hydrogen atoms via collisions. This is a very simple example of reaction kinetics and can be summarised in 3 stages:
- Stage I: Hydrogen Atoms A and B are bonded together and oscillate around the equilibrium bond length of 0.74 Å with any initial AB momentum. As Hydrogen atom C approaches the molecule with translational energy the potential energy surface shows an increase in energy.
- Stage II: Hydrogen C continues to approach hydrogen B increasing the energy until a maximum in the minimum energy path is reached. This corresponds to the transition state, In figure 2 this is the cross over point where the distance AB = BC
- Stage III: The bond between hydrogens A and B is broken, in this model momentum is conserved therefore hydrogen A travels away from the new molecule BC. Diatomic hydrogen BC oscillates around the equilibrium bond length of hydrogen
Using simulations we can predict the trajectory of the reaction were a stationary molecule AB is collided upon by a third hydrogen atom C as described above.

Lowest Energy Pathway[1]
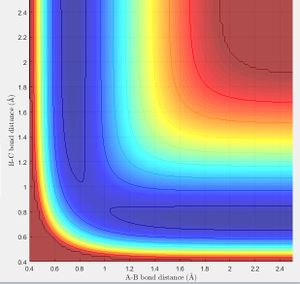
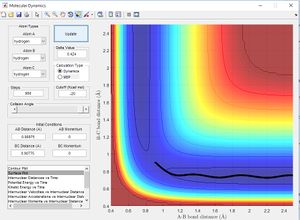
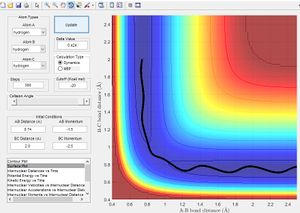
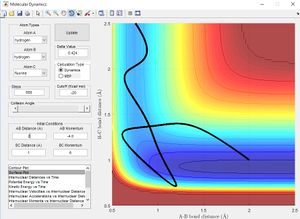
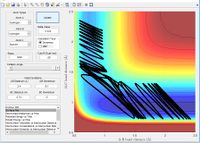
The potential energy surface below shows us the lowest energy reaction path which leads to formation of molecule BC. Using the literature value of bond length 0.74 Å we can see initially when BC length is large and there is little repulsion, molecule AB oscillates around the literature bond length. We can see as hydrogen C approaches the molecule there is an increase in potential energy. The molecule passes through a higher energy transition state. The molecule BC is then allowed to roll down the energy surface, we now note that the BC bond distance is 0.74 Å and molecule A moves away.
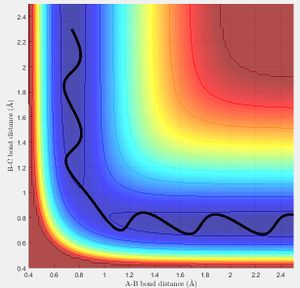
From the literature value of the Hydrogen bond length, we can see that this value corresponds to the energy minimum path before and after the reaction. In terms of figure 1 this corresponds I & III and is represented by a darker blue in the PES display. The sinusoidal deviations from the equilbrium bond length correspond to initial momentum given to the bonded atoms in terms vibrational energy causing an increase and decrease in bond length this thermal energy can be seen best by plotting distance with time.
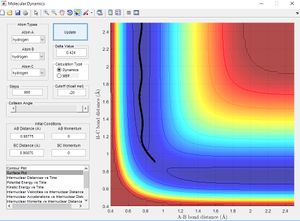
Using the same simulation it is possible to identify the transition state defined as ∂V(r)/∂r=0. To do this we can consider how a ball will sit on a hill with potential energy but remains stationary. In the same way by changing the initial position parameters it is possible to position the 3 hydrogen atoms so that they are in energetic equilibrium. This is shown in figure 4 along with the effects of a small perturbation away from the saddle point. When looking at the potential energy surfaces we can see that the trajectory follows the path of lowest energy. We can see initially at large values of the distance BC the pathway follows the equilibrium bond distance of hydrogen. As hydrogen C gets closer the molecules begin to repel and the energy increases to a maximum inside the lowest energy pathway this is the transition state. The energy required to reach the transition state is the activation energy and comes from the initial momentum. The oscillation stops at this point due to vibrational energy being converted to potential.
To find the transition state bond length we must consider the gradients of the potential energy surface. If we consider a 2D cross section of our potential energy surface we can see a minimum point where ∂x/∂y=0 by putting these points together the lowest energy path is formed. As mentioned previous as the molecule travels through the lowest energy pathway it encouters a gradient in the third dimension z . This energy increase in the path is the activation energy and the top of the peak corresponds to the transition state. The transition state is a stationary point in all 3 dimensions (saddle point) and can be described as ∂V(r)/∂r=0.
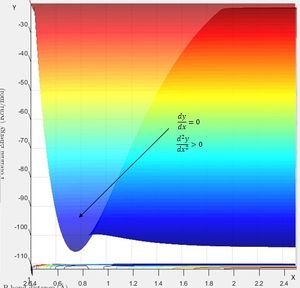
To find the transition state bond length we can consider a ball sitting in equilibrium on a hill. The ball has gravitational potential but remains stationary due to the gradient of the point upon which it sits being zero. One way of finding the transition bond length is to increase or decrease bond length so that there is no reaction path meaning the reactant is on a stationary surface. Another way using minimum energy paths is given below
| AB length (rts) | BC length(rts) | Potential Energy (Kcal/mol) |
|---|---|---|
| 0.9078 | 0.9078 | -99.304 |
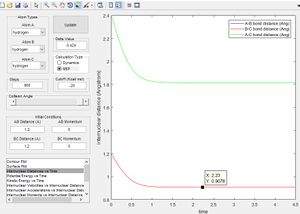
the same result can also be obtained using a MEP as discussed in the next section, If the molecule is given initial bond lengths that are equal it is equivalent to placing a marker on the line y = x in the minimum energy surface (we know in the transition state of 3 hydrogen molecules all bond lengths are equal). An initial bond length of 1.2 Å was selected from which the molecule travelled to the minima of the energy surface. (MEP does not allow to build up momentum across surface). The figure right shows the bond length reaching the transition equilibrium length.
Nf710 (talk) 11:12, 26 May 2017 (BST) Good explanation - typically in higher dimensions you turn the coordinates into the normal modes (un coupled modes) one of these being the reaction coordinate find the 1st and second derivatives
Minimum Energy Path vs Dynamic Paths
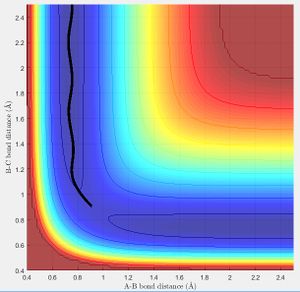
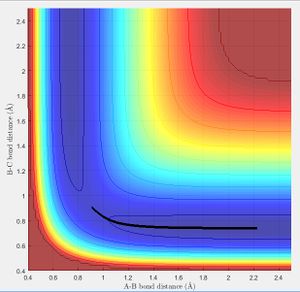
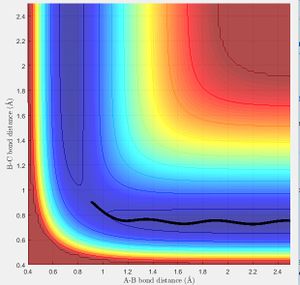
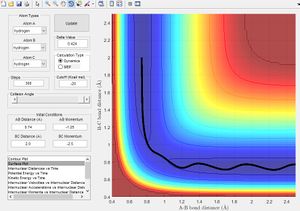
The figure above shows plots of the trajectory calculated as a minimum energy path and a dynamic path. The features of the two paths are given below:
- Minimum Energy Path: This is the path that follows the lowest points in the potential energy surface. The path is calculated in steps with initial velocity zero, meaning each interval is the lowest energy path with no residual momentum carried through steps.
- Dynamic path: This path takes into account the mass of the atom. The molecule converts the potential energy into vibrational or translational and oscillates about the equilibrium bond length. The path taken is not necessarily the lowest energy at every point due to carrying momentum. For example the MEP does not show oscillation of bond length because travelling up the potential energy surface is not the minimum energy path( If given 0 initial velocity the molecule cannot travel up a potential energy surface).
The key differences between the MEP and the dynamic path calculated is the conversion of potential energy to vibration of a heavy nucleus causing oscillation.
Changing the path simulation
In accordance with the nature of stationary points. The simulation shows a slight change in bond length to either of the two r position vectors places the molecule on the side of the potential energy surface. Figure 7 shows the molecule will travel down the surface to a energy well. In this case that energy well is the formation of a diatomic molecule. It is also possible to reverse the path taken. By taking the final position and momentum conditions and setting them as initial conditions it is possible to reach the stationary point. In terms of the molecule this means sending hydrogen A and B towards B with a momentum so that they stay in the transition state.
Reactive & Unreactive trajectories

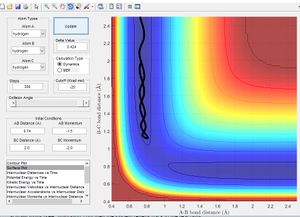
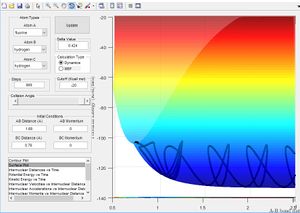
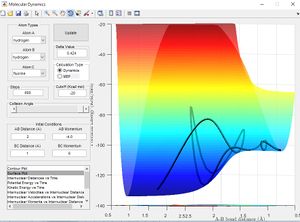
As previously mentioned in order for a reaction to go from reactants to products it must have sufficient energy to overcome its activation energy. In these simulations that energy corresponds to the energy needed reach the transition state and be able to form products. Figure 8 shows a 3D representation of the reaction path with the activation energy barrier marked. The energy given to the molecule in the simulation is momentum. Below is a list of momenta for the particles with the reaction trajectory. If the reaction path passes over the transition and forms the stable product the molecule reacts.
Limitations on the model.
- The particles are modelled classically meaning we can overlook quantization of vibrational energy
- We assume that the concentration of atoms is small enough so that only hydrogens A,B and C have to be considered
- Classical modelling also overlooks tunnelling through the activation barrier (small contribution)
- The model also can break down at higher temperatures. We assume the reaction takes the lowest energy path through the surface. This is not necessarily true for reactions at higher temperatures.
Comparison with Experimental rate values
Transition state theory states for a reaction to occur the reactants must be given sufficient energy to overcome the activation barrier, from there products are formed. In this theory there is no consideration for recrossing of the transition state. From the simulations above we can see that in the figures above we have sufficient energy to overcome the transition state however no reaction occurs. Transition state theory would predict in this case a reaction occurring with excess energy increasing the rate of reaction. Clearly there is a discrepancy between the theory and experimental evidence. More specifically transition state theory does not account for the importance of reaction trajectory rather than net energy.
Another feature of almost negligible effect is tunnelling at through barriers at lower temperatures.
F-H-H system
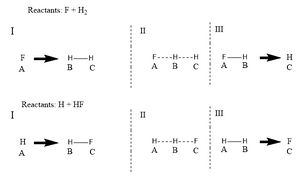
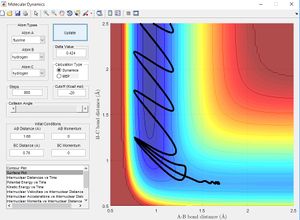
Using the same methods as the system with 3 interacting hydrogen it is possible to simulate the situation where a molecule of Fluorine approaches diatomic hydrogen. For these simulations the initial setup has been changed the diagram below shows the labelling system.
By similar methods to that used in the simulation of hydrogen the transition state bond lengths can be found for the hydrogen fluorine compounds. By consideration of Hammonds postulate we know that the transition state should be closest to the structure of a closer in energy. To find the activation energy the potential energy was first found for the transition state by comparing potential energy with time at equilibrium values of r. Next a MEP was constructed allowing the reaction to fall to reactants. The activation energy was calculated by considering the difference in these values.
| reaction | Trajectory | Transition state bond lengths (Å) | Potential energy against time | Activation energy |
|---|---|---|---|---|
| F+H2 | 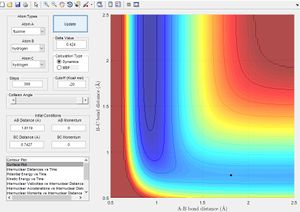 |
AB (FH) : 1.812
BC (HH): 0.742 |
 |
|
| H + H-F | 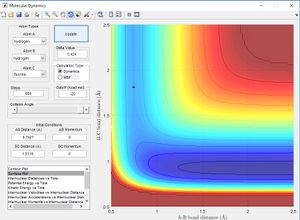 |
AB (HH) : 0.742
BC (HF) : 1.812 |
 |
|
Release of energy
For an exothermic reaction we know that energy is given out. This can be seen in the figures above were the molecule moves down the potential energy surface. We observe in figure ** as the molecule loses the potential energy stored it gains kinetic energy this is because energy is conserved and the total internal energy remains constant.
- For an exothermic reaction this energy is given out as either vibration or translation energy.
In order to analyse the kinetic energy in the sample it is important to avoid irradiating the sample. We must therefore construct an experiment without giving any external energy to the sample. To measure the vibrational energy released we can use calorimetry and measure the heat released from vibrations over the course reaction. This does not however account for any rotational energy. A more accurate method would involve measuring the energy of photons released upon energetic relaxation.
A Deeper look into the Reaction of the Reaction of Fluorine and Hydrogen.
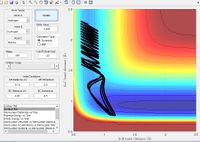
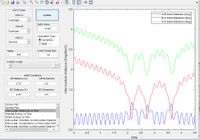
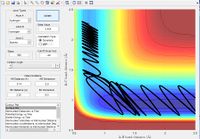
For a successful reaction to occur, the reactants require sufficient kinetic energy to overcome the saddle point of the potential energy surface and form products. In the simulations we can alter the kinetic energy via changing the initial reaction conditions. The stages of the reaction in terms of energy is highlighted below, the sum of kinetic and potential energy is constant.
- Reactants are given initial momentum (proportional to kinetic energy)
- Atom comes close to the molecule increasing potential energy, kinetic energy is converted to potential and the atoms slow down as they travel up the transition state rise.
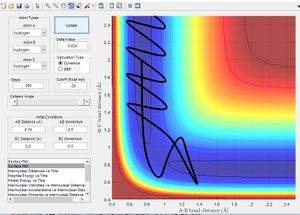
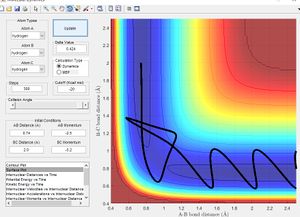
- Depending on the momentum of the molecule on the surface the molecule will either be on a successful trajectory to navigate the curve or an incorrect trajectory.
| Reaction trajectory | Distance vs time | Initial Values | Reaction? | |||||||||
|---|---|---|---|---|---|---|---|---|---|---|---|---|
 |
 |
|
No | |||||||||
 |
 |
|
Yes | |||||||||
 |
 |
|
No | |||||||||
 |
 |
|
Yes |
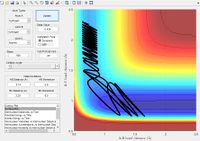
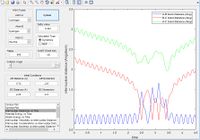
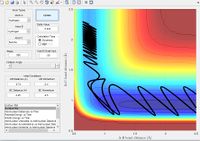
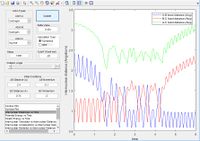
The simulations above show that for a collision caused by the impact of a molecule (in this case hydrogen) with an initial translational energy there is a set of alternating vibrational frequencies that lead to a successful reaction by navigating the curve in the potential energy surface. Transition state theory would product all reactions would proceed due to the excess of energy past the activation energy.
- Vibration energy causes extension and compression of the bonds.
- The colliding molecule is given an initial momentum.
- Changing the momentum of the oscillation changes the trajectory of the molecule through the surface.
- Reaction can only occur when the vibration energy is synced so that it is at the correct trajectory to reach the product around the surface.
- This evidences that trajectory is as important as initial energy (activation energy) as without the correct trajectory the reaction is unable to proceed.
- The chaotic transition state (especially when given large amount of initial momentum) make predicting the outcome of some reaction difficult.
Considering the effects of initial modes of kinetic energy on path leads to Polanyi's rules.
Nf710 (talk) 11:42, 26 May 2017 (BST) You have gone beyond the script here, well done.
Effect of transition state location
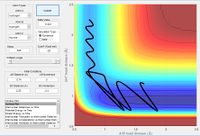
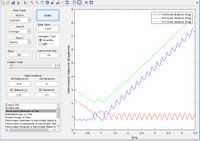
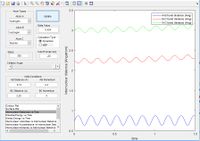
Hammond's postulate can be used to predict the position of a transition state. If the reactants are of a similar energy to the transition state we can call this an early transition state. As can be seen in the figure for the reaction of F+H2 the transition state is located on the reactant trajectory indicating an early transition (we have already proved the reactants to be closer in energy to the transition rather than the products
- An increase in translational energy increases the momentum along the reactant trajectory and enhances the reaction for early transition states.
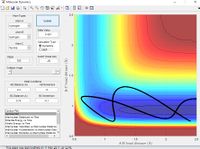
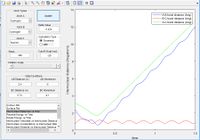
- For late transition stages (eg H + HF) increasing the vibrational energy enhances the reaction by giving the trajectory momentum in the correct direction.
| Early / late | Kinetic energy type in | Parameters | trajectory | distance vs time | reaction | ||||||||||
|---|---|---|---|---|---|---|---|---|---|---|---|---|---|---|---|
| F+H2 | Early | Translational |
|
 |
 |
Yes | |||||||||
| F+H2 | Early | Vibrational |
|
 |
 |
No | |||||||||
| H + H-F | Late | Translational |
|
 |
 |
No | |||||||||
| H + H-F | Late | Vibrational |
|
 |
 |
Yes |
Polanyi's Rules [2]
The findings from the simulation are representative of Polanyi's rule which state for a late transition it is more efficient to give the molecule vibration energy rather than translational kinetic energy. The simulations show the example of a H atom colliding with a HF which has a late transition state (closer to the products than reactants) will succeed with greater vibration energy than translation.
- Early Transition: In terms of the simulations we can see that vibration energy causes oscillations in bond length. For an early transition a straight trajectory from reactant to transition state will be the most successful. A straighter trajectory corresponds to the energy being in the form of translational kinetic energy. Once the molecule has passed the transition it reaches a increased potential and begins to oscillate forming an vibrationally excited product.
- Late Transition: Conversely for a late transition the trajectory requires negotiating the bend in the potential energy surface. For a successful reaction to products in this case an oscillating molecule will have the best chance in negotiating the curvature. The change in reaction axis after the curve removes oscillations and gives a product of high translational energy.
Comparing these rules with the simulations we can see for the early transition state translation energy is most efficient as it pushes the molecule down the energy surface to the transition state directly.
For the late transition state it can roughly be seen that the increase in oscillations helps the trajectory navigate the curvature of the surface.
These effects will not apply to every initial set of conditions instead they change the average by finding more efficient paths to negotiate the geometry compared to an average of equal vibrational and translational kinetic energy.

