MRD:TPD17
1
On a potential energy surface diagram, how is the transition state mathematically defined? How can the transition state be identified, and how can it be distinguished from a local minimum of the potential energy surface?
The transition state is a local maximum, i.e. when the first partial derivatives of energy with respect to rAB and rBC =0 for both and fxxfyy − fxy2< 0, where fxx is the second partial derivative of energy with respect to rAB, fyy is the second partial derivative of energy with respect to rBC and fxy is the second partial derivative with respect to both.
You should revise the theory in this section. The TS is not a local maximum (unless you have only one internal coordinate), and the relation you used above would give you any saddle point, not just the transition state. Fdp18 (talk) 19:16, 20 May 2019 (BST)
For a local minimum fxxfyy − fxy2> 0 and fxx>0
What is the meaning/interpretation of the above equation? Is it the only required criterion? Fdp18 (talk) 19:19, 20 May 2019 (BST)
Please provide a reference. Fdp18 (talk) 19:17, 20 May 2019 (BST)
2
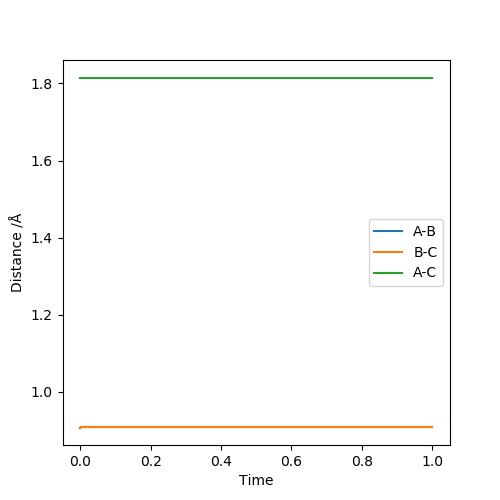
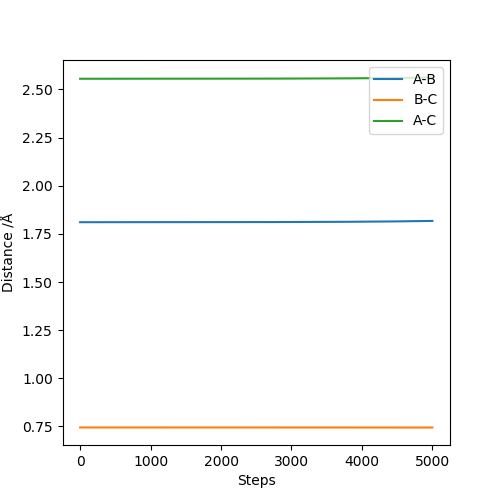
Report your best estimate of the transition state position (rts) and explain your reasoning illustrating it with a “Internuclear Distances vs Time” plot for a relevant trajectory.
rts =0.90774 Angstroms as at this separation the “Internuclear Distances vs Time” plot remains flat meaning that the transition state has already been reached and the particles are at their minimum potential energy.
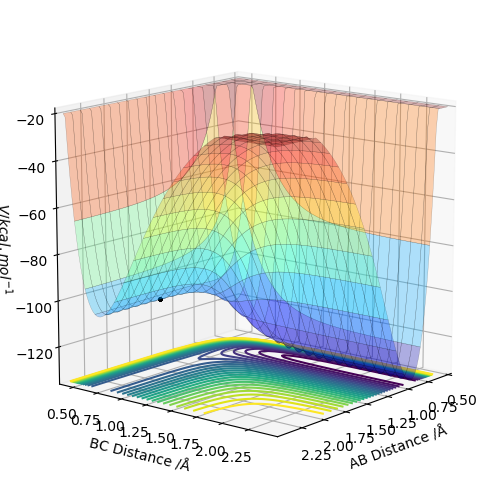
Are they really at their minimum potential energy? Take a look at the 2D (or 3D surface) Plots of the potential energy. Fdp18 (talk) 19:20, 20 May 2019 (BST)
There are three distances - which one is rts? (or which ones?)Fdp18 (talk) 19:20, 20 May 2019 (BST)
3
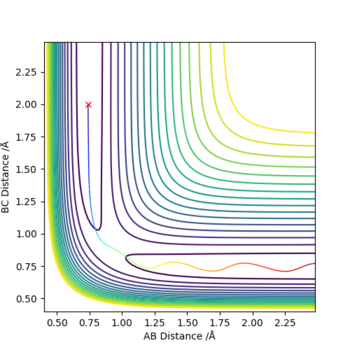
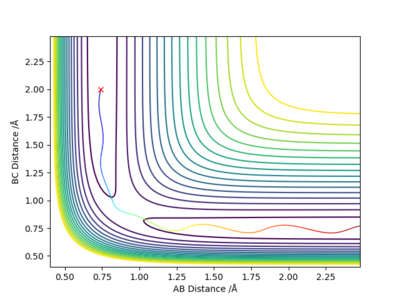
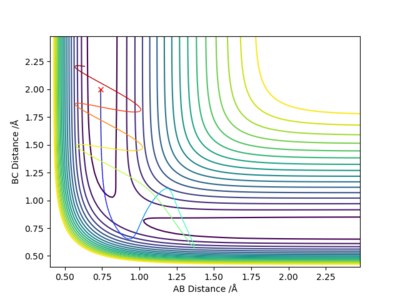
Comment on how the mep and the trajectory you just calculated differ.
The MEP plot is a straight line and the dynamics plot is a wiggly line. This is because the dynamics plot has kinetic energy whereas the kinetic energy of the MEP is reset to 0 at every step so it follows the minimum energy path.
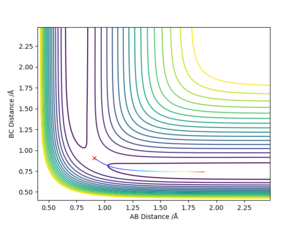
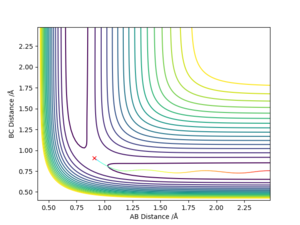
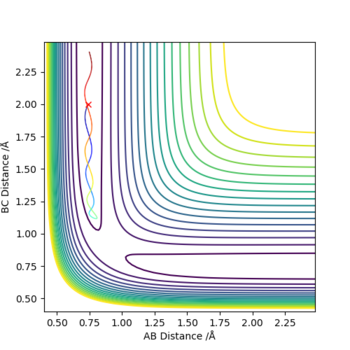
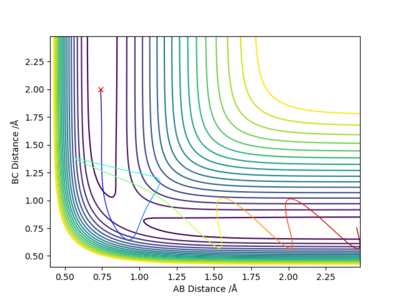
If we use the opposite initial conditions then the A-B and B-C internuclear distances switch. The same thing happens with momenta. This is to be expected as exactly the same process is happening just with the atoms A and C switched.
To be able to associate your line of argument with the figures you present, it is imperative that you number or name the figures and refer to them. Fdp18 (talk) 19:23, 20 May 2019 (BST)
If we do a calculation where the initial positions correspond to the final positions of the previously calculated trajectory, with the same final momenta values but with their signs reversed, then the final position of that trajectory is the initial position of the first calculation: right on top of the transition state saddle point.
4
Complete the table above by adding the total energy, whether the trajectory is reactive or unreactive, and provide a plot of the trajectory and a small description for what happens along the trajectory. What can you conclude from the table?
We can conclude that just because the reactants have enough energy to react doesn't mean they will react.
5
State what are the main assumptions of Transition State Theory. Given the results you have obtained, how will Transition State Theory predictions for reaction rate values compare with experimental values?
The main assumptions of transition state theory are as follows:
1. When a set of reactants has crossed over the transition state to the products these cannot go back and form reactants again.
2. Progression along the reaction coordinate in the transition state can be treated as a translation.
3. Transition states forming products follow a Boltzmann distribution[1] Reread and then rethink that statement. When you only have on TS, do you still need the Boltzmann distribution for something/some other structures? Fdp18 (talk) 19:26, 20 May 2019 (BST)
Transition state theory states that reactants go to products via a transition state of a certain energy, higher than that of either the products or reactants. If the reactants have enough energy then they can go over the energy barrier and form the products. The higher their energy is above the activation energy the faster the rate should be.
This differs from the results in the table as the fourth row has more energy than the first set of initial conditions and so should react faster but this was not the case, contradicting the first assumption. No reaction occurred in the fourth row, despite it crossing the energy barrier of the transition state. The third assumption is not relevant here as our calculation is for a single collision.
6
By inspecting the potential energy surfaces, classify the F + H2 and H + HF reactions according to their energetics (endothermic or exothermic). How does this relate to the bond strength of the chemical species involved?
If we look at the potential energy surface we can see that the H-F potential well is much deeper in energy than the the H-H potential well. this means that going from H-F to H-H requires an input of energy making it endothermic. Going from the H-H potential well to the H-F one releases energy making that reaction exothermic.
HF + H --> H2 + F is endothermic
H2 + F --> HF + H is exothermic
The H-H bond is weaker than the H-F bond because the H-F bond has a deeper potential energy well.
7
Locate the approximate position of the transition state.
To locate the transition state trial and error MEP calculations with no initial momentum were carried out to find a point where there was almost no change in position. Then this position was checked by graphing internuclear distances vs time and finding that they stay constant.
The transition state is at approximately 1.8108 Angstroms for H-F and 0.7449 Angstroms for H-H
8
Report the activation energy for both reactions.
Activation energy = transition state energy - bond energy.
transition state energy was fond by looking at the total energy of the transition state. That statement reads a bit odd. Fdp18 (talk) 19:29, 20 May 2019 (BST)
Transition state energy = -103.752 kcal/mol
The H-H bond energy was found by doing an MEP calculation where the H-F distance was very large and the H-H distance was the bond length. The H-F bond energy was found using the same method, just reversing the distances.
H-H bond energy = -104.020 kcal/mol
H-F bond energy = -134.025 kcal/mol
For H2 + F --> HF + H ΔEa = 0.2675 kcal/mol
For HF + H --> H2+F ΔEa = 30.273 kcal/mol
Pictures would be nice, albeit not necessary. Fdp18 (talk) 19:29, 20 May 2019 (BST)
9
In light of the fact that energy is conserved, discuss the mechanism of release of the reaction energy. Explain how this could be confirmed experimentally.
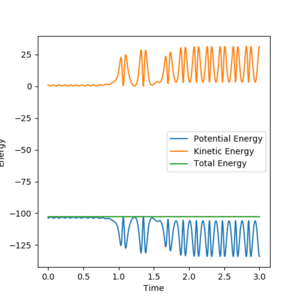
In the reaction of F + H2 the H-F bond has a lower potential energy than the H-H bond. This means that the kinetic energy of the product must be higher than that of reaction to maintain the same total energy. This can be seen on the graph above. The average kinetic energy increases and the average potential energy gets more negative as the reaction progresses. This increase in kinetic energy can be either vibrational energy of H-F or translational energy of both products.
This can be confirmed by measuring the intensities of IR emissions of the products. This allows us to find the population of the vibrational energy states
10
Discuss how the distribution of energy between different modes (translation and vibration) affect the efficiency of the reaction, and how this is influenced by the position of the transition state.

H2 + F has an early TS so it has an attractive surface. Trajectories with more energy in the translational form than vibrational are more likely to react efficiently. The products will have a higher vibrational energy due to the steep walls of the potential energy surface

H + HF has a late TS so it has a repulsive surface. For these the opposite is true, trajectories with more vibrational energy than translational energy are more likely to react efficiently. Products will have a lower vibrational energy as the reaction is endothermic and most of the energy is needed to overcome the energy barrier.[2]
I am not sure what you mean by 'repulsive/attractive surface'. Try to rephrase that to make it more clear. Fdp18 (talk) 19:32, 20 May 2019 (BST)
To me, this appears to be a general problem of this report. Many sentences sound like you're trying to say the right thing, but not in a clear and concise way. In these cases, it is difficult for the one marking you to decide whether you genuinely didn't understand the subject matter or just choose some unhappy wording. Fdp18 (talk) 19:40, 20 May 2019 (BST)

