MRD:TKkrn
EXERCISE 1: H + H2 system
Dynamics from the transition state region
On a potential energy surface, both the first derivatives (with respect to r1 and r2) of the minimum and the transition state equal 0. This means that they're either minimum, maximum or a saddle point. The minimum then has a positive value for both the second derivatives(with respect to r1 and r2) as this indicates that this is a minimum. The transition state is the maximum of the minimum energy path. This means that one of its second derivatives has a positive value, that corresponds to the minimum and the other one has a negative value, which corresponds to a maximum. and combing those 2 together results in a maximum of the minimum energy path.
(Be careful with terminology - what you mean here are partial derivatives! Furthermore, you should always avoid colloquial English when writing reports like this. Fjs113 (talk) 17:25, 3 June 2018 (BST))
Trajectories from r1 = r2: locating the transition state
My best guess for the rts is 0.908 at 500 steps. This value was achieved by taking the r for the bond length(0.74) and making it larger step by step. At a certain point the “Internuclear Distances vs Time” plot showed two constant values for both distances without any oscillations and both neighboring distances being the same and this is the true transition state. When the value is higher than that, it will show a reactive trajectory and if the value is lower than that, it shows an unreactive trajectory.
Trajectories from r1 = rts+δ, r2 = rts
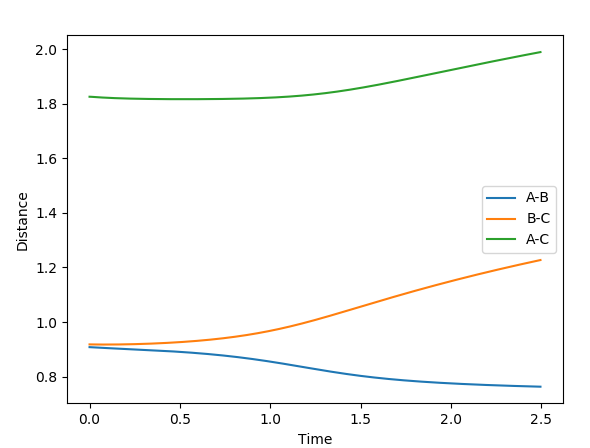
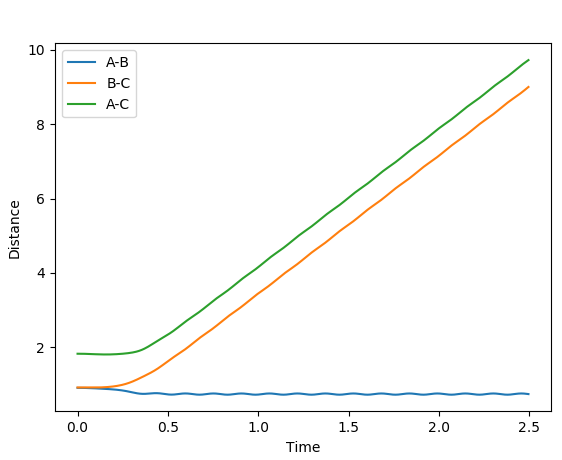
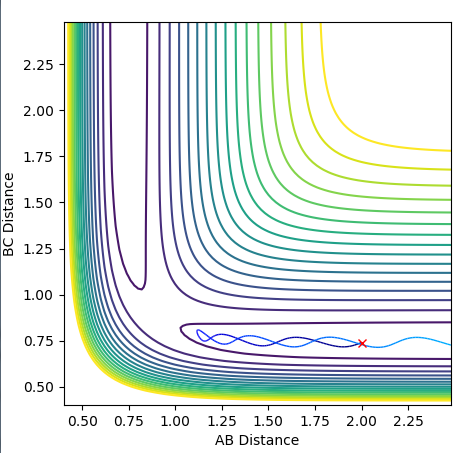
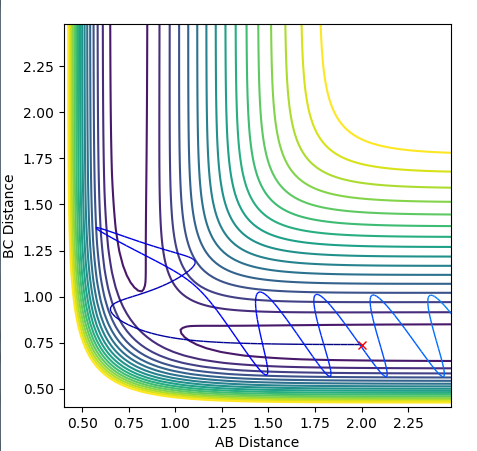
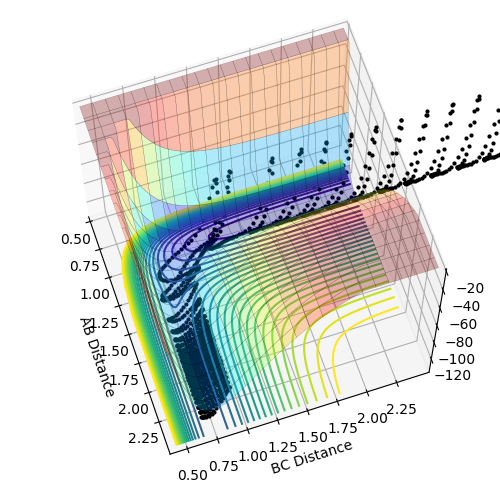
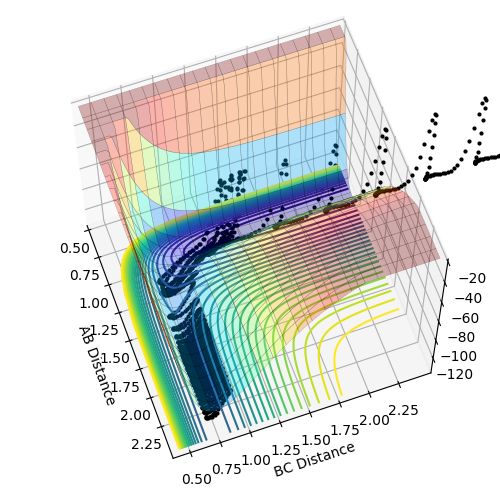
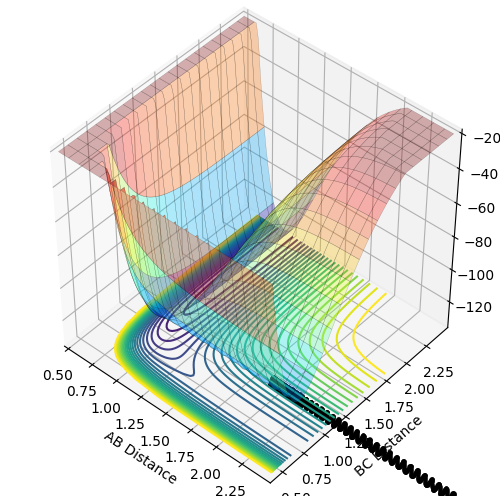
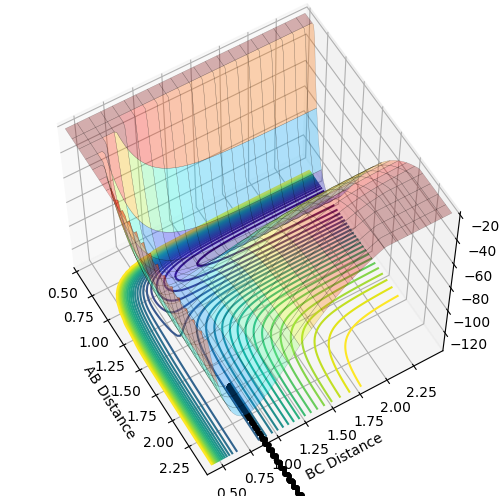
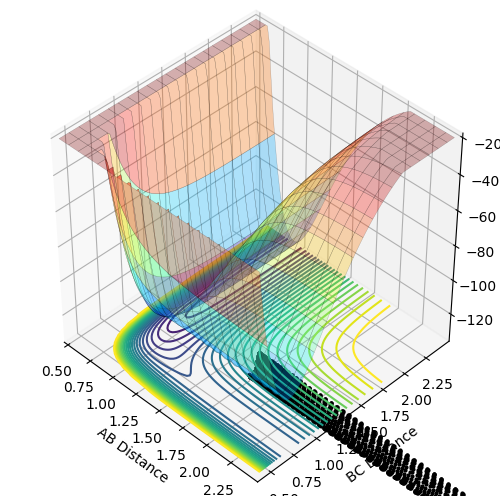
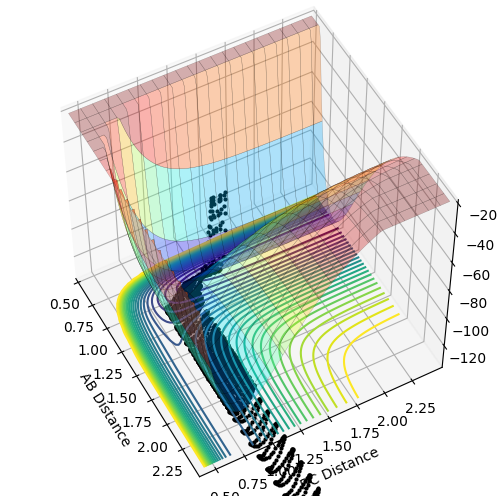
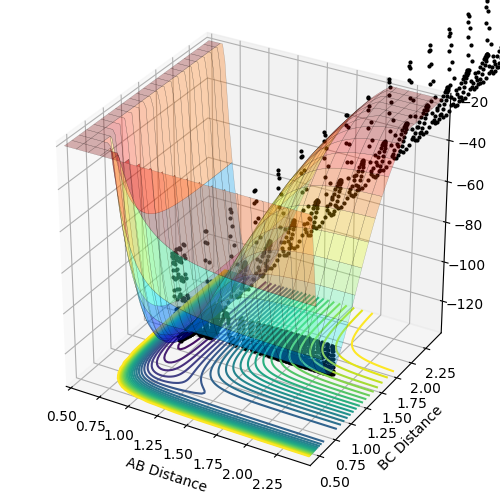
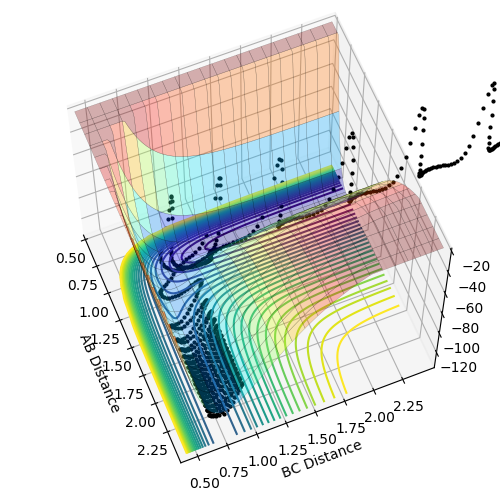
The first plot showed below is the calculation of the trajectory that correspond to the minimum energy path. It only show the movement of the atoms from the position that was inputed until the transition state. The input is a position a bit off the transition state and the mep shows the trajectory to the transition state at infinitesimally small momentum. At transition state for H + H-H the both distances reach the same value and that's where the mep plot stops. On the second plot, the lines continue to effectively infinity(if enough steps), where the B-C and the A-C distances keep increasing and the A-B distance remains constant with some fluctuations due to vibrations.
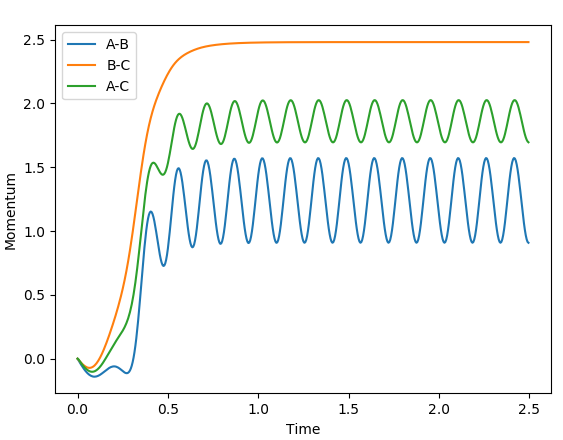
Looking at the momenta of the internuclear distances, using the mep calculation shows a constant of 0 for all three values, which is correct as this is the trajectory at infinitely slow motion. For the dynamics calculation, all three momenta rise as they are leaving the transition state. They reach the platue and some of the oscillate due to vibrations.
Final positions and average momenta at large t in the calculations:
r1(t)= 9.03 r2(t)= 0.75 p1(t)= 2.49 p2(t)= 1.26
What would change if we used the initial conditions r1 = rts and r2 = rts+0.01 instead? Only the signs of the atoms change, all the plots remain the same.
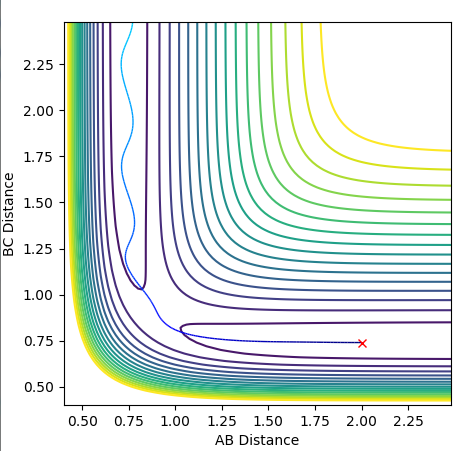
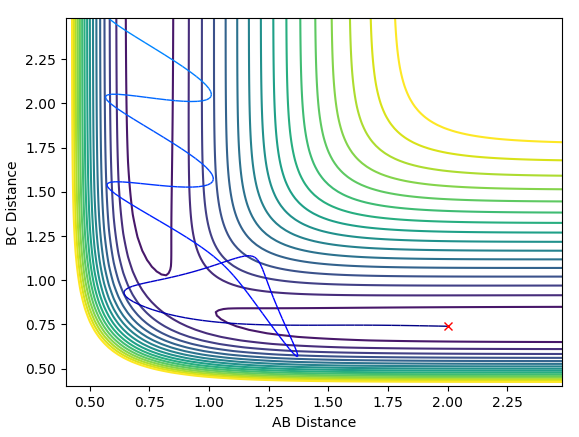
Another calculation was performed, using tha values above, with both momenta's signs reversed and it result in the plot below.
The trajectory in this case is unreactive.
Reactive and unreactive trajectories
- For the initial positions r1 = 0.74 and r2 = 2.0, run trajectories with the following momenta combination:
| p1 | p2 | Total energy | ||
|---|---|---|---|---|
| -1.25 | -2.5 | -99.0 | reactive | |
| -1.5 | -2.0 | -100.5 | unreactive | |
| -1.5 | -2.5 | -99.0 | reactive | |
| -2.5 | -5.0 | -85.0 | unreactive | |
| -2.5 | -5.2 | -83.0 | reactive |
The reactants pass through the transition state normally and then the new molecule starts to vibrate.
The reactants approach each other at the transition state, but the energy is not large enough to pass the energy barrier, so they just collide and start moving into opposite directions.
The reactants pass through the transition state normally and then the new molecule starts to vibrate.
The molecule and the atom approach each other and pass the transition state to form a new molecule, which then vibrates extensively and repasses the transition state to form back the reactants.
The reactants approach the transition state, pass through it to form a new molecule, then repass it and pass through it again, so in the end you get the new molecule formed, with extensive vibrations.
The general assumptions of the transition state theory are the Born-Oppenheimer approximation and that the states of the reactants are distributed according to the Maxwell-Boltzmann distribution. Additional assumptions are as follows: -Molecular systems that have crossed the transition state in the direction of products cannot turn around and reform reactants. -In the transition state, motion along the reaction coordinate may be separated from the other motions and treated classically as translation. -The transition states that are becoming products are distributed among their states according to the Maxwell-Boltzmann distribution. It also assumes a pseudo equilibrium between reactants and products. One of the main limitations is that the atoms are treated classically. That means that only the reactants that have a high enough collision energy can react and form products. For reactions that have a low activation energy, this often fails, because quantum tunneling can occur and reaction proceeds without reaching that required energy. The assumptions that once transition states proceeds to products, they cannot reform reactants also, evidently, fails sometimes as we can see in some of the reactions above. Where the products are formed and then rebound to form back the reactants due to a high vibrational energy.
(All correct, but how does this affect predictions made about the reaction rate? Fjs113 (talk) 17:25, 3 June 2018 (BST))
EXERCISE 2: F - H - H system
PES inspection
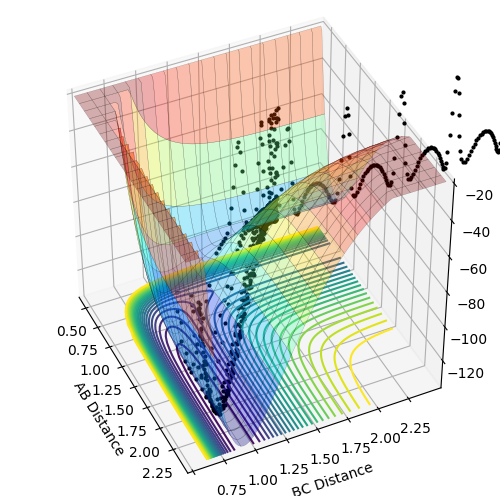
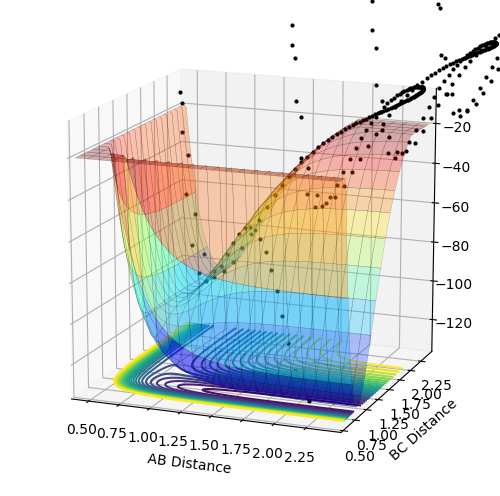
The reaction H-H + F = H-F + H is exothermic, as the products on the potential energy surface are located lower than the reactants in terms of the energy. The reverse reaction is exothermic as the products are located higher in terms of energy. This means that the H-F in stronger and energetically more favored than the H-H bond.
(Would be nice to see a picture for this. Fjs113 (talk) 17:25, 3 June 2018 (BST))
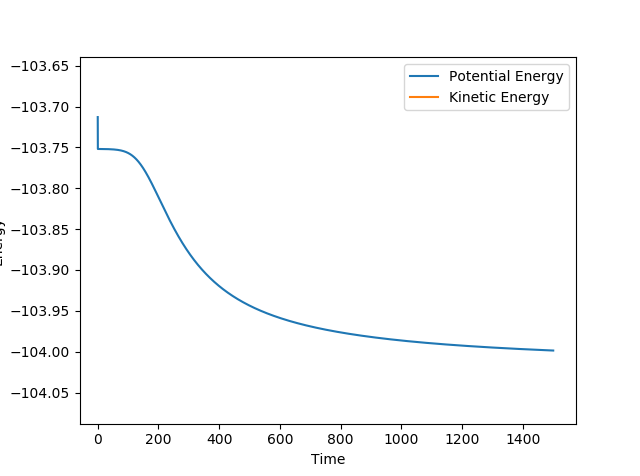
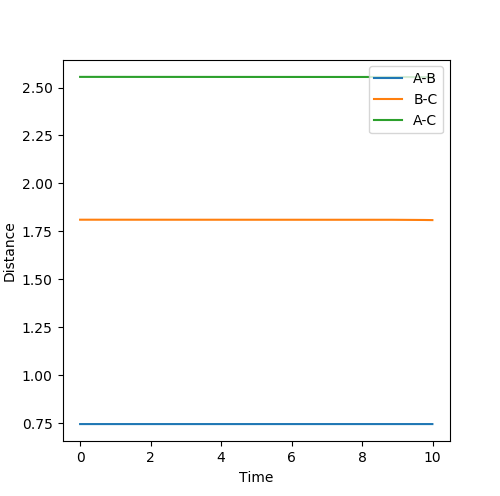
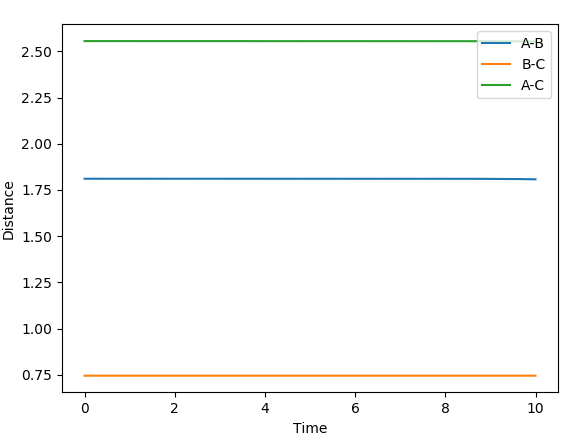
The transition state position was determined by applying Hammond's Postulate and tweaking the values of r to obtain a stable structure without any fluctuations, as seen in the Internuclear distances vs. time plots provided below. The positions were then moved slightly out of the transition state and mep calculations were performed with 800000 steps to obtain the activation energies, this is also plotted on a Energy vs. time plot below.
Transition state for H-H + F: r1 = 0.744891 r2 = 1.810746699 Activation energy = 0.248 kcal/mol
Transition state for H-F + H: r1 = 0.744891 r2 = 1.8107467 Activation energy = 32.612 kcal/mol
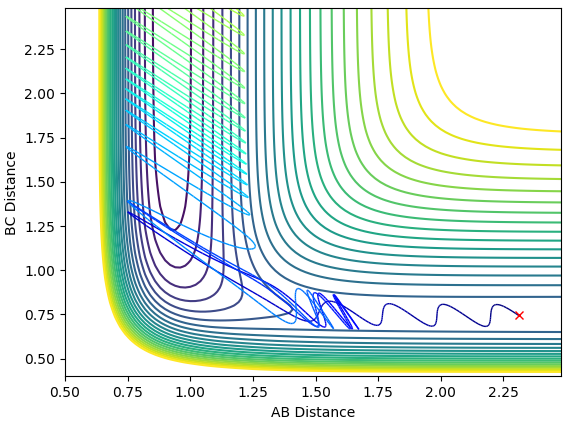
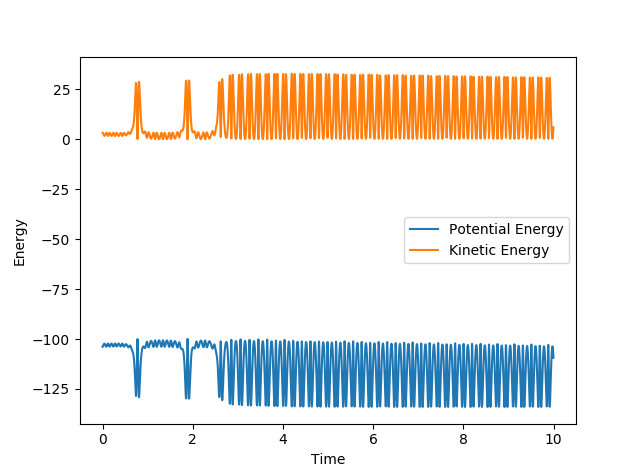
The system passes the transition state, repasses it and passes it again. The momentum of the newly formed bond H-F initially quickly drops and the quickly rises each time it passes the transition state as the atoms are pulled together and then pulled apart again. Each time after passing the transition state this momentum rises as the atoms are closes together. After passing the transition state the final time, the momentum oscillates due to vibrations. Each time they pass the transition state the kinetic energy converts to the potential and then right after vice versa. This could be measured with some kind of time resolved IR spectroscopy, because when the kinetic energy is higher the molecule is in a vibrationally excited state, has more active IR stretches and would show more bands on the spectrum (overtones).
Reaction dynamics
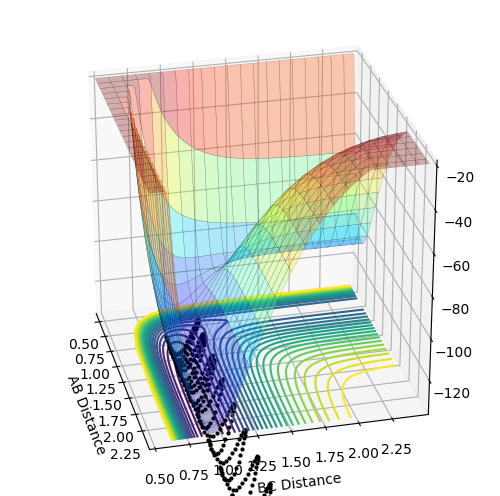
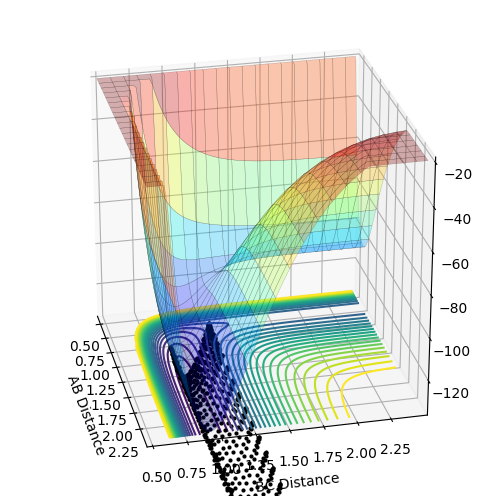
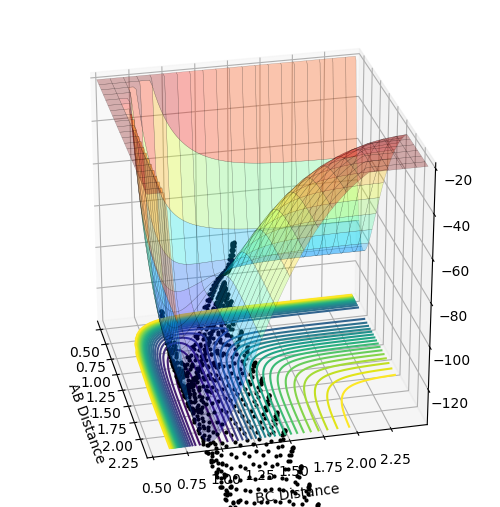
Different trajectories of the H-H + F reaction by adjusting the pHH value.
When the momentum of the F-H distance is changed to -0.8, the trajectory now becomes reactive.
| r1 | r2 | p1 | p2 | |||
|---|---|---|---|---|---|---|
 |
0.9 | 2.1 | 0.5 | -3 | unreactive | |
 |
0.9 | 2.1 | 3 | -2 | unreactive | |
 |
0.9 | 2.1 | 5 | -1 | unreactive | |
 |
0.9 | 2.1 | 8 | -0.5 | unreactive | |
 |
0.9 | 2.1 | 12 | -0.2 | reactive | |
 |
0.9 | 2.1 | 15 | -1.5 | reactive |
Different trajectories of the H-F + H reaction by adjusting the pHF and the pHF value.
Looking at all the data provided in this section, some conclusions can be drawn. The first table shows data for when the H-H vibrational energy is changed in the F + H-H reaction. The trajectory is unreactive in a gap between ~-2.7503 and ~2.4976 with respect to the momentum of the H-H bond distance. This is done for the Value of the H-F momentum of -0.5. But when this momentum is changed to -0.8, most of that gap becomes reactive as well. Because that gap is not that wide and a small change in the momentum of H-F makes trajectories reactive, we can assume that tha translational energy of the collision is more important for this reaction to proceed than the vibrational energy of the starting molecule. Polanyi's empirical rules predict such behavior for early transition states. Indeed if we look at the transition state for this reaction, it resembles the starting material, not the product.
Looking at the data for the reverse reaction H-F + F, both the momenta were adjusted to obtain a reactive trajectory. This turned out to be quite difficult to do. The vibrational energy of the H-F had to be increased significantly for the system to pass the activation barrier. At the same time the incoming H---H-F momentum had to be lowered. This shows that the vibrational energy in this case has a much higher contribution to the reaction than the translational energy. Polanyi's rules predict such behavior for early transition states. And again, this reaction indeed has an early transition state, which look similar to the one for the first reaction. The two hydrogens are close together and in this case, that structure resembles the products.
(Overall, well done. Fjs113 (talk) 17:25, 3 June 2018 (BST))


