MRD:SW1816
H-H-H system
Transition State
What value do the different components of the gradient of the potential energy surface have at a minimum and at a transition structure? Briefly explain how minima and transition structures can be distinguished using the curvature of the potential energy surface.
Answer:
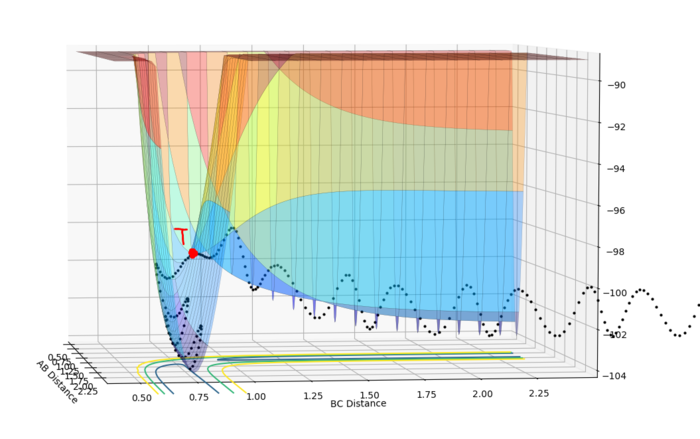

In mathematics, the gradients in different directions at minimum and at transition state(saddle point) are all 0. However, at a minimum, the second differentiation is larger than 0. The second differentiation in one direction is smaller than 0 and it is larger than 0 in the other direction. f(x,y) states the potential energy when the distance between B and C is x and the distance between A and B is y. Minimum fits df=0, d2f/dx2>0 and d2f/dy2>0. The saddle point fits df=0, d2f/dx2>0 and d2f/dy2<0 or df=0, d2f/dx2<0 and d2f/dy2>0.
From the figure 1 and figure 2, the point T states the transition state. The transition state shows the minimum of the potential energy and the maximum of reaction energy. The lowest potential energy vs BC-distance increases to the maximum point, which is the transition state.
Trajectories from r1 = r2: locating the transition state
Report your best estimate of the transition state position (rts) and explain your reasoning illustrating it with a “Internuclear Distances vs Time” plot for a relevant trajectory.
Answer:
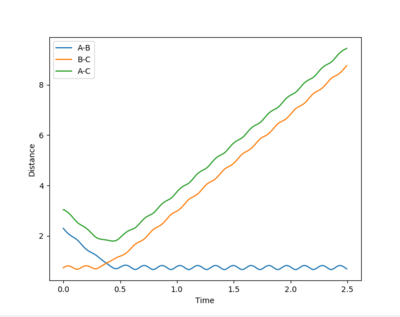
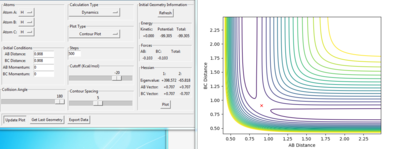

rts= 0.908 au. At transition state, the r1=r2 as the H-H-H system is symmetric and all the 3 atoms are the same element. In the Internuclear Distance vs Time graph, the crossing point indicates distances data at transition state. At transition state, the H+H+H system has the lowest potential energy. Thus, the energy has no oscillation at transition state. From the figure 5, the energy is constant when rts is 0.908 au.
Calculating the reaction path
Comment on how the mep and the trajectory you just calculated differ.
Answer:
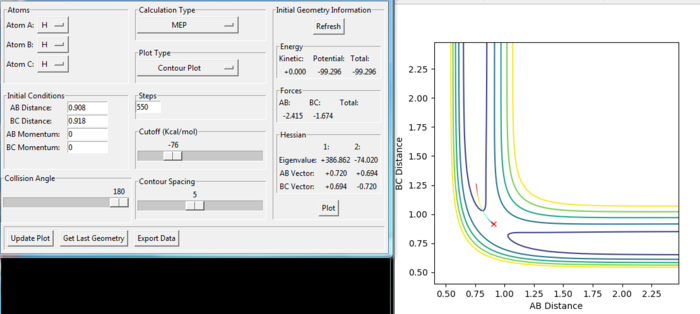
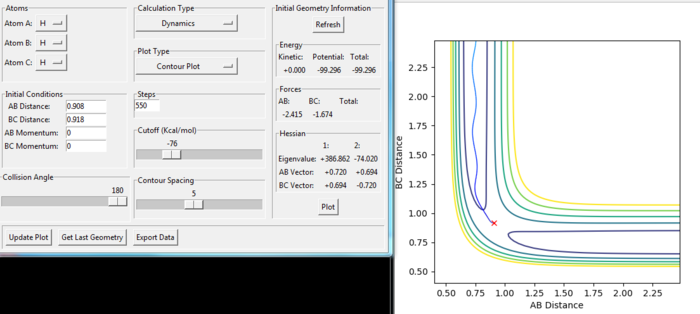
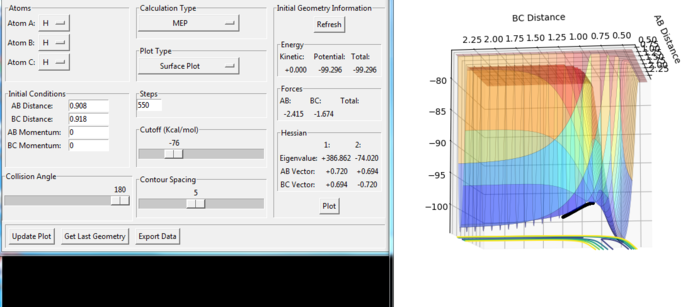
From the figure 6 and 7, the reaction has passed the transition state. The reaction goes towards the product. The mep indicates the lowest points in the oscillating energy in the reaction path. Therefore, we cannot see any oscillation in the graph. It is similar to the connection of the troughs. From the Figure 8, we also observe that the lowest energy during the reaction path forms the mep. However, the trajectory shows the actual energy changing in the reaction including the oscillation of energy. The momenta p1 and p2 are all zero, which means the atom and molecule have no initial kinetic energy. The H(B)-H(C) distance is longer than the rts for the transition state, which leads to initial potential energy for the H(B)-H(C) molecule. Therefore, in the actual reaction, the H(B)-H(C) oscillates along the potential energy surface.
Reactive or unreactive
Complete the table by adding a column with the total energy, and another column reporting if the trajectory is reactive or unreactive. For each set of initial conditions, provide a plot of the trajectory and a small description for what happens along the trajectory.
Answer:
| p1 | p2 | Total energy | Reactive or unreactive |
|---|---|---|---|
| -1.25 | -2.5 | -99.119 | reactive |
| -1.5 | -2.0 | -100.456 | unreactive |
| -1.5 | -2.5 | -98.956 | reactive |
| -2.5 | -5.0 | -84.956 | unreactive |
| -2.5 | -5.2 | -83.416 | reactive |
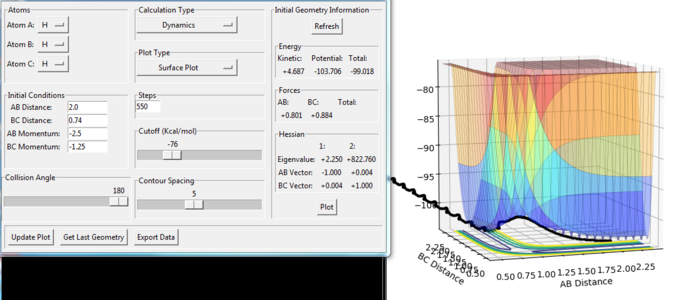
In this reaction process, the B-C distance does not change significantly in the beginning, but the A-B distance decreases along the trough of the potential energy. This means that the H(A) atom moves towards to the H(B)-H(C) molecule. In the middle part of the reaction, the A-B and B-C distance both decreases until reaching the transition state point. Having passed the transition state, the B-C distance increases with oscillation, which means that the H(A)-H(B) molecule has formed and the H(C) atom gets away from it.

In this reaction process, the H(B)-H(C) bond vibrates initially. The H(A) atom moves towards the H(B)-H(C) molecule but it does not have enough energy to collide. From the initial condition, the momenta of the molecule and the atom are all much lower than the conditions in the first reaction shown in figure 9. In the other word, the total energy in the H-H-H system is lower than the activation energy, so the reaction process indicated in the surface plot(figure. 10) does not reach the transition state point. From the potential surface diagram, we observe that the reactants shifts to the product, but before forming the product H(A)-H(B) the reaction shifts back to reactant end. The reaction ends in H(B)-H(C) and independent H(A).
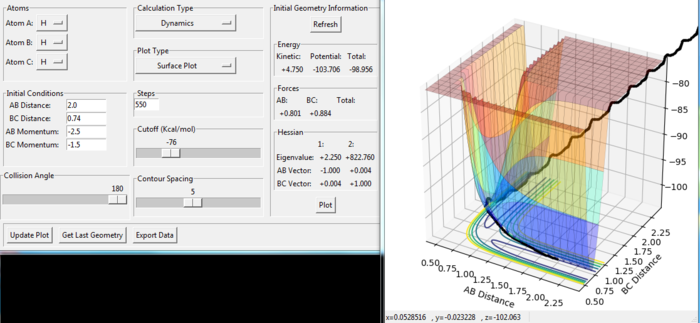
The reaction is reactive with the data setting shown in the figure 11. The H(A) atom moves to the the H(B)-H(C) molecule and collides it because the momenta of A and B-C setting gives enough energy to reach the transition state. After having passed the transition state, the atom H(C) breaks bond with H(B) and gets away from the new-formed molecule H(A)-H(B).
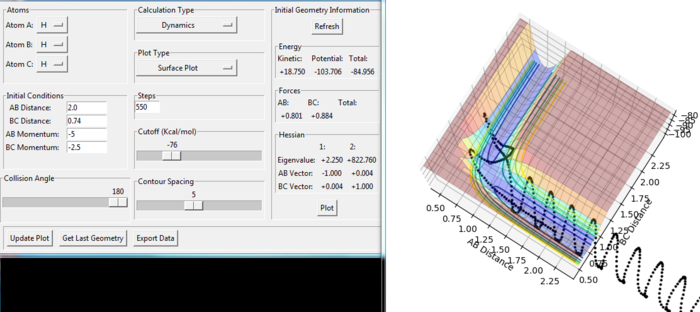
We observe that in the figure 12 the H(A) moves to the H(B)-H(C) molecule with slight increase of B-C distance until the whole H-H-H system goes in the transition state in the low potential energetic region. Some product forms and the atom H(C) moves away until the maximum value of B-C distance as about 1.37 a.u. Then the reaction goes back to the reactant side with strong vibration. Therefore, the overall reaction is not reactive as the formed product will rapidly recross to form reactant.

In the Figure 13, the initial AB momentum is slightly larger than the setting in the reaction shown in Figure 12. However, the small change of AB momentum makes the reaction reactive. The H(A) atom move towards B-C molecule and collides it to get in transition state. Both of the distances of A-B and B-C are small. Then the atoms repels a lot and the reaction recross a little to the reactant side. When the potential energy of the system gets high and the distance of AB and BC get long, the reaction goes back to the product side again. Finally, the reaction would end in forming product, molecule H(A)-H(B) with movement of atom H(C) from the product with strong oscillation.
State what are the main assumptions of Transition State Theory. Given the results you have obtained, how will Transition State Theory predictions for reaction rate values compare with experimental values?
Answer:
The Transition State Theory assumes[1]:
1. Quantum-tunneling effects are assumed negligible.
2. The Born-Oppenheimer approximation is invoked.
3. The energy of atoms in the reactant is considered as Boltzmann distributed.
4. Once the system attains the transition state, the reaction would not go back to the reactant side again.
Comparison of experimental value and the TST:
1. In the actual experiment, the reaction can recross back to reactant but the TST states that the system would not reenter in the reactant region after reaching the transition state. Therefore, the experimental rate of reaction should be lower than the theoretical value, as many actual reaction cannot take place in the experiment.
2. The ideal atom energy distribution is Boltzmann distribution. However, the actual energy is more random. As the experimental model is quite large, the atom energy distribution is not contribute too much in the reaction rate.
3. The quantum tunneling take place in the actual experiment, especially for the light atoms . The energy of an atom decreases over the barrier rather than bounce. The actual energy of each atom may not as high as the theory, so less atoms reach the activation energy and the rate of reaction is less than theoretical.
F-H-H system
PES inspection
Classify the F + H2 and H + HF reactions according to their energetics (endothermic or exothermic). How does this relate to the bond strength of the chemical species involved?
Answer:
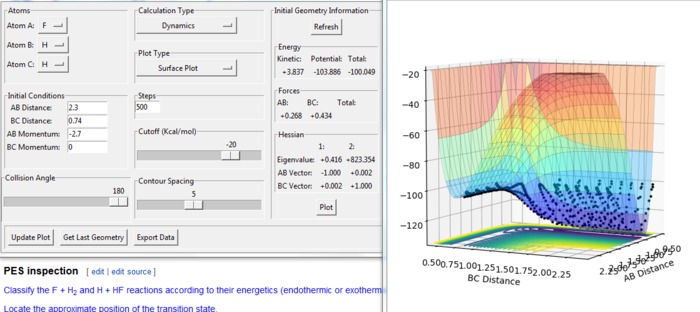
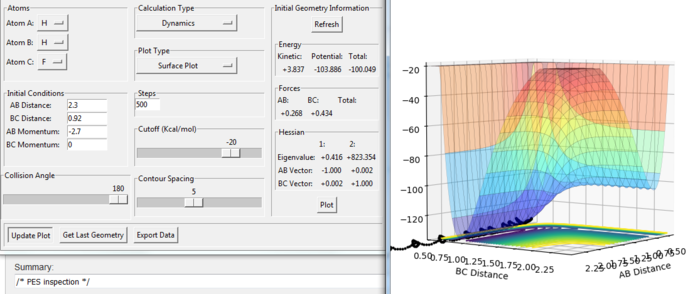
E(H-H) = 432 kJ/mol
E(H-F) = 565 kJ/mol
r(H-H) = 74 pm
r(H-H) = 92 pm
The F + H2 reaction is exothermic. From the figure. 14, the energy of the product is lower than the energy of the reactants. The H + HF reaction is endothermic. From the figure. 15, the energy of the product is higher than the energy of the reactants. The H-F bond is stronger than H-H bond as the dissociation energy of H-F is larger than that of H-H. The H-F requires more energy to break so the H-F molecule is more stable than the H-H.[2]
Locate the approximate position of the transition state.
Answer:
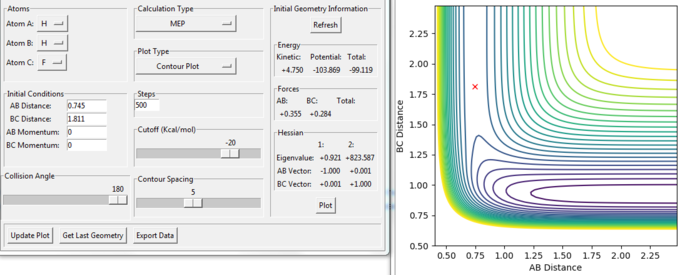
For the reaction of F + H2:

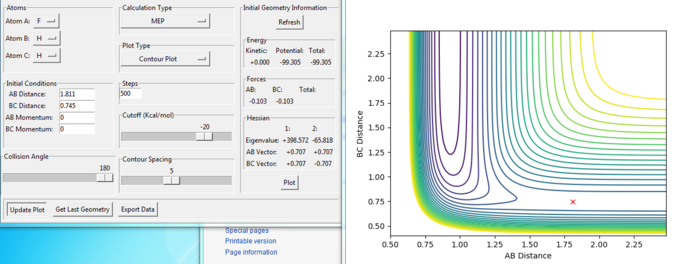
The transition state of the reaction of F + H2 was modified at the position:
rAB = 1.811 a.u.
rBC = 0.745 a.u.
To find the position, the dynamic and mep trajectory with the initial distance and no momentum was calculated and the trajectory for the transition state would not have any reaction going shown in the diagram. From the Figure. 16 and 17, the reaction shows only a cross in each of the figures, which means the reaction would not go to either the reactant or the product side. Because at the transition state, the gradient of the potential energy is considered as zero.

The transition state of the reaction of F + H2 was modified at the position:
rAB = 0.745 a.u.
rBC = 1.811 a.u.
This reaction is the reverse reaction of F + H2. Therefore, the transition state has the same distance between the same atoms. As the F and H at position A and C are rearranged in the position C and A in this reaction, the rAB and rBC values exchanged compared with the last reaction shown above.
Report the activation energy for both reactions.
Answer:

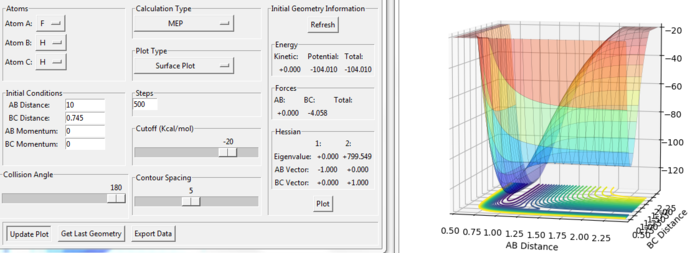
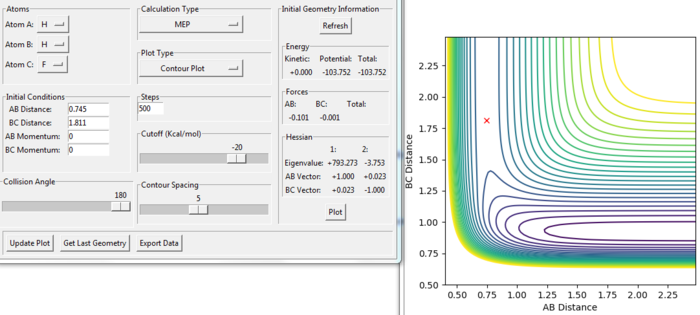
E(transition state) = -103.752 kcal/mol
E(F+H2) = -104.010 kcal/mol
Ea of F+H2 = -103.752-(-104.010) = +0.258 kcal/mol
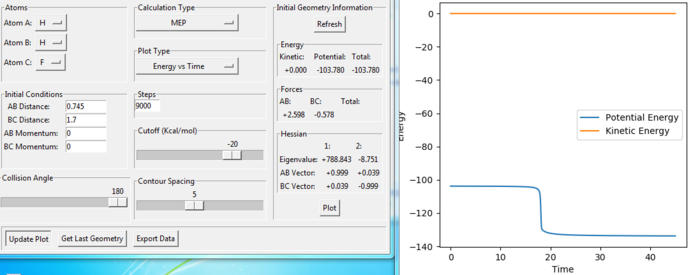
E(H+HF) = -133.756 kcal/mol
Ea of H+HF = -103.752-(-133.756) = 30.004 kcal/mol
Reaction dynamics
Energy Release
In light of the fact that energy is conserved, discuss the mechanism of release of the reaction energy. How could this be confirmed experimentally?
Answer:
The energy is conserved. In this reaction, the translational energy of A-B is expected to transfer in vibrational form, as the vibration of the product is much stronger than the reactant. The vibrational energy of B-C is considered to transfer in translational energy. From the animation, the H2 molecule vibrates and move to F atom until the collision of the F atom and the H2 molecule. After the collision, the HF molecule forms and vibrate strongly along with moving away of the separate H atom.
To confirm it experimentally, IR spectrum could be used as IR indicates the vibration of bonds. The IR of reactant and the product should be tested separately and compared them. The stronger vibration of a molecule has, the higher wavenumber shows in the IR spectrum.
Effect of momentum in reaction
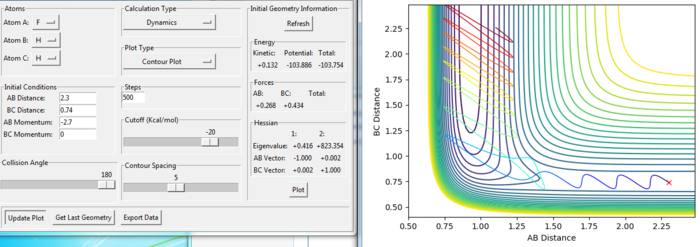
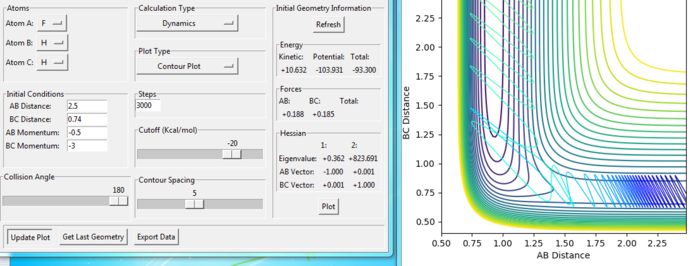
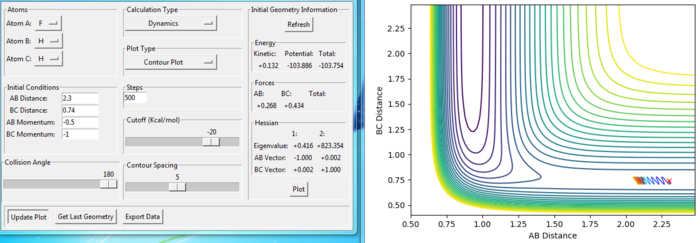
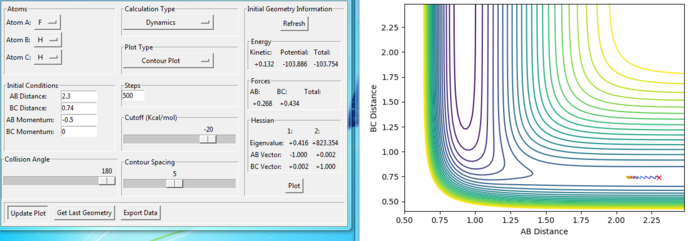
Setup a calculation starting on the side of the reactants of F + H2, at the bottom of the well rHH = 0.74, with a momentum pFH = -0.5, and explore several values of pHH in the range -3 to 3 (explore values also close to these limits). What do you observe?
Answer:
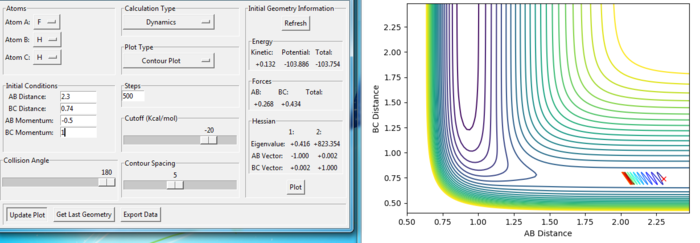
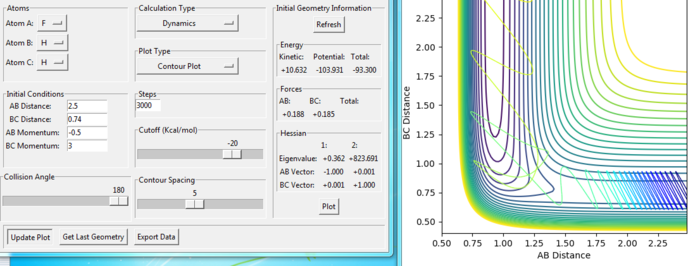
As the magnitude of initial momentum setting gets large, the BC distance vibrate more and the reaction can goes further. The momenta in the reaction provide the main energy to reach the activation energy in the reaction. When the momentum of BC is set as -3 or 3, the reaction is reactive. When the magnitude of the momentum is less, the reactions are not reactive.
The figures with changing of p2:


For the same initial position, increase slightly the momentum pFH = -0.8, and considerably reduce the overall energy of the system by reducing the momentum pHH = 0.1. What do you observe now?
Answer:
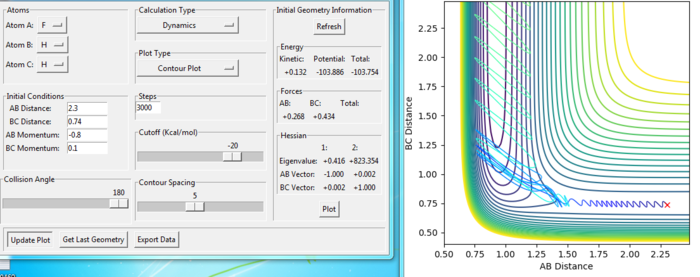
The trajectory recrosses a lot in the reaction but goes to the product in the end, which means that the reaction is reactive. Compared with the reaction in last section with pHH = -2 and pFH = -0.5, the total energy is less, but the reaction is more reactive. Because, the F+H2 reaction has a early transition state, where the kinetic energy effects more.
Relationship of energy type and reaction rate
Discuss how the distribution of energy between different modes (translation and vibration) affect the efficiency of the reaction, and how this is influenced by the position of the transition state.
Answer:
The F+H2 reaction is exothermic reaction, which is a reaction with an early barrier. In the H+HF reaction, the translational energy effects but the vibrational energy does not effect. For the early transition state, the vibration energy could provide energy to get the transition state, but the reaction would like to recross to reactant rapidly.
The H+HF reaction is endothermic reaction, which is a reaction with a late barrier. In this reaction, the vibrational energy effects but the translational energy does not effect. For the late transition state, change in vibratioinal energy effects a lot in the reaction to take place. More translation energy leads to a lot of recrossing but hard to overcome the barrier and end in product.
Reference
- ↑ T. Bligaard, J. K. Nørskov, in Chemical Bonding at Surfaces and Interfaces (Elsevier, 2008), pp. 255–321
- ↑ http://www.wiredchemist.com/chemistry/data/bond_energies_lengths.html
