MRD:ST3515PL
H + H2 System
Dynamics from Transition State
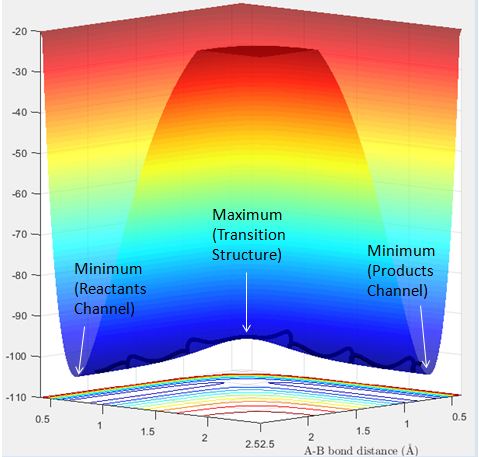
The transition state and minimum are the maximum point and minimum point on the minimum energy path respectively. At the transition structure and at a minimum, the total gradient of the potential energy surface is 0. Hence trajectories that begin at these points with no momenta will remain at those points.
Transition structures can be distinguished by starting trajectories with no initial momentum near the transition state and observing whether they move towards the reactants or products channel. The transition state will be between a starting point at which it rolls towards the reactant channel and a starting point at which it rolls towards the product channel. The minimum can be located as where it rolls to.
Transition State Position
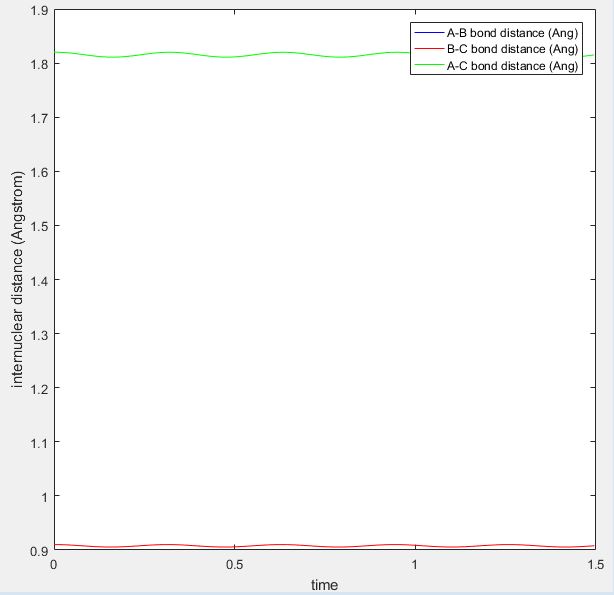
The transition state position for the H + H2 surface is estimated to be when r1 and r2 = 0.91 Å. The values of r are expected to be the same as the system is symmetrical. At this value of r, the atoms (with no initial momenta) oscillate at the maximum point on the minimum energy path and do not move away from this point. Hence it is expected that in the internuclear distance vs time plot (shown below), the BC and AB distances remain constant, as this would correspond to the atoms remaining at the maximum point.
MEP and Dynamics
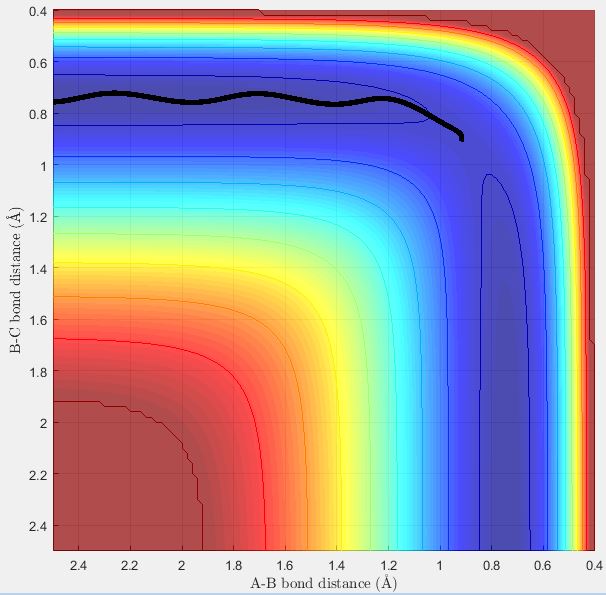
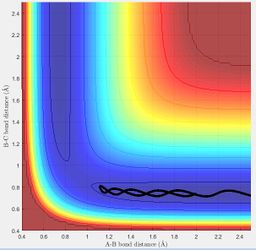
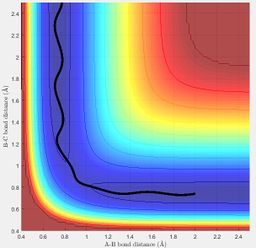
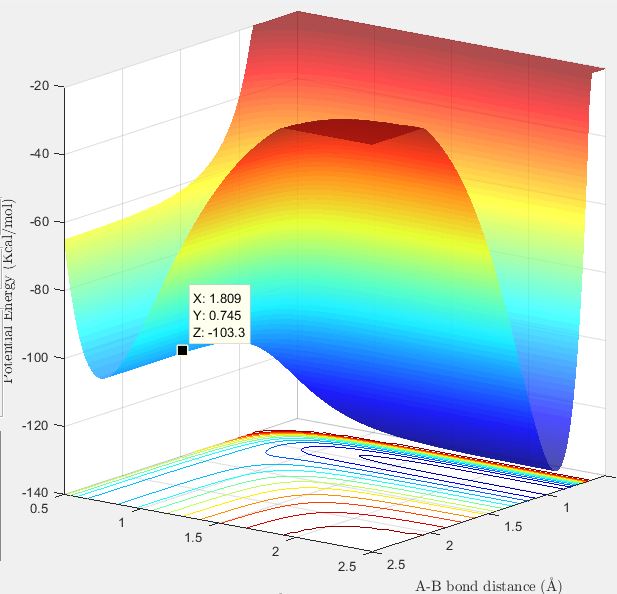
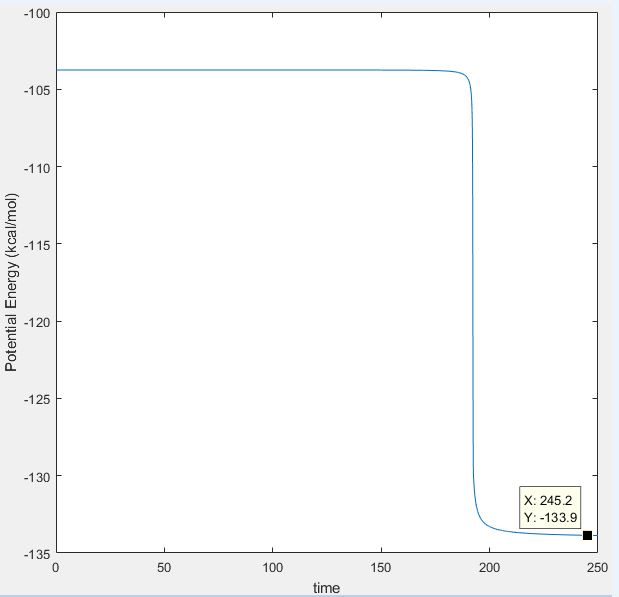
MEP shows the direction that the reaction proceeds to on displacing the system slightly from the transition state position; if the trajectory moves towards the products channel then the reaction is forming the products and vice versa. It shows the translational motion of the system. Dynamics shows the direction that the reaction proceeds to and also how the potential energy of the system changes due to the vibrational and translational motion of the particles. The first plot below shows the MEP surface plot and the second plot below shows the dynamics surface plot.
Transition State Theory
Transition state theory assumes that products will form from the reactants once the transition state has been reached. In other words, barrier re-crossing does not occur.1 However, from the results obtained above, crossing of the activation barrier does not necessarily lead to product formation because the barrier can be re-crossed to form the reactants again. Hence reaction rates predicted by the transition state theory will be higher than the experimental values because in experiments, barrier re-crossing can occur and lead to unsuccessful reactions.
F-H-H System
The reaction between F and H2 results in the formation of HF and H. This involves breaking a H2 bond (absorbing energy) and forming a stronger HF bond (releasing energy). More energy is released than absorbed and hence the reaction is exothermic.
The reverse reaction to form F and H2 from HF and H is an endothermic reaction, as now more energy is absorbed to break the stronger HF bond than released to form the weaker H2 bond.
Transtion State Position
Using Hammond's postulate, it is expected that the transition state will resemble the reactants more than the products for an exothermic reaction, and vice versa for an endothermic reaction. Hence the transition state position should involve having a greater HF internuclear distance than H2 internuclear distance.
The transition state position is estimated to be when the HF (AB) internuclear distance is 1.81 Å and HH (BC) internuclear distance is 0.745 Å. The internuclear distance vs time plot of trajectories started at these internuclear distances, and with no initial momenta, shows that the internuclear distance remains constant over time as expected for a system at the transition state position.
Activation Energy
The data cursor was used to identify the potential energy at the transition state position and the minimum potential energy in the reactants channels for both reactions.
Activation energy to form HF and H : 103.9-103.3 = 0.6 kcal/mol
Activation energy to form H2 and F : 133.9-103.3 = 30.6 kcal/mol
MEP was also used to find the minimum energy in the reactant channels and the same results were observed. Below shows the MEP surface plot when the system was displaced from the transition structure towards the H2 and F side, and shows that the minimum potential energy in that channel is -133.9 kcal/mol.
Reaction Dynamics
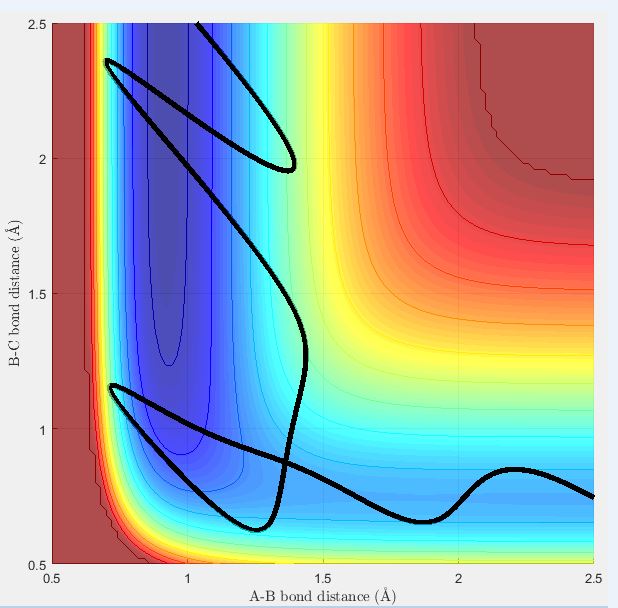
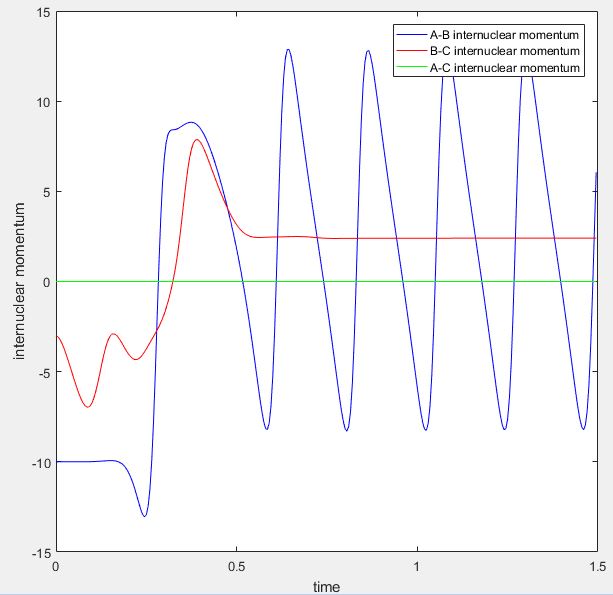
A reactive trajectory for the reaction between H2 and F was identified when the conditions below were used:
HF internuclear distance : 2.5 Å
HH internuclear distance : 0.745 Å
HF internuclear momentum : -10
HH internuclear momentum : -3
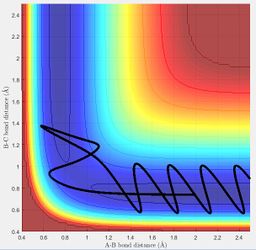
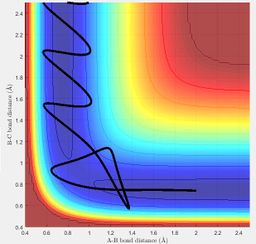
Below shows the surface plot and internuclear momentum vs time plot for the reactive trajectory. The internuclear momentum vs time plot shows that initially the HH (BC) internuclear momentum oscillates (there is a bond between the two Hs) and the HF (AB) internuclear momentum is constant (no bond between F and H). After the activation barrier is crossed, the HH internuclear momentum now becomes constant and the HF internuclear momentum oscillates. This corresponds to product formation because it shows that the HH bond has been broken and that the HF bond has formed.
This reaction is an exothermic reaction and the energy released becomes vibrational energy in the HF bond. This can be confirmed using IR spectroscopy, where excitation of vibrational states higher than the ground vibrational state of HF will be observed (overtones).
Transition State Position and Distribution of Energy
The relative amounts of translational energy and vibrational energy affect whether a trajectory is reactive. The relative amounts of translational and vibrational energy required for a successful reaction is influenced by whether the transition state is early or late, as stated in Polanyi's rules.2
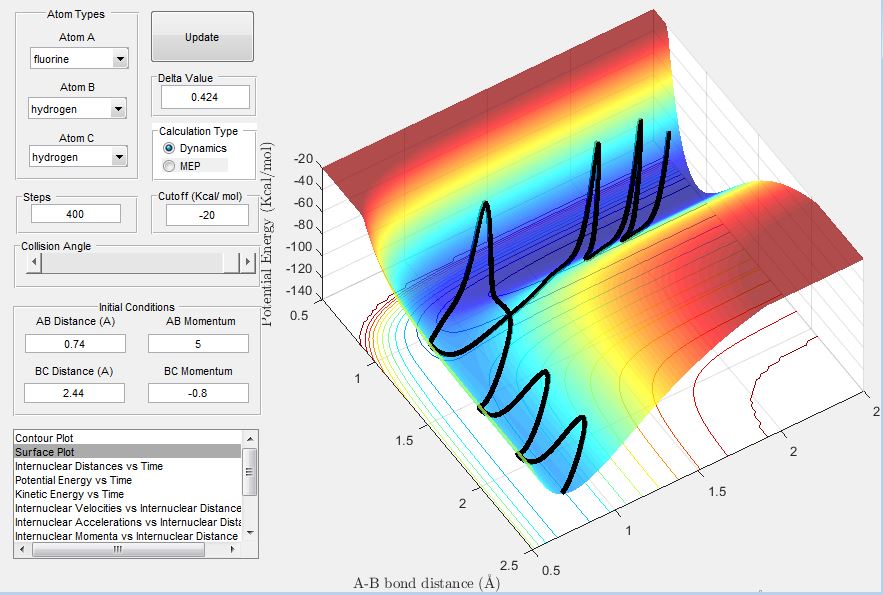
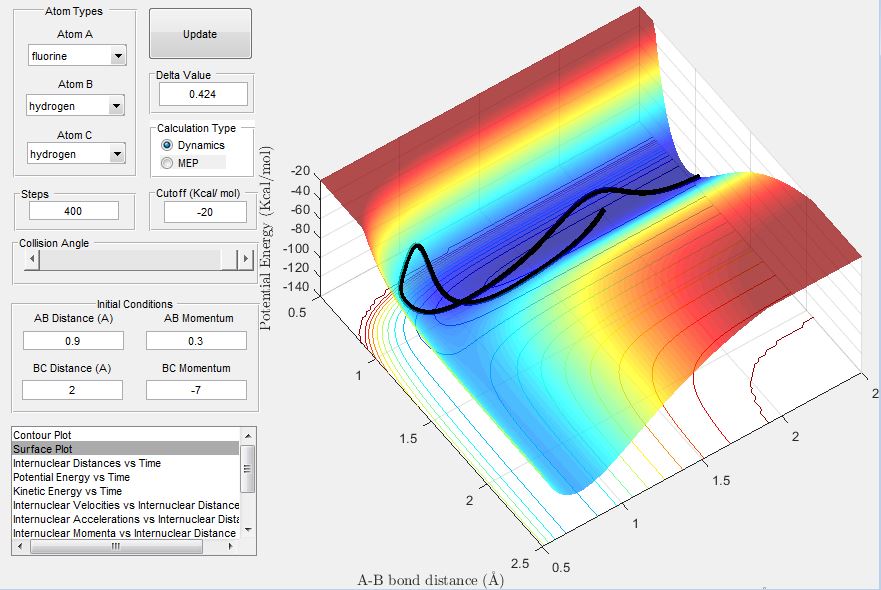
The exothermic reaction between F and H2 has an early transition state and translational energy is more efficient in promoting this reaction. Hence when a relatively high momentum and low momentum was used for HF and HH respectively, the trajectory showed a successful reaction, as this corresponds to the system having higher translational energy than vibrational energy.
On the other hand, when the HF momentum was decreased and the HH momentum increased, a successful reaction did not occur.
Vibrational energy is more efficient in promoting the endothermic reaction between HF and H, which has a late transition state. When the HF momentum was high and the HH momentum low, a successful reaction occurred as this corresponds to the system having higher vibrational energy than translational energy.
On increasing the translational energy by increasing the HH momentum and decreasing the vibrational energy by reducing the HF momentum, a successful reaction was not observed.
References
1. T. Komatsuzaki, M.Nagaoka, J. Chem. Phys.,1996, 105 (24), 10838-10848.
2. Z. Zhang, Y. Zhou, D. H. Zhang, G. Czakό, J. M. Bowman, J. Phys. Chem. Lett.,2012, 3 (23), 3416-3419.

