
MRD:SS6416
Exercise 1: H - H - H system
1. What value do the different components of the gradient of the potential energy surface have at a minimum and at a transition structure? Briefly explain how minima and transition structures can be distinguished using the curvature of the potential energy surface.
The different components of the gradient of the potential energy at the minimum and at the transition state have a value of zero. Minima have upwards curvature and transition states have downwards curvature. This can be investigated through taking the second derivative of the potential energy surface at that point, to differentiate between minima and transition states.
Mm10114 (talk) 21:49, 28 May 2018 (BST) That is a quite good anwer. You should've state how the second derivatives can be used to differentiate between minima and transition state, what are the expected values here?
2. Report your best estimate of the transition state position (rts) and explain your reasoning illustrating it with a “Internuclear Distances vs Time” plot for a relevant trajectory.
The best estimate of the transition state position is when r1=r2=0.908 Å. Using the initial trajectory, the transition state position was found to be roughly 0.94 Å. Using the Internuclear Distances vs Time Plot, the the AC and BC distance were varied, so as to minimise the amplitude of the oscillations, so that the distances did not change. This is because at the transition state, the distances should not change as the reaction should not move towards the reactants or products as there is no momentum.
Mm10114 (talk) 21:49, 28 May 2018 (BST) Short and nice.
-
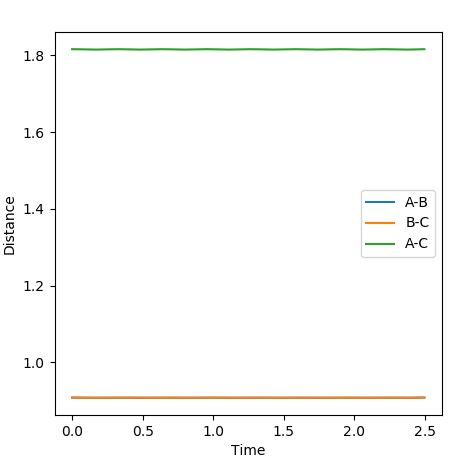
Figure 1 - Internuclear Distances vs Time Plot demonstrating the transition state's presence due to very little or no oscillation

3. Comment on how the mep and the trajectory you just calculated differ.
In the mep calculation, the reactants went down to the minimum energy path, preventing the molecules from oscillating between each other. The minimum energy path is representative of the 2D energy profile of a reaction typically drawn. In the dynamics calculation, the reactants went down in a similar fashion but then oscillated down the path, due to repulsion between the atoms and potential energy.
Mm10114 (talk) 21:49, 28 May 2018 (BST) This is a pretty good explaining it. However, you should pay more attention into details. You wrote "preventing the molecules from oscillating between each other". But, you have a tri-atomic system -> one molecule H2 and a single atom H, be careful with wording. Also, could make it more clear what is oscillating here, the bond length? or the molecule - atom distance? Finally, the most important part is why that is that in MEP you don't observe oscillations? Good observation with MEP being a representative of the 2D energy profile. But then why MEP is and why dynamics calculations isn't? Any comment on the velocities?
4. Complete the table by adding a column with the total energy, and another column reporting if the trajectory is reactive or unreactive. For each set of initial conditions, provide a plot of the trajectory and a small description for what happens along the trajectory.
| p1 | p2 | Total Energy/kcal/mol | Reactive? |
|---|---|---|---|
| -1.25 | -2.5 | -99.119 | Reactive |
| -1.5 | -2.0 | -100.456 | Unreactive |
| -1.5 | -2.5 | -98.956 | Reactive |
| -2.5 | -5.0 | -84.956 | Unreactive |
| -2.5 | -5.2 | -83.416 | Reactive |
In the case where p1= -1.25 and p2= -2.5, the system is reactive, as the reactants continue through to the products while oscillating with low amplitudes.
-
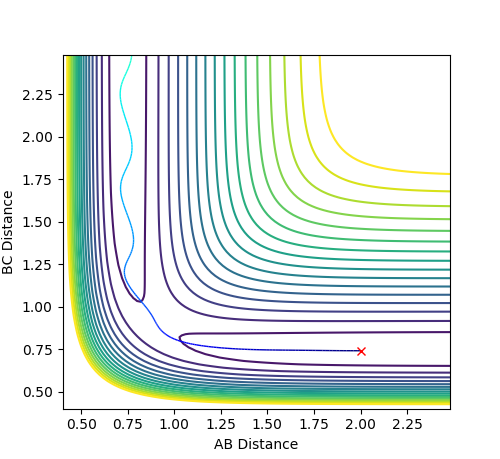
Figure 2.1 - Reactive Contour plot of p1= -1.25 and p2= -2.5

In the case where p1= -1.5 and p2= -2.0, the system is unreactive, as the reactants do not reach the transition state, but instead oscillate back down to the reactants with small amplitudes again.
-
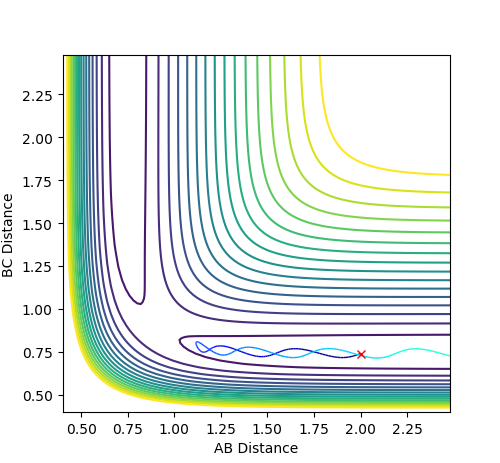
Figure 2.2 - Unreactive Contour plot of p1= -1.5 and p2= -2.0

In the case where p1= -1.5 and p2= -2.5, the system is reactive, as the reactants continue through to the products while oscillating at a higher amplitude than that of the first case.
-

Figure 2.3 - Reactive Contour plot of p1= -1.5 and p2= -2.5

In the case where p1= -2.5 and p2= -5.0, the system is unreactive, as the reactants cross the transition state towards the products while oscillating violently but then oscillate back down to the reactants, recrossing the transition state again.
-

Figure 2.4 - Unreactive Contour plot of p1= -2.5 and p2= -5.0

In the case where p1= -2.5 and p2= -5.2, the system is reactive, as the reactants cross the transition state towards the products while oscillating violently. The molecules then recross the transition state, before crossing the transition state again, oscillating with high amplitudes towards the products.
-
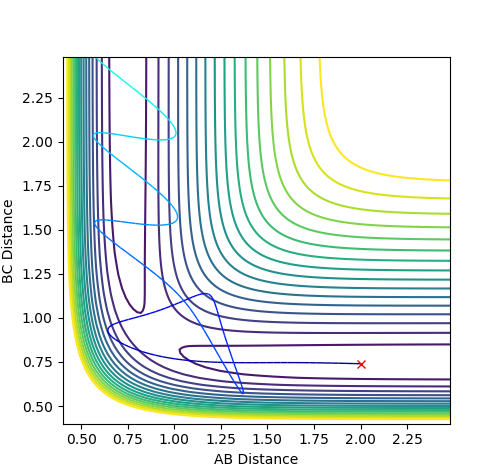
Figure 2.5 - Reactive Contour plot of p1= -2.5 and p2= -5.2

Mm10114 (talk) 21:49, 28 May 2018 (BST) All these are good observations. You could've wrote a sentence or two summarising your observations and drawing some conclusions. As both 4th and 5th reactions have high initial momenta (p1 and p2) higher then the first three, but one is reactive and one is not, what could you tell me about that?
5. State what are the main assumptions of Transition State Theory. Given the results you have obtained, how will Transition State Theory predictions for reaction rate values compare with experimental values?
The three main assumptions are: 1. The atomic nuclei obey classical mechanics only 2. All molecules that cross the transition state form products. 3. The system will cross the transition state at the lowest energy transition state.
The transition state saddle point is the energy maximum on the mep, so the height of this barrier does have an effect on the overall rate of reaction. However, the assumption reaction system following the mep, is only true at low temperatures. At higher temperatures, the kinetic energy of the system increases, allowing more vibrational modes to be populated. Therefore the system may cross the transition state at higher energies than the saddle point[1].
Furthermore, the assumption that only classical mechanics is obeyed is invalid, as systems with insufficient energy to cross the transition state have the ability to tunnel through the barrier with a certain probability in a quantum effect. This is not accounted for in the TST. The probability that the system tunnels through the barrier is governed by the height of the barrier and the mass of the atoms tunnelling. Despite the low mass of the H-H-H system, the probability of tunnelling is still quite low. This is expected to underestimate the rate of reaction marginally.
The assumption that the system is only able to form products once it crosses the transition state is invalid, as the system is able to recross the transition state and reform the reactants. I would expect this to heavily overestimate the rate of reaction with respect to the rate of reaction. Therefore, overall, I would expect the TST values to be higher than the experimental values.
Mm10114 (talk) 21:49, 28 May 2018 (BST) Well done.
Exercise 2: F - H - H system
1. Classify the F + H2 and H + HF reactions according to their energetics (endothermic or exothermic). How does this relate to the bond strength of the chemical species involved?
The reaction between F and H2 is exothermic, as the products are lower in energy than the reactants. This is due to the strong bond enthalpy of H-F, as there is a large electronegativity difference, meaning that there is a large amount of ionic character in the bond, strengthening it, making the products lower in energy.
The reaction between H and HF is endothermic, as the reactants are lower in energy than the products. This is again due to the product H2 being a diatomic molecule, and therefore there is no ionic character in the bond, so it is purely covalent and therefore weaker than the reactant HF, so it is higher in energy.
-

Figure 3 - Surface Plot of forward reaction showing reactants F + H2 higher in energy than products H + HF

As demonstrated in the surface plot above of the reaction of F + H2, The reactants are higher in energy than the products, so the process is exothermic.
2. Locate the approximate position of the transition state
In order to find the transition state of an asymmetric reaction, the Hammond's Postulate was used, which states that the transition state would resemble the species closest in energy. Therefore, for this system, the transition state would resemble the F + H2 species, more than the H + HF species. As we can see from the surface plot below, the transition state lies with a H-H distance of about 0.746 Å and the F-H distance of about 1.810 Å.
-
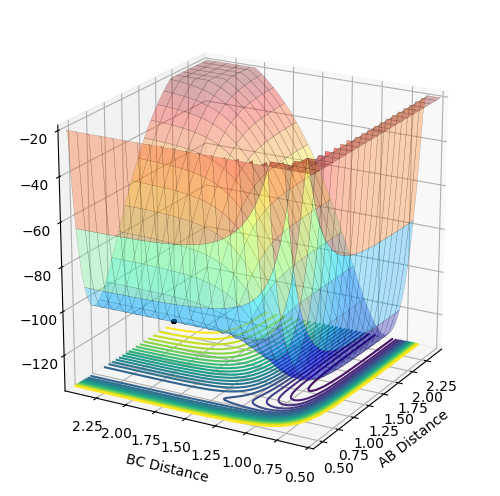
Figure 4 - Surface Plot showing molecules starting at the unstable transition state

3. Report the activation energy for both reactions.
The activation energy is defined as the difference in potential energy between the reactants and the transition state.The potential energy of the transition state is -103.75 kcal/mol.
For the reaction of F + H2, the energy of the reactants is -104.02 kcal/mol. This gives an activation energy of 0.27 kcal/mol, which is equivalent to 1.13 kJ/mol.
For the reaction of H + HF, the energy of the reactants is -134.00 kcal/mol. This gives an activation energy of 30.25 kcal/mol, which is equivalent to 126.57 kJ/mol.
4. In light of the fact that energy is conserved, discuss the mechanism of release of the reaction energy. How could this be confirmed experimentally?
For the reaction F + H2, the initial conditions were set as F-H distance of 2.0 Å and H-H distance of 0.75 Å, with momenta p1= -2.5 and p2= -1.5. The potential energy contour plot is shown below:
-
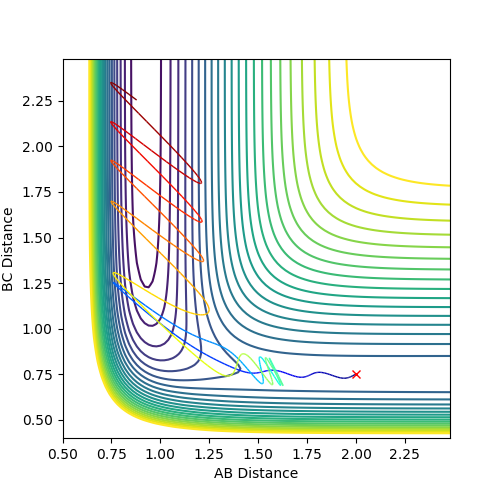
Figure 5.1 - Contour Plot showing forward reaction going to completion with initial conditions stated above

Using this plot, the reactive mechanism was deduced. Given that the system starts with high potential energy and some kinetic energy. As the kinetic energy exists in two forms by the Born-Oppenheimer Approximation, vibrational and translational energy. We can see by the small amplitudes of oscillations, there is some small vibrational kinetic energy initially. The fact that the atom and molecule move together, suggests there is some translational energy too.
Once the system crosses the transition state initially, it comes back over the transition state temporarily, before going back over the transition state again, so the system is reactive. Due to the the large drop in potential energy and the fact that energy is conserved, there is much more kinetic energy available to the HF molecule and the H atom. The large amplitudes of the oscillations of the products, suggest that the frequency of the oscillations is increased and the amount of vibrational energy is increased also, so higher vibrational modes are populated. The system quickly goes to increase the H-H distance significantly, suggesting that there is much more translational energy.
This is demonstrated in the Internuclear Momentum vs Time and Energy vs Time Plots below:
-
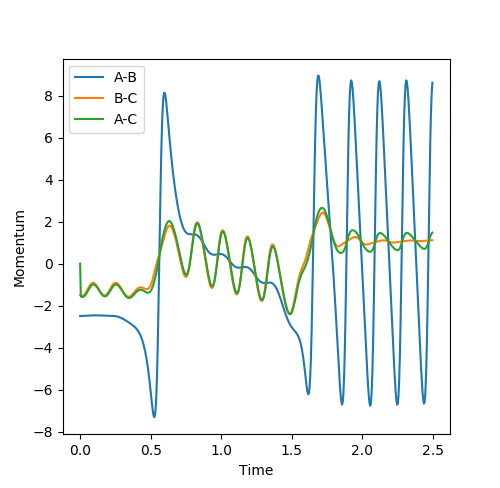
Figure 5.2 - Internuclear Momentum vs Time Plot -
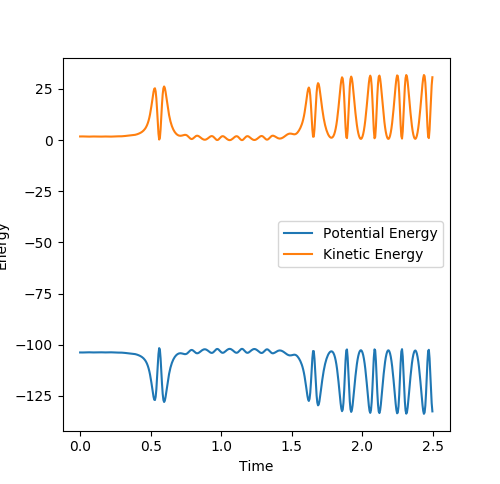
Figure 5.3 - Energy vs Time Plot


We expect the change in energy to be independent of the path taken, thus the recrossing of the transition state has no effect upon the overall change of potential and kinetic energy. The loss of potential energy and gain of kinetic energy is shown in the above figures. From the gain of kinetic energy, we can see that there is more vibrational energy, with more vibrational modes populated and more translational energy. It would be possible to confirm this experimentally, through IR spectroscopy, as some infra-red radiation would be emitted by the products as they decay to the ground state by internal conversion, which would be detected by the spectrometer. Another way of experimentally confirming this would be by detecting the change in temperature due to the increased the translational energy, as the average energy of the products will have increased with respect to the reactants[2].
5. Discuss how the distribution of energy between different modes (translation and vibration) affect the efficiency of the reaction, and how this is influenced by the position of the transition state.
In the initial conditions, the AB momentum is reflective of the translational energy and the BC momentum is reflective of the vibrational energy.
Polanyi's rules state that the presence of vibrational energy is more important than the presence of translational energy in making a reaction with a late transition state go to completion. In this case, the reaction with the late transition state is the reaction between H and HF. For this system, having a high translational energy and a low vibrational energy means that the system hits the high wall of the potential energy surface, being repelled back towards the reactants as shown below:
-

Figure 6.1 - Contour Plot showing unreactive reverse reaction with high translational energy and low vibrational energy

If the same reactants have a high amount of vibrational energy and low translational energy, then the reaction goes through to completion as shown below:
-
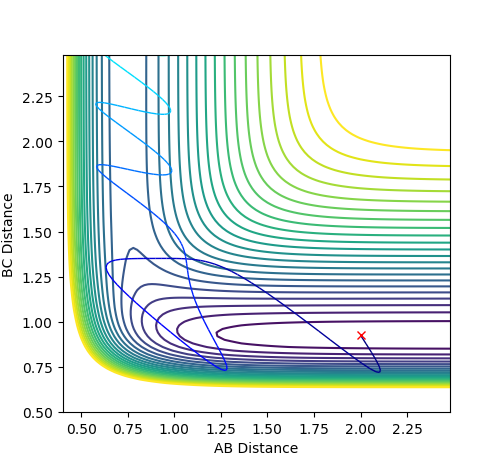
Figure 6.2 - Contour Plot showing reactive reverse reaction with low translational energy and high vibrational energy

Conversely, for reactions with an early transition state, Polanyi's rules state that the presence of translational energy is more important than the presence of vibrational energy[3]. In this case, the reaction between F and H2 corresponds to a reaction with an early transition state. For this system, a high vibrational energy, with a low translational energy, results in the molecules vibrating along the reaction path without overcoming the activation energy as shown below:
-

Figure 6.3 - Contour Plot showing unreactive forward reaction with low translational energy and high vibrational energy

However, if the same molecules have a high translational energy and low vibrational energy, the reaction goes through to completion as predicted by Polanyi's rules.
-
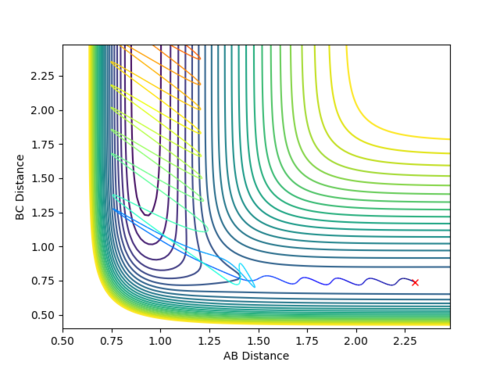
Figure 6.4 - Contour Plot showing reactive forward reaction with high translational energy and low vibrational energy

- ↑ Anslyn, Eric V.; Doughtery, Dennis A., Transition State Theory and Related Topics. In Modern Physical Organic Chemistry University Science Books: 2006; pp 365–373
- ↑ P. Atkins and J. P, Paula, Atkins’ Physical Chemistry, Oxford University Press, Oxford, 10th edn., 2014.
- ↑ J. I. Steinfeld, J. S. Francisco and W. L. Hase, Chemical Kinetics and Dynamics, Prentice Hall, 1999.