MRD:SJ1815
Molecular Reaction Dynamics
Transition State Theory-an overview
- Developed by Eyring [1]
- Reactants are in constant equilibrium with the activated complex, which is unstable and unisolatable.[1]
- ΔG‡=-RTln(K‡)[1]
- Rate constant of activated complex formation, k, can be expressed as k=((kBT)/h)K‡[1]
- Overall, k=((kBT)/h)eΔS‡/Re-ΔH‡/RT[1]
Exercise 1
Initial reaction conditions
A head-on collision can be monitored through the program 'lepsgui',[2] where we vary the parameters of initial momenta of both colliding bodies and the initial interatomic distance. This gives a good approximation to the reaction of H2+H--->H+H2
A contour plot of the initial conditions given is shown below
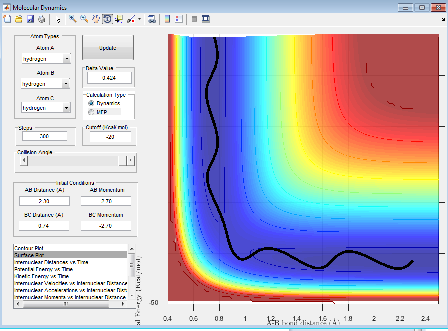
Figure 1: A surface plot showing a successful reaction between H2 and H.
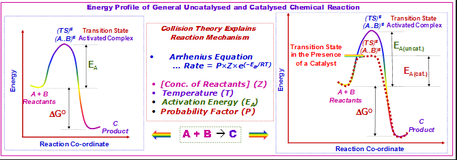
The bold, wiggly line shows the reaction trajectory. The x-axis shows the A-B bond distance, so we can see how it is roughly constant until collision with C, forming an A-C (or C-B bond, depending on the way you've labelled the atoms) and an atom of A. This line is the reaction trajectory due to the fact that it lies on a saddle point of the potential energy surface diagram, where dy/dx =0 in all directions. At the transition state, the potential energy is still at a saddle point, but will quickly decay to either reactants or products with any small perturbation. This means that to find the difference between transition states and reactants/products, we must take the second derivative, with respect to position, of the potential energy, as this tells us the rate of change of the gradient, which is positive for reactants/products in all directions and a saddle point for a transition state. A quick reminder of what a 2D PE plot looks like is shown below. Here we can see that at both reactants, products and transition states, dy/dx =0.
(The definition of a minimum and a transition state can be extended for any number of coordinates, not just one. You should find the exact definition of these stationary points Tam10 (talk) 17:46, 16 May 2017 (BST))
Figure 2: A 2D potential energy plot for comparison with the 3D plot taken from[3]
The transition state
At the transition state, the distances between all atoms are equal (A-B=B-C). Therefore, this means that we can plot internuclear distances vs. time and see where both values are equal. This is at about 1Å (see below).
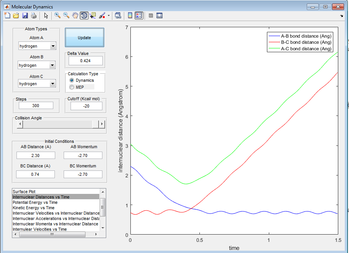
Figure 3: A plot showing internuclear distance against time.
Better estimates can be obtained by setting momenta for A-B and B-C to zero and then making sure that A-B and B-C distances are equal, while minimising the reaction trajectory from a line to a dot. This gives an estimate of 0.908Å
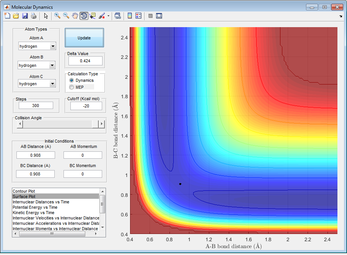
Figure 4: A surface plot showing a successful reaction between H2 and H.
The reaction path can be found by displacing the reaction from the transition state ever so slightly. This was achieved by setting A-B to 0.918 and B-C to 0.908Å. This shows a trajectory that follows the floor of the PE surface to the products.
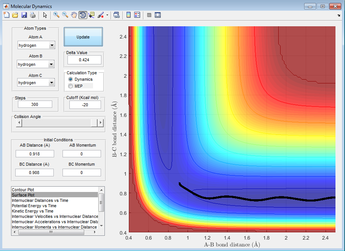
Figure 5: A surface plot showing the MEP using a 'Dynamics' calculation type.
Note: This was done using 'Dynamics' calculation type.
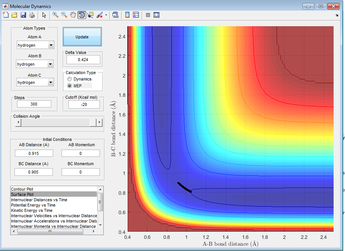
Displacement using the MEP calculations type gives the plot below
Figure 6: A surface plot showing the MEP using the 'MEP' calculation type.
It can be seen that the Dynamics calculation set gives a longer reaction trajectory showing the eventual formation of products.
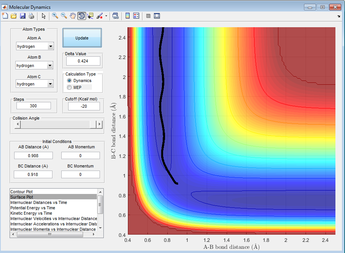
Changing the initial conditions to the other way around (displacing B-C rather than A-B) gives a trajectory which falls back into the reactants.
Figure 7: A surface plot showing the MEP using a 'Dynamics' calculation type while transposing coordinates.
Do all trajectories give reactions?
Figures 8-12: Various surface plots showing different initial conditions.
Assumptions of transition theory
- Atoms behave classically.[4]
- Reactants are in a minimum along a reaction coordinate.[4]
- There can be no recrossing of the transition state (it has reacted once it has crossed the transition state)[5]
(Expand on this. What is the significance of each of these points and which ones relate to/conflict with what you have tested above? Tam10 (talk) 17:46, 16 May 2017 (BST))
Exercise 2
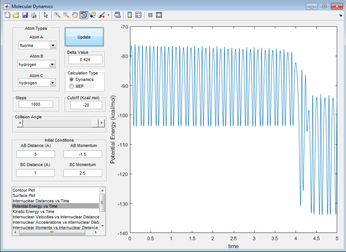
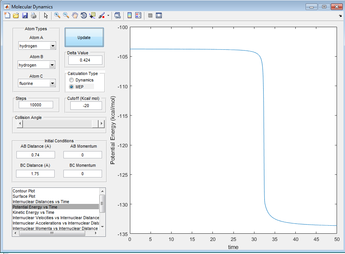
Looking at a plot of potential energy against time, we can see that the PE decreases, indicating an exothermic reaction (energy must be conserved so the extra energy must be released as heat). The difference is about 30kcalmol-1, which is 125.6kJmol-1[6]. Looking at bond dissociation energies, the H-H bond takes 432kJmol-1[7] to dissociate but there is 565kJmol-1[7] released on the formation of H-F, so overall there is a release of 133kJmol-1, which is a good match.
(This is good. The first report I've come across to compare with experimental here Tam10 (talk) 17:46, 16 May 2017 (BST))
Figure 13: A PE against time plot for the reaction H2+F--->HF+H
The transition state (for the endothermic reaction)
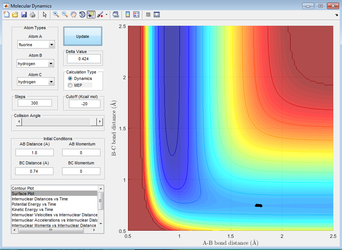
To find the transition state, an initial guess of A-B=2Å and B-C=0.74Å was made (it was known by Hammond's postulate [8] that the transition state would probably be early, as HF bonds are strong and the reaction is probably exothermic). This gave the plot below.
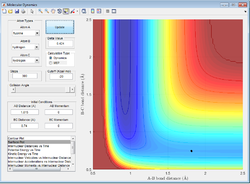
Figure 14: A surface plot showing the initial guess made for the transition state.
This shows me that the transition state lies to the left of the plot shown (below A-B=2Å), as the reaction proceeds to completion. Further guesses put the transition state around A-B=1.8, giving the plot below.
Figure 15: A surface plot showing a further guess for the transition state.
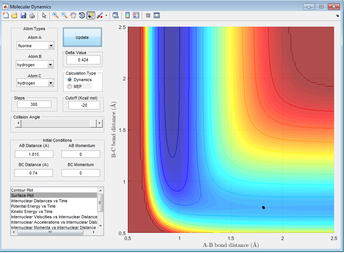
Even more guesses give a transition state of 1.815Å with great accuracy (the trajectory becomes a dot).
Figure 16: A surface plot showing the transition position for the reaction H2+F--->HF+H
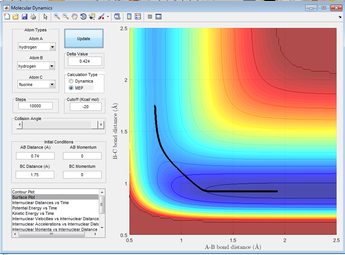
The activation energy for the reaction can be predicted using the PE diagram with the MEP, while displacing the reacting species from the transition state slightly. A step number of 10000 and a B-C distance of 1.75Å gives the PE diagram shown below. This corresponds to the activation energy of the endothermic reaction, giving an activation energy of 30kcalmol-1 or 125.6kJmol-1[6].
Figure 17: A surface plot showing the MEP using an 'MEP' calculation type.
Figure 18: A surface plot showing the PE against time for the endothermic reaction.
The exothermic reaction
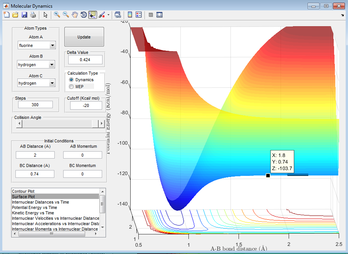
The reverse reaction's activation energy can be found using the data cursor. Typing in the exact coordinates of the transition state at 300 steps gives this plot
Figure 19: A surface plot showing the transition position for the reaction H2+F--->HF+H
Using the data cursor, we can find that the minimum is at -103.7kcalmol-1. Following the reaction towards the reactants gives a value of -103.8kJmol-1, meaning that the activation energy is 0.1kcalmol-1 or 0.419kJml-1.
Release of excess energy
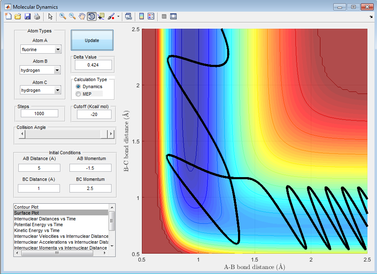
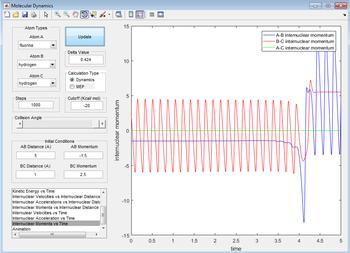
A reactive pathway was chosen to probe the release of excess energy in the reaction. The exothermic reaction (formation of HF) was chosen as this would be more likely to have excess energy after the reaction (it gives off energy) and so easier to probe. Coordinates of A-B=5Å, B-C=1, pA-B=-1.5 and pB-C= 2.5 were chosen.
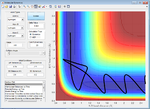
The reaction can be seen to go to completion (see below).
Figure 20: A surface plot showing a successful reaction for the reaction H2+F--->HF+H
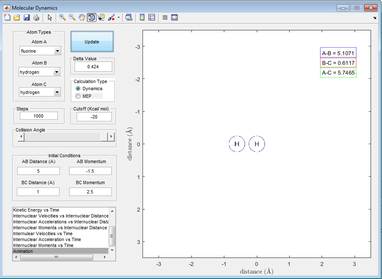
Initially, the H2 molecule vibrates on its own with the F atom off-screen.
Figure 21: A picture showing an H2 molecule (vibrating)
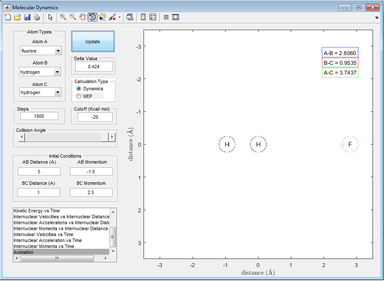
Then, the F atom approaches and the F atom follows the same vibrations as the H2 molecule, showing some form of long-range interaction.
Figure 22: A picture showing an F atom approaching the H2 molecule (vibrating)
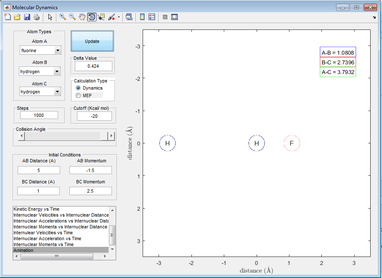
The F then falls into the H2 molecule and vibrates with it at larger oscillations, eventually causing the HF molecule to form and H to dissociate. The HF molecule then oscillates at a larger amplitude than H2.
Figure 23: A picture showing an HF and H formation (vibrating)
It can then be seen that the excess energy in the reaction has gone to increasing the vibration amplitude of the HF bond. This can be probed experimentally using calorimetry (although this measures average kinetic energy, made up of rotational, vibrational and translational contributions). A better way would be to measure the photons produced by the vibrating HF bond passively through some means, then the HF vibrational decay can be monitored (all other vibrational spectroscopies illuminate a sample, ruining the experiment by supplying extra energy). The internuclear momenta vs. time plot also corroborates my hypothesis (the peaks can be seen to be of higher amplitude post-reaction).
Figure 24: A plot showing internuclear momenta against time
F+H2--->HF+F
rHH=0.74Å
rFH=2.3Å
pFH=-0.5
| pHH | Success? | Screenshot |
|---|---|---|
| -3.0 | Failure | 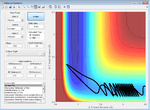 |
| -2.6 | Failure | 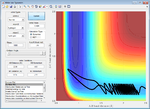 |
| -2.0 | Failure | 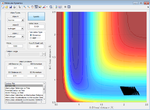 |
| -1.6 | Failure | 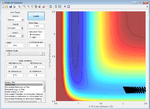 |
| -1.0 | Failure | 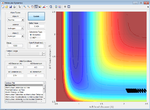 |
| -0.6 | Failure | 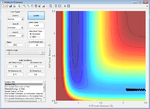 |
| 0.0 | Failure | 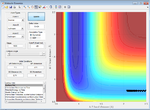 |
| 0.6 | Failure |  |
| 1.0 | Failure | 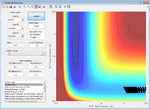 |
| 1.6 | Failure | 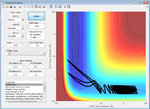 |
| 2.0 | Failure | 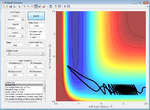 |
| 2.6 | Success | 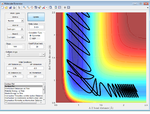 |
| 3.0 | Failure | 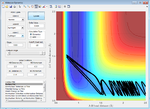 |
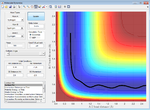
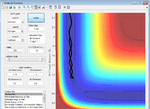
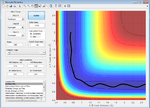
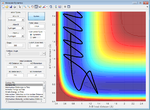
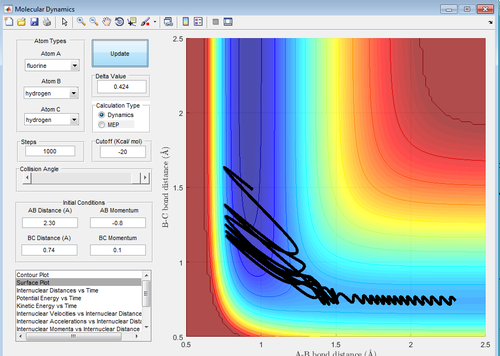
Figure 25-37: Surface plots showing reaction trajectories for various different parameters for the reaction H2+F--->HF+H
Changing pFH to -0.8 and pHH to 0.1 gives a successful reaction (shown below).
Figure 38: A surface plot showing a successful reaction trajectory for the conditions outlined above
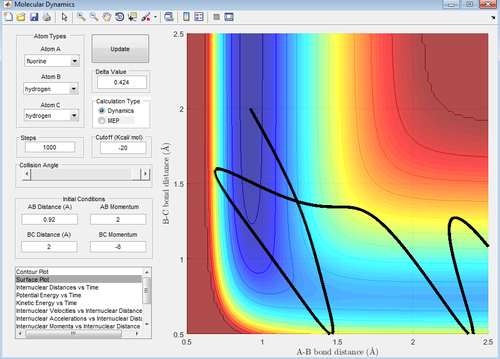
HF+H--->H2+F
Changing the momentum of HF to 1 and HH to -8 with rHH as 2Å and rFH as 0.92Å gives a successful reaction (picture below).
Figure 39: A surface plot showing a successful reaction trajectory for the conditions outlined above with the endothermic reaction (H2 formation).
The Polyani Rules
(Polanyi Tam10 (talk) 17:46, 16 May 2017 (BST))
The Polyani rules are twofold- that vibrational energy promotes a late-barrier reaction better than translational energy and that translational energy promotes an early-barrier reaction better than vibrational energy[9].
The H2+F--->HF+H reaction is exothermic, meaning that the reaction has a transition state closer to the reactants (by Hammond's postulate[8]) so there is an early barrier, meaning that translational energy should promote this reaction better than vibrational.
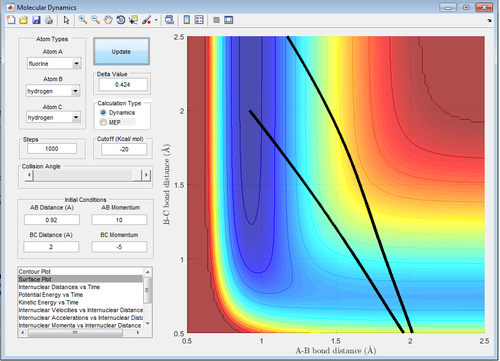
The endothermic reaction should then be promoted by vibrational energy, which it is, as any values above 1 work for the value of pFH too (see below).
Figure 40: A surface plot showing a successful reaction trajectory for the conditions outlined above with the endothermic reaction (H2 formation).
However, at a value of pHH of -5, the reaction fails to work at any large pFH, indicating that the rules don't always work, as vibrational energy should promote the endothermic reaction more than translational, but you can obviously supply too much energy to the system too. You need to balance the increase in vibrational with a decrease in translational energy to get a reactive pathway again (pFH=10, pHH=-1 works but pFH=10, pHH=-5 doesn't).
Figure 41: An unreactive reaction pathway, which, under Polyani's rules, should be reactive (H2 formation).
This discrepancy arises due to the fact that these rules are purely empirical and transition theory doesn't account for any barrier recrossing or quantum mechanical effects. It could also be due to the program limitations i.e. there is so much energy that the reaction falls off of the surface plot plotted by the 'lepsgui'[2] program.
References
<references> [2] [3] [4] [6] [7] [8] [5] [1]
- ↑ 1.0 1.1 1.2 1.3 1.4 1.5 http://www.chem.utoronto.ca/coursenotes/CHM223/Section%209D%20Fall%202010.pdf accessed on 12/5/2017
- ↑ 2.0 2.1 2.2 https://wiki.ch.ic.ac.uk/wiki/index.php?title=CP3MD accessed on 9/5/2017
- ↑ 3.0 3.1 https://www.pinterest.com/pin/253609022739068534/ accessed on 9/5/2017
- ↑ 4.0 4.1 4.2 http://klingon.uab.es/prat/Thesis/node52.html accessed on 9/5/2017
- ↑ 5.0 5.1 http://pubs.acs.org/doi/pdf/10.1021/j100238a002 accessed on 12/5/2017
- ↑ 6.0 6.1 6.2 https://www.unitjuggler.com/convert-energy-from-kcal-to-kJ.html accessed on 9/5/2017
- ↑ 7.0 7.1 7.2 http://www.wiredchemist.com/chemistry/data/bond_energies_lengths.html accessed on 9/5/2017
- ↑ 8.0 8.1 8.2 https://chem.libretexts.org/Reference/Organic_Chemistry_Glossary/Hammond%E2%80%99s_Postulate accessed on 11/5/2017
- ↑ http://pubs.acs.org/doi/pdf/10.1021/ar50053a001 accessed on 11/5/2017

