MRD:RLJ1501083003
Molecular Reaction Dynamics Computational Lab 2017
Exercise 1: H + H2 system
What value does the total gradient of the potential energy surface have at a minimum and at a transition structure? Briefly explain how minima and transition structures can be distinguished using the curvature of the potential energy surface.
The minima in a Potential Energy Surface (PES) which correspond to the reactant and product regions have a gradient of zero. In addition, the gradient of the curve is also zero at the transition state; this is because the transition states occurs at a saddle point (see Figure 1) on the curve (maximum on the minimum energy pathway which also has perpendicular minima).
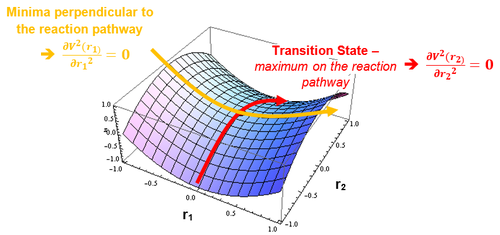
All of the above is depicted on the PES surface below:

In order to distinguish between the minima and transition state saddle point, the partial second derivative test could be used. This dictates that…

Report your best estimate of the transition state position (rts) and explain your reasoning illustrating it with a “Internuclear Distances vs Time” screenshot for a relevant trajectory.
I estimate that the transition state occurs when the inter-nuclear distance (r1=r2=rts) between adjacent atoms is equal to 0.908 Å. These distances should not fluctuate at the transition state in order to keep it symmetric and metastable, therefore the inter-nuclear distance vs. time graph should be constant. This was confirmed (see Figure 4 below) thus reaffirming that this is the position of the transition state.

Comment on how the mep and the trajectory you just calculated differ.
During the MEP calculation, in each time step, the velocity and thus the momenta of the atoms are always reset to zero. This therefore means they don’t have the energy to deviate from the minimum energy path and therefore the trajectory follows the valley floor (see Figure 5 below). And so setting the initial conditions such that the atoms are slightly displaced from the transition state will not alter the result of the MEP calculation.
On the other hand, in the dynamic calculation, the velocity isn’t reset to zero at each time step therefore the inertial motion of the atoms including molecular vibrations and environmental interactions provide the atoms with enough energy to diverge from the potential well. Hence the trajectory can be seen to oscillate slightly (see Figure 6 below). Thus this form of calculation is affected by the initial displacement of the atoms from the transition state.


The ‘inter-nuclear distance versus time’ and ‘inter-nuclear momenta versus time’ plots for the dynamic calculation are shown below (see Figures 7 and 8)…
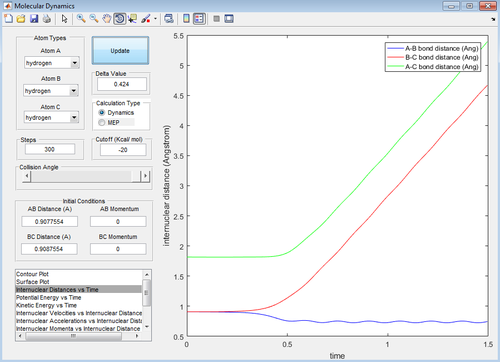

The internuclear distance of B-C increases linearly (reaches 4.7 Å at 1.5 seconds) past the transition state to form the detached C atom in the products. As a result of this, the internuclear B-C momentum increases sharply to 2.5. Conversely the A-B internuclear distance decreases slightly (to 0.75 Å at 1.5 seconds) and begins to oscillate depicting that the product A-B molecule has been formed. The A-B internuclear momentum can also be seen to oscillate between 1 – 1.5.
When the calculation was set up such that the final conditions (internuclear distances / momenta) were said to be the initial conditions, then reverse reaction, from product to reactants, occurs (see Figures 9 and 10 below)....


Complete the table by adding a column reporting if the trajectory is reactive or unreactive. For each set of initial conditions, provide a screenshot of the trajectory and a small description for what happens along the trajectory.
| r1 | r2 | p1 | p2 | (Un)reactive? |
|---|---|---|---|---|
| 0.74 | 2.0 | -1.25 | -2.5 | Reactive |
| -1.5 | -2.0 | Unreactive | ||
| -1.5 | -2.5 | Reactive | ||
| -2.5 | -5.0 | Unreactive | ||
| -2.5 | -5.2 | Reactive |

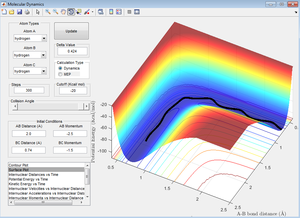
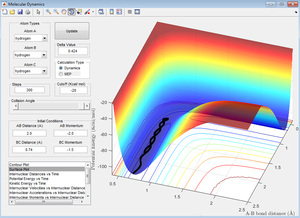

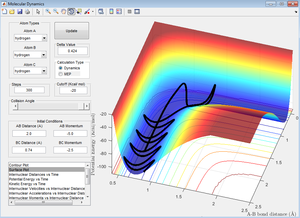
A major point to be noted from these simulations is that if there isn't the correct distribution of energy when the transition state is reached, the reaction will not proceed through to completion [2]. This is described by Polanyi's rules [3] which are discussed in more detail further along.
A second point to note is that the final two trajectories experience a phenomena called 'barrier re-crossing'. This is where the reaction proceeds past the transition state but then comes back. This again relates to Polanyi's rules which state that if mostly translational energy is required for the forward reaction to proceed then mostly vibrational energy is required for the reverse (and vice versa). Thus barrier recrossing may occur if the product molecules leave the activated complex with enough of the correct form of energy to push them back over the barrier.
State what are the main assumptions of Transition State Theory. Given the results you have obtained, how will Transition State Theory predictions for reaction rate values compare with experimental values?
There are several main assumptions when it comes to Transition state theory (TST) [4], these are:
- The theory assumes that all atoms behave according to classical mechanics (this however isn't the case as quantum effects such as tunnelling will have an effect on the motion of the atoms).
- TST also assumes that all molecules which pass through the saddle point transition state of a PES (sometimes called the 'Critical Dividing surface') will form products (again, this is not the case as barrier recrossing which was observed above can result in an unsuccessful trajectory).
- The third assumption is that the reactants will maintain a Boltzmann distribution of energy throughout the entire reaction.
- The final main assumption is that when the reactants pass through the transition state, the Boltzmann distribution of energy which they have at that time corresponds to the temperature of the system.
The experimental values for reaction rates are likely to be smaller than the true valuess due to both the quantum mechanic tunnelling and barrier recrossing effects mentioned above. These effects will mean it will take longer to form the products.
Exercise 2: F - H - H system
Classify the F + H2 and H + HF reactions according to their energetics (endothermic or exothermic). How does this relate to the bond strength of the chemical species involved?
F + H2
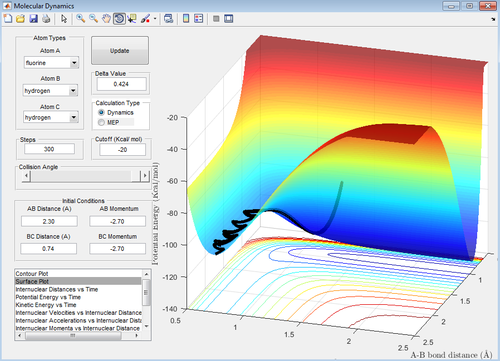
From the potential energy surface shown below (Figure 16), it is clear to see that the products have energy lower than that of the reactants; therefore the reaction must be exothermic. This is an indication that the ‘H-F’ bond is stronger than the ‘H-H’ bond as more energy was released when the new ‘H-F’ bond was formed than was required to break the original H-H bond.
H + HF
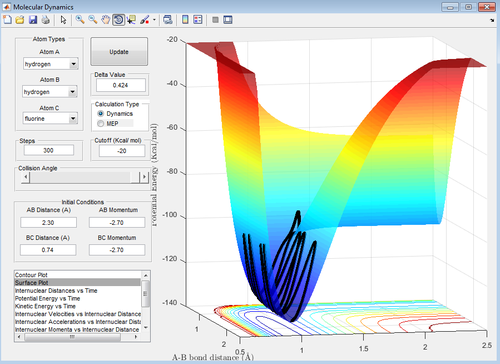
This reaction is the reverse of the reaction above and thus is expected to be endothermic. The results of the calculation confirm this hypothesis (energy level of the products is higher than that of the reactants) and can be seen below (Figure 17).
Locate the approximate position of the transition state.
Hammond's Postulate [5] states that ‘early transition states (exothermic) will resemble the reactants and late transition states (endothermic) resemble the products’. Thus for the exothermic F + H2 --> FH + H reaction, the early transition state should resemble the reactants. Therefore I began my search for the transition state in the reactant channel.
From the dynamic calculation, the location of the transition state was calculated to be 1.813 Å (see figure 18 below). This was confirmed by calculating the transition state of the reverse reaction which should theoretically appear at the same energy, and it does (see Figure 19 below).
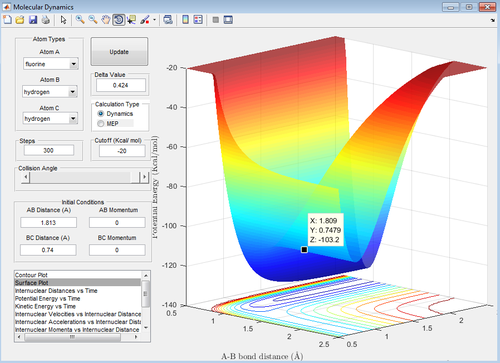
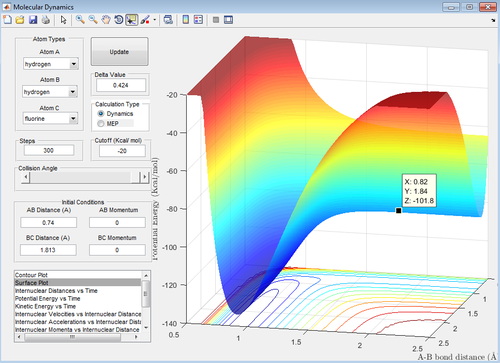
A more accurate value was found by doing an MEP simulation (distorting the position of the transition state slightly towards the reactants in order for the potential to ‘roll’ towards them in order to determine their energy) to produce a potential energy vs time plot; the results are shown in the picture below and give a transition state energy of -431.79 kJmol-1 (-103.2 kcal/mol-1).
(See figures 20 and 21 below for confirmation)
Conversion: 1 kcal = 4.184 kJ

Report the activation energy for both reactions.
The activation energy is defined as the energy difference between the reactants and the transition state. From the MEP calculation performed (see Figure 20 above) the energy of these two locations were determined. Thus using ‘Ea = ETS - EREACTANTS’, the activation energy of the forward exothermic reaction (F + H2 --> FH + H) was determined to be +0.787 kJmol-1 (0.188 kcal/mol-1). This low value of activation energy can be justified by the fact that the reaction is spontaneous and thus requires hardly any energy to proceed.
The value of the activation energy for the reverse reaction (H + HF --> H2 + F) is the difference between the transition state and the products. And so a second MEP calculation was run, distorting the position of the transition state slightly towards the products in order for the potential to ‘roll’ towards them in order to determine their energy. The results are shown in the picture below (Figure 21 below) and allowed the activation energy to be computed to be +126.56 kJmol-1 (30.248 kcal/mol-1).

In light of the fact that energy is conserved, discuss the mechanism of release of the reaction energy. How could this be confirmed experimentally?
Energy cannot be created or destroyed, it can only be transformed into different types. Thus when the bonds in an exothermic reaction are broken, the energy released is converted from potential energy to kinetic, which is then distributed amongst the surrounding particles. This overall increase in the kinetic energy of the particles results in an increase in particle vibrations (this can be seen by the heightened oscillating trajectory in the products channel in Figures 22 and 23) and thus an increase in temperature.
This rise in temperature can be measured using calorimetry [6] (see Equation 1 below) in order to confirm this is the mechanism which is actually taking place.


In addition, IR spectroscopy can be used to identify if a vibrationally excited bond is present in the products. If the vibrationally excited bond were present, numerous shifted peaks would appear with decreasing intensity as they represent the decreasing energy transitions between converging energy levels of an the anharmonic oscillator model.
Discuss how the distribution of energy between different modes (translation and vibration) affect the efficiency of the reaction, and how this is influenced by the position of the transition state.
All of the below figures (24 - 30) will be used in order to depict Polanyi's Empirical Rules [3] and how they relate to the efficiency of a reaction...
Polanyi's rules state that at an early transition state (exo), mostly translational energy is required in order for the reaction to proceed through the transition state to form products; conversely, a late transition state (endo) requires mostly vibrational energy.
Thus in order to maximise the reaction efficiency, the correct type of energy needs to be dominant at the transition state.
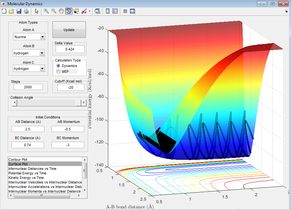
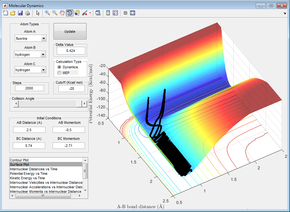


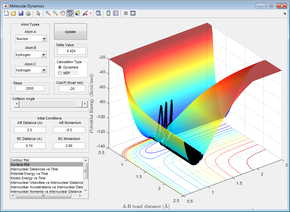
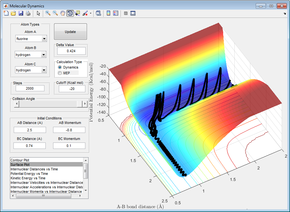
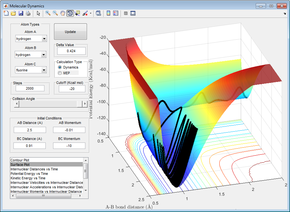
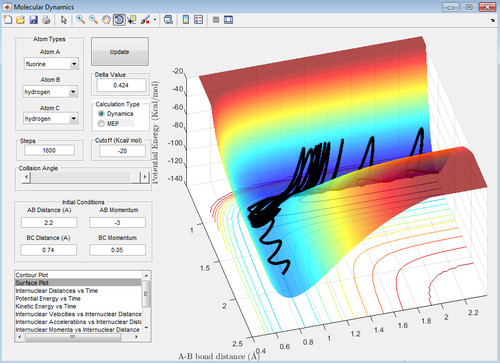
Figures 24 - 27 are all examples of simulations where the H=H bond vibration is inputting a lot of energy into the system (more than the activation energy). When this is the case, the outcome of the reaction trajectory (successful/unsuccessful) is much harder to predict. This can be observed by the fact that when pHH = -3, +2.69 and +3, the reaction is successful however the trajectory with pHH = -2.71 is unsuccessful.
However when the overall energy of the system is reduced (pHH = +0.1), it can be seen (Figure 28) that the atoms approach the early transition state with mostly translational energy (oscillations are small) therefore the reaction proceeds to products, obeying Polanyi's rules [3].
Polanyi's rules can be seen more clearly when using the endothermic reaction involving the F-H-H system. Figure 29 depicts the endothermic reaction where the initial energy of the atoms is mostly translational as they approach the transition state. Thus according to Polanyi's rules, this reaction should not go to completion (as mostly vibrational energy is required to reach the high activation energy) which it does not and can be seen not to on Figure 29.
On the other hand, the reactants in Figure 30 can be seen to have a lot of vibrational energy on approach to the late transition state, this is favourable according to Polanyi thus products should form. This is the case as can be seen in Figure 30.
Polanyi's rules however are only empirical and thus cannot be used to explain the reasoning behind the reaction energetics but can be used to predict what should occur.
15:39, 2 June 2017 (BST) Well done an exclellent report and very clear. You correctly proved polyani's rules well done.
References
- ↑ http://wwwf.imperial.ac.uk/metric/metric_public/glossary/glossary.html
- ↑ ATKINS, P. and DE PAULA, J., 2014. Atkins’ Physical chemistry. Oxford: Oxford University Press, 10, pp. 894-913.
- ↑ 3.0 3.1 3.2 ZHANG, Z.; ZHOU, Y.; ZHANG, D. H.; CZAKO, G.; BOWMAN, J. M. J., 2012. Phys. Chem. Lett., 3(23), pp.3416–3419.
- ↑ LEVINE, I. N., 2009, Physical Chemistry, pp. 893.
- ↑ MEANY, J. E.; MINDERHOUT, V.; POCKER, Y. J., 2001. Chem. Educ., 78(2), pp. 204.
- ↑ KOKES, R. J.; DORFMAN, M. K.; MATHIA, T. J.,1962. Chem. Educ., 39(2), pp. 90.
